EVENT TimeMapper Visualizer
Dataset: GDELT Event Database
Description: Creates a timecoded Google Earth .KML file that allows you to visualize change over time and space, as well as a .CSV file for importing into GIS software and web mapping services.
Components: PERL, R, Google BigQuery
Acknowledgements: Makes use of Google BigQuery.
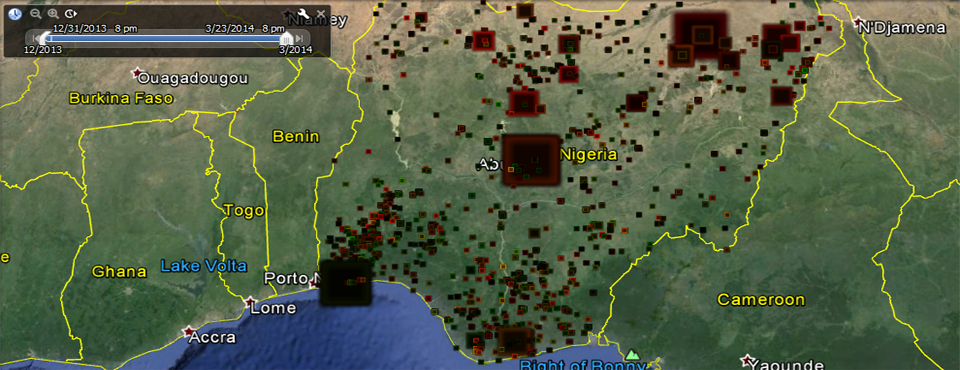
Example: Visualization of Nigeria in 2014
The EVENT TimeMapper Visualizer allows you to create unique spatio-temporal visualization that overlays all events matching your search onto a Google Earth display and timecodes each event such that you can use the Google Earth "time slider" feature to scroll through time to see patterns in how the matching events move through space over time. Events are clustered by date and location, so multiple events at the same location on a single day are collapsed into a single point on the visualization. Each location is color-coded according to the average Goldstein Scale of all events at that location on that day, from bright red (high conflict) to bright green (high cooperation), and sized based on the total number of events at that location on that day. Clicking on a location will display a popup with the number of events at that location on that date and a source citation for one of the events drawn at random. A .CSV file is also produced that contains the same information, but is designed for import to time-aware GIS software and/or web mapping services. This is one of the most advanced GDELT visualization tools in that it combines so many different dimensions into a single display that allows you to understand at-a-glance the macro-level patterns of your search.
No programming or technical skills are required to use this timeline visualization - you simply specify a set of criteria for the event type and actors involved, along with an optional date range, and the system will automatically search the entire GDELT Event Database for all matching entries and compile the final timeline. Your results will be emailed to you when complete, usually within 10 minutes, depending on server load and the time it takes to perform the necessary calculations. All GDELT Event Database records are scanned for your search parameters and the average prevalance of matching records is averaged by day. Thus, selecting "Nigeria" as the "Event Location", "Material Conflict" as the "Event Quad Class", and "Civilian" as the "Recipient/Victim (Actor2) Type" will generate a visualization of attacks against civilians and other conflict involving cvilians in Nigeria, with the ability to move the Google Earth timeslider back and forth to watching how violence has transitioned across the country.