1
$\begingroup$

I'm trying to understand why Matlab function upsample causes contraction in the spectrum, like the following figure shows. enter image description here

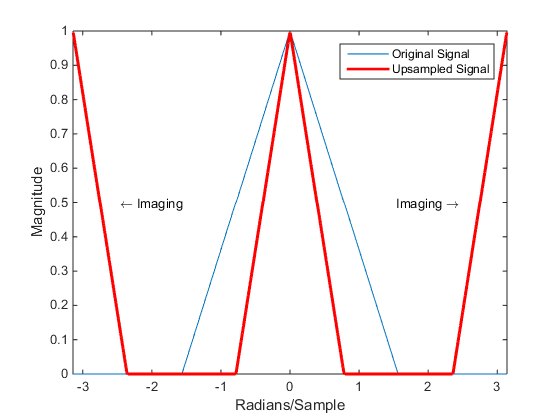
Also showed in mathwork online document.

enter link description here

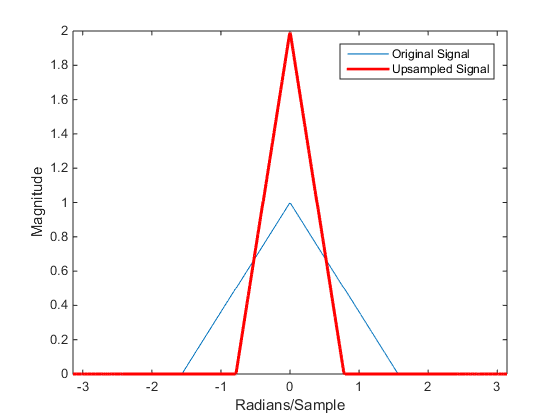
Filtering after upsampling removes the imaging artifacts, but contraction still stays, as shown below. Could anyone help explain in details why? enter image description here

enter link description here

$\endgroup$

1 Answer 1

3
$\begingroup$

I prefer to think of it as expanding the spectrum due to increasing the sample rate. When you expand the frequency spectrum you reveal the aliases that were already there in the other Nyquist zones. See this answer for more detail about this.

$\endgroup$

Start asking to get answers

Find the answer to your question by asking.

Ask question

Explore related questions

See similar questions with these tags.