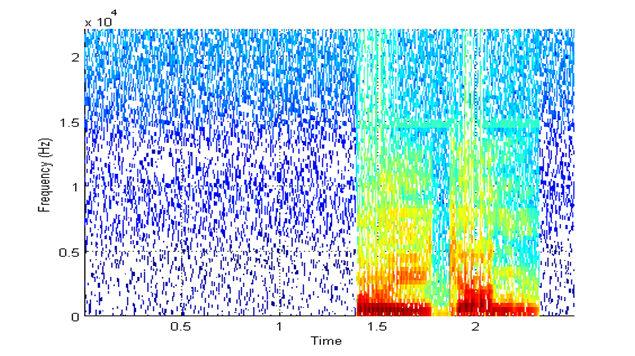
Here are the spectrogram plots:
Matlab version:
Audacity version:

the darker parts towards the right of the figure show speech. Silence was added to the left of the figure in audacity. This silent portion does not show any thing in the spectrogram as plotted by audacity which is as expected. but the same silence portion is covered with blue dots in case of the matlab plot. Why didn't Matlab plot it with all white (since it is silence added through software and is not supposed to have any energy)?