If you don't mind having histograms on left and bottom frames you can use DensityHistogram with the Method suboption "DistributionAxes".
With this approach, in addition to histograms, you can have box-whisker chart, smooth histogram or data rug to represent the marginal distributions of input data:
SeedRandom[1] data = RandomReal[BinormalDistribution[{0, 0}, {1, 1}, 0.5], 300]; DensityHistogram[data, {15, 12}, ImageSize -> Medium, ColorFunction -> (Blend[{LightRed, Red}, #] &), Method -> {"DistributionAxes" -> #}, PlotLabel -> Style[#, 16], ChartElementFunction -> ({ChartElementData["Rectangle"][##], Black, AbsolutePointSize @ 3, Point @ #2} &)] & /@ {"Histogram", "Lines", "BoxWhisker", "SmoothHistogram"} Multicolumn[%, 2] & 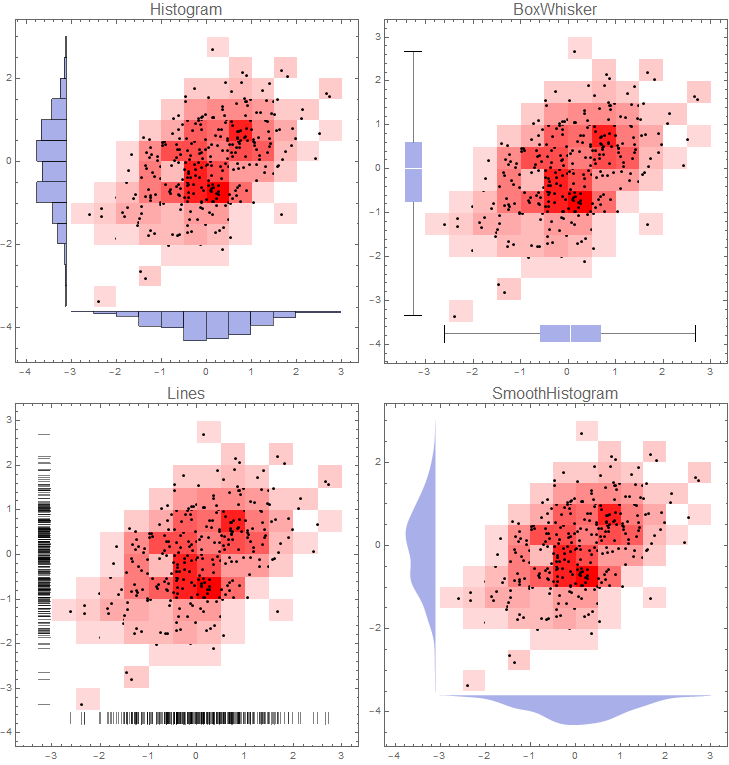
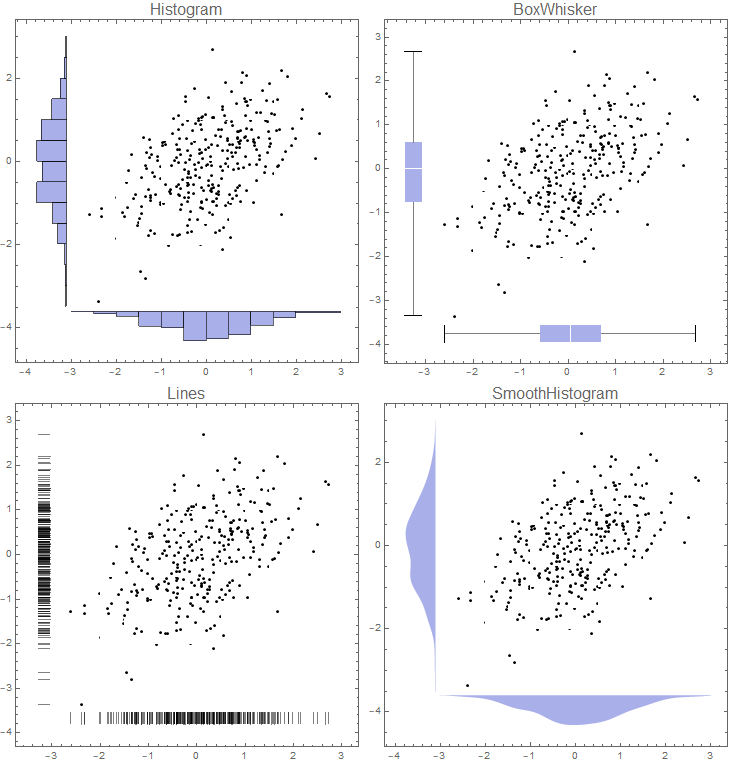
If you want to remove colors from 2D bins use `ColorFunction -> (White &) to get:
Note: I used a custom ChartElementFunction to add the data points above. Alternatively, you can replace the option ChartElementFunction -> ... with
Epilog -> {First[ListPlot[data, PlotStyle -> Directive[Black, AbsolutePointSize @ 3]]]} to get the same picture.