Since v12.3, we have ListLinePlot3D, so we can do something like:
domain = {{-2, 2}, {-3, 3}}; ListLinePlot3D[Array[{x, y} |-> Sin[x^2 - y], {50, 15}, domain]\[Transpose], DataRange -> domain, AxesLabel -> {x, y}] 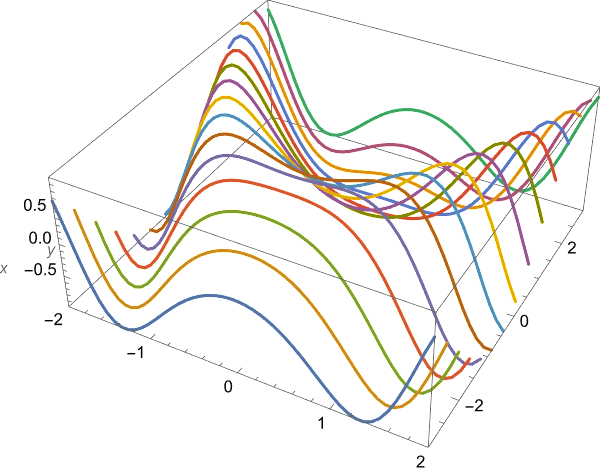
Alternatively (slower and less elegant, but easier to understand):
{{xL, xR}, {yL, yR}} = {{-2, 2}, {-3, 3}}; pointsx = 50; pointsy = 15; ListLinePlot3D[ Table[{x, y, Sin[x^2 - y]}, {y, yL, yR, (yR - yL)/(pointsy - 1)}, {x, xL, xR, ( xR - xL)/(pointsx - 1)}], AxesLabel -> {x, y}]