Clear["Global`*"]; a = {Sqrt[2], 0, 0}; b = {0, Sqrt[2], 0}; c = -a; d = -b; o = Mean[{a, b, c, d}] h = Sqrt[6]/2; a1 = {Sqrt[2]/2, 0, h}; b1 = {0, Sqrt[2]/2, h}; c1 = {-Sqrt[2]/2, 0, h}; d1 = {0, -Sqrt[2]/2, h}; o1 = Mean[{a1, b1, c1, d1}] labels = {Text[Style[O, 12, FontFamily -> "Times"], o, {-1, -1}], Text[Style[O1, 12, FontFamily -> "Times"], o1, {-1, -1}], Text[Style[A, 12, FontFamily -> "Times"], a, {-1, -1}], Text[Style[B, 12, FontFamily -> "Times"], b, {1, 1}], Text[Style[C, 12, FontFamily -> "Times"], c, {1, 1}], Text[Style[D, 12, FontFamily -> "Times"], d, {-2, 0}], Text[Style[A1, 12, FontFamily -> "Times"], a1, {3, 0}], Text[Style[B1, 12, FontFamily -> "Times"], b1, {-1, -2}], Text[Style[C1, 12, FontFamily -> "Times"], c1, {0, 1}], Text[Style[D1, 12, FontFamily -> "Times"], d1, {3, 0}]}; dashLines = {Dashed, AbsoluteThickness[2], {Line[{{o, o1}, {d, d1}}]}, {Red, Line[{{c, d}, {a, d}, {b, d}, {a, c}}]}}; realLines = {AbsoluteThickness[2], Line[{{a, b}, {a, d}, {d, d1}, {b, b1}, {a1, a}, {b, b1}, {b1, a1}, {c, c1}, {b1, c1}, {c1, d1}, {b, c}, {a1, c1}, {b1, d1}, {a1, d1}}]}; Show[Graphics3D[{dashLines, realLines, labels}, Boxed -> False, ViewPoint -> {2, 3.5, 1.28}], Graphics3D[{Arrow[{{o1 - o, o1 - o + {0, 0, 1}}, {a - o, a - o + {1, 0, 0}}, {b - o, b - o + {0, 1, 0}}}], Text[Style["z", 20, Italic, FontFamily -> "Times"], o1 - o + {0, 0, 1}, {-1, -1}], Text[Style["y", 20, Italic, FontFamily -> "Times"], b - o + {0, 1, 0}, {-2, -1}], Text[Style["x", 20, Italic, FontFamily -> "Times"], a - o + {1, 0, 0}, {2, -1}]}]] Became Hot Network Question
How to optimize the method of drawing a square prism?
In the square prism ABCD A1B1C1D1, the bottom side lengths are all equal, where AB=2, and the top and bottom side lengths are all equal, where A1B1=1, and the side edge length AA1=Sqrt[2]
My method is to calculate the height of the prism using known conditions, and how to write the coordinates of each point and draw them.
Clear["Global`*"]; a = {Sqrt[2], 0, 0}; b = {0, Sqrt[2], 0}; c = -a; d = -b; o = Mean[{a, b, c, d}] h = Sqrt[6]/2; a1 = {Sqrt[2]/2, 0, h}; b1 = {0, Sqrt[2]/2, h}; c1 = {-Sqrt[2]/2, 0, h}; d1 = {0, -Sqrt[2]/2, h}; o1 = Mean[{a1, b1, c1, d1}] labels = {Text[Style[O, 12, FontFamily -> "Times"], o, {-1, -1}], Text[Style[O1, 12, FontFamily -> "Times"], o1, {-1, -1}], Text[Style[A, 12, FontFamily -> "Times"], a, {-1, -1}], Text[Style[B, 12, FontFamily -> "Times"], b, {1, 1}], Text[Style[C, 12, FontFamily -> "Times"], c, {1, 1}], Text[Style[D, 12, FontFamily -> "Times"], d, {-2, 0}], Text[Style[A1, 12, FontFamily -> "Times"], a1, {3, 0}], Text[Style[B1, 12, FontFamily -> "Times"], b1, {-1, -2}], Text[Style[C1, 12, FontFamily -> "Times"], c1, {0, 1}], Text[Style[D1, 12, FontFamily -> "Times"], d1, {3, 0}]}; dashLines = {Dashed, AbsoluteThickness[2], {Line[{o, o1}]}, {Red, Line[{{c, d}, {b, d}, {a, c}}]}}; realLines = {AbsoluteThickness[2], Line[{{a, b}, {a, d}, {d, d1}, {b, b1}, {a1, a}, {b, b1}, {b1, a1}, {c, c1}, {b1, c1}, {c1, d1}, {b, c}, {a1, c1}, {b1, d1}, {a1, d1}}]}; Show[Graphics3D[{dashLines, realLines, labels}, Boxed -> False, ViewPoint -> {2, 3.5, 1.28}], Graphics3D[{Arrow[{{o1 - o, o1 - o + {0, 0, 1}}, {a - o, a - o + {1, 0, 0}}, {b - o, b - o + {0, 1, 0}}}], Text[Style["z", 20, Italic, FontFamily -> "Times"], o1 - o + {0, 0, 1}, {-1, -1}], Text[Style["y", 20, Italic, FontFamily -> "Times"], b - o + {0, 1, 0}, {-2, -1}], Text[Style["x", 20, Italic, FontFamily -> "Times"], a - o + {1, 0, 0}, {2, -1}]}]] 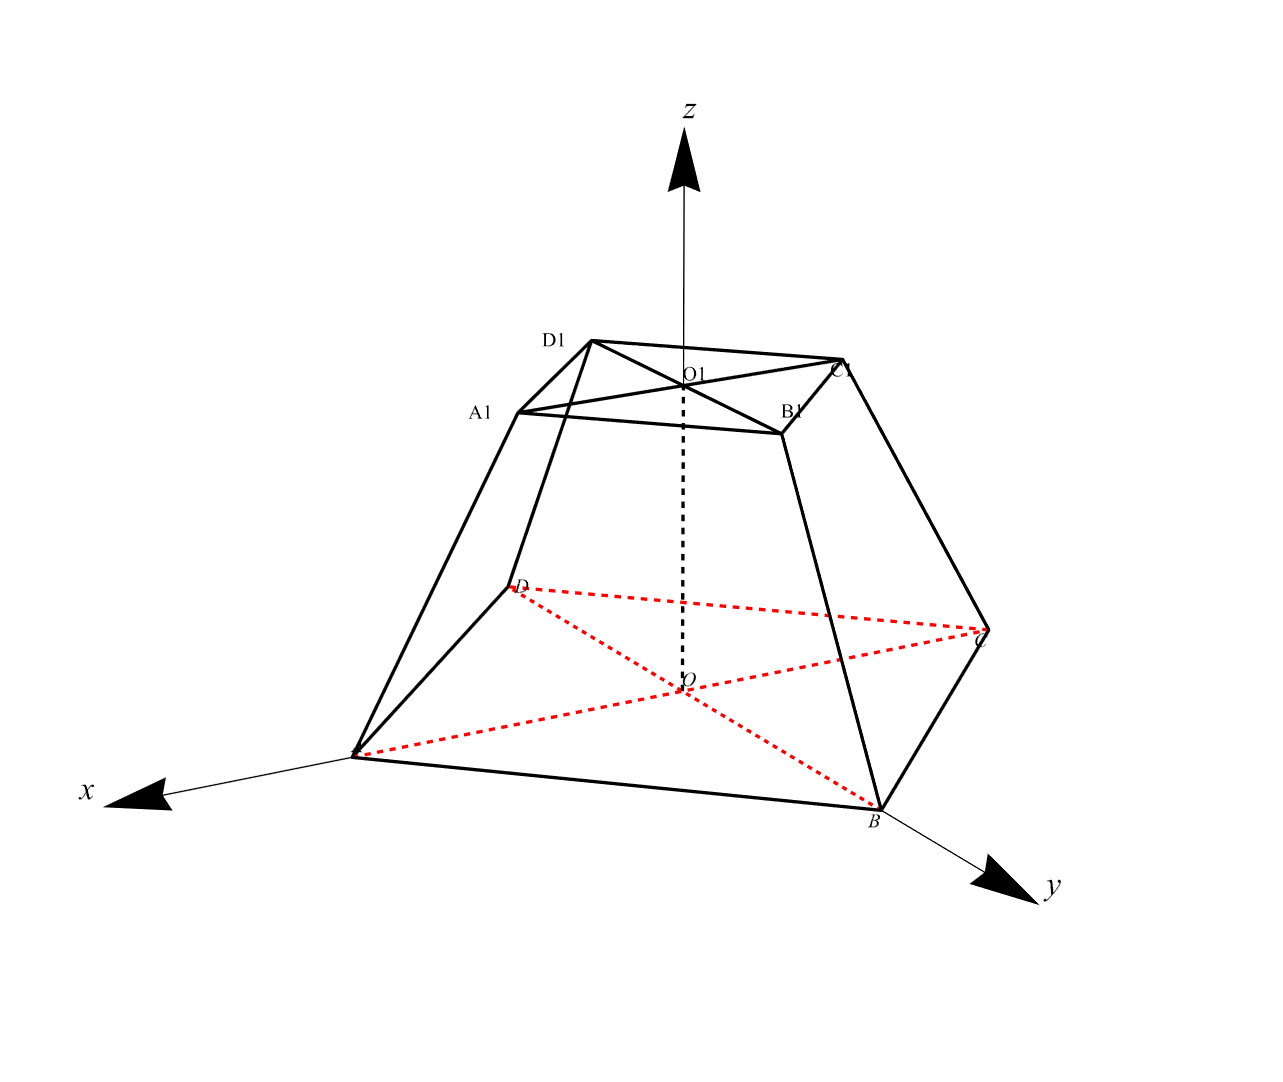
What better method or code optimization is there?