I'm visualizing some hydrogen like atomic orbitals. For looking at plane slices of the probability density, the DensityPlot function works well, and with something like:
Manipulate[ DensityPlot[ psi1XYsq[u, v, z], {u, -w, w}, {v, -w, w} , Mesh -> False, Frame -> False, PlotPoints -> 45, ColorFunctionScaling -> True, ColorFunction -> "SunsetColors"] , {{w, 10}, 1, 20} , {z, 1, 20, 1} ] I can get a nice plot 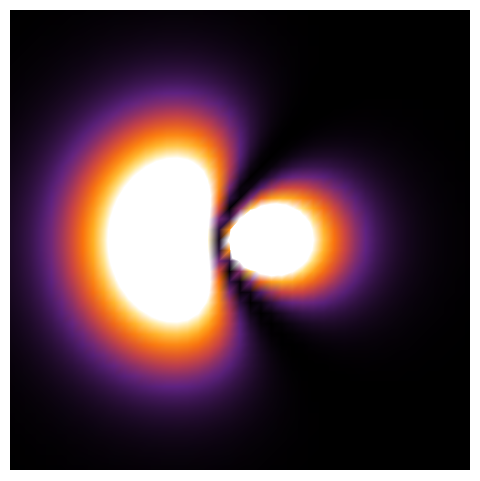
I was hoping that there was something like a DensityPlot3D so that I could visualize these in 3D, but I don't see such a function. I was wondering how DensityPlot be simulated using other plot functions, so that the same idea could be applied to a 3D plot to construct a DensityPlot3D like function?