It is very nice and very easy to make a sketch of a phase portraitphase portrait with StreamPlot. For example, for the classical pendulum, defined by
\begin{eqnarray*} \dot x&=&y,\\ \dot y&=&-\sin x, \end{eqnarray*}
The code
StreamPlot[{y, -Sin[x]}, {x, -5, 5}, {y, -3, 3}, Frame -> None, StreamPoints -> Fine, AspectRatio -> 0.8, Epilog -> {PointSize -> Large, Point[{{0, 0}, {\[Pi], 0}, {-\[Pi], 0}}]}] produces
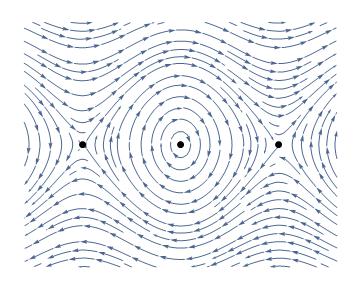
Now to the question. The actual phase space for the pendulum is not the plane $\mathbf R^2$, but the cylinder $\mathbf S^1\times \mathbf R$, and the pendulum of course has only two equilibria, one at $(0,0)$ and another one at $(\pi,0)$. Actually two points in the graph, the left and the right ones, are the same equilibrium.
Question: How in Mathematica I can efficiently plot my phase portrait on a cylinder, such that I have only two equilibria, and I could see through the whole cylinder (I found examples on the site how to put a texture on a cylinder, but cannot figure out how to make it transparent).