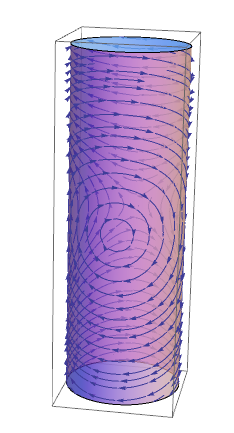
plot = StreamPlot[{y, -Sin[x]}, {x, -Pi, Pi}, {y, -3, 3}, Frame -> None, Epilog -> {PointSize -> Large, Point[{{0, 0}, {π, 0}, {-π, 0}}]}, StreamPoints -> Fine, AspectRatio -> 0.8] Try this:
First[Normal@plot] /. a_Arrow :> ( a /. {x_Real, y_Real} :> {Cos[x], Sin[x], y} ) // Graphics3D 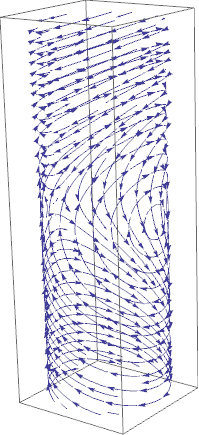
You can add Cylinder if you want:
Show[ %, Graphics3D@{[email protected], LightBlue, Cylinder[{{0, 0, -3}, {0, 0, 3}}]} ]