6
$\begingroup$

I asked a question about filling the space between two curves (Sin and Cos) with random points and the answer I received does not work for InterpolatingFunctions. How can I fill the space between two BezierCurves or InterpolatingFunctions?

For example, I have the BezierCurves c1 and c2:

c1 = {{0, 0}, {2, 0}, {2, 1}}; c2 = {{0, 0.25}, {1.75, 0.25}, {1.75, 1}}; Graphics[{BezierCurve@c1,BezierCurve@c2}] 

I can use RandomPoint by turning these curves into a Polygon:

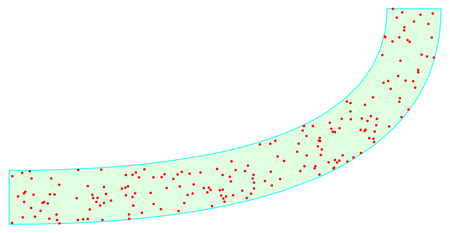
f[c_] := Quiet@ Interpolation[BezierFunction[c][#] & /@ Range[0, 1, 0.01]]; g[c_] := {#, f[c][#]} & /@ Range[0, c[[-1, 1]], 0.01]; h1 = Join[{c2[[1]]}, g@c1]; h2 = Join[g@c2, {c1[[-1]]}]; Graphics[{ Point@RandomPoint[Polygon@Join[h1, h2], 500], Thick, Line@h1, Line@h2 }] 

enter image description here

My question is, is there a better/more efficient way of doing this?

$\endgroup$
1
  • 1
    $\begingroup$ To people trying to solve this: here is a possible pitfall to be aware of. $\endgroup$ Commented Apr 21, 2017 at 16:03

3 Answers 3

3
$\begingroup$
  • Only add a Line and set CurveClosed -> True to draw a closed contour.
c1 = {{0, 0}, {2, 0}, {2, 1}}; c2 = {{0, 0.25}, {1.75, 0.25}, {1.75, 1}}; reg = JoinedCurve[{BezierCurve@c1, Line[{Last@c1, Last@c2}], BezierCurve@Reverse@c2}, CurveClosed -> True] // BoundaryDiscretizeGraphics; Graphics[{{EdgeForm[Cyan], FaceForm[LightGreen], reg}, Red, Point@RandomPoint[reg, 200]}] 

enter image description here

$\endgroup$
1
$\begingroup$

you can do it with sorcery...

c1 = {{2, 1}, {2, 0}, {0, 0}}; c2 = {{0, 0.25}, {1.75, 0.25}, {1.75, 1}}; gk = JoinedCurve[{Line[{{0, 0}, {0, 0.25}}], BezierCurve@c2, Line[{{1.75, 1}, {2, 1}}], BezierCurve@c1}]; Graphics[{Black, FilledCurve[{BezierCurve@c1, Line[{{0, 0}, {0, 0.25}}], BezierCurve@c2, Line[{{1.75, 1}, {2, 1}}]}], White, Point[RandomPoint[Disk[{1, 0.45}, {1.3, 0.9}], 5000]]}] 

:)

$\endgroup$
1
$\begingroup$

(Not an answer -- a comment/follow-up of the answer by @cvgmt.)

I expected NIntegerate to work also for this.

c1 = {{0, 0}, {2, 0}, {2, 1}}; c2 = {{0, 0.25}, {1.75, 0.25}, {1.75, 1}}; reg = JoinedCurve[{BezierCurve@c1, Line[{Last@c1, Last@c2}], BezierCurve@Reverse@c2}, CurveClosed -> True] // BoundaryDiscretizeGraphics; res = Reap@ NIntegrate[x, x \[Element] reg, Method -> "MonteCarlo", PrecisionGoal -> 1.2, EvaluationMonitor :> Sow[{x}]] 

But it gives the monitored point unevaluated:

{{0.596312, 0.204349}, {{{x}, {x}, {x}, {x},... 

This work around can be used, but that is suboptimal:

res = Reap@ NIntegrate[x*Boole[{x, y} \[Element] reg], {x, -2, 2}, {y, -2, 2}, Method -> "MonteCarlo", PrecisionGoal -> 1.2, EvaluationMonitor :> Sow[{x, y}]]; Graphics[Point@Pick[res[[2, 1]], # \[Element] reg & /@ res[[2, 1]]], AspectRatio -> Automatic] 

enter image description here

$\endgroup$
2
  • 1
    $\begingroup$ This works for me: res = Reap@NIntegrate[1, {x, y} \[Element] reg, Method -> "MonteCarlo", PrecisionGoal -> 1.2, EvaluationMonitor :> Sow@{x, y}]; $\endgroup$ Commented Feb 25, 2024 at 18:03
  • $\begingroup$ @Goofy Thank you! Good to know! $\endgroup$ Commented Feb 25, 2024 at 18:18

Start asking to get answers

Find the answer to your question by asking.

Ask question

Explore related questions

See similar questions with these tags.