Is this a bug, or something going over my head? When using the following code, nothing "special" happens:
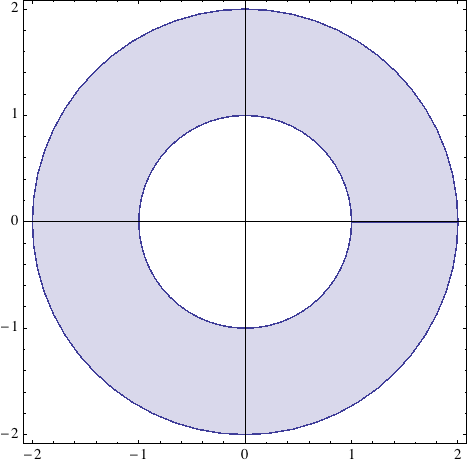
ParametricPlot[a {Cos[t], Sin[t]}, {a, 1, 2}, {t, 0, 2 Pi}, Mesh -> None, PlotStyle -> Opacity[0.2]] it works as expected, one gets this graphic, without any mesh lines:
When adding Graphics[] in front of that—as I'd like to Show such a ParametricPlot with some other graphics, I get this:
Show[ Graphics[], ParametricPlot[a {Cos[t], Sin[t]}, {a, 1, 2}, {t, 0, 2 Pi}, Mesh -> None, PlotStyle -> Opacity[0.2]] ] yields:
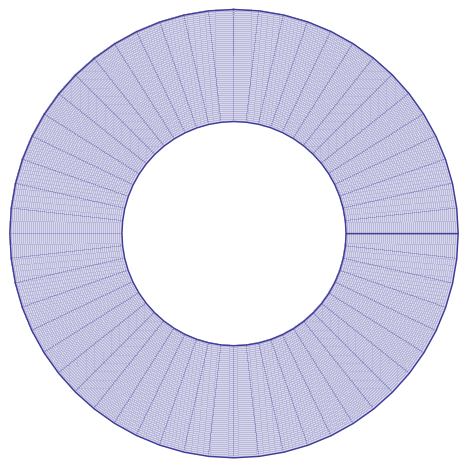
Why do those mesh-lines come up? Are those actually Mesh-lines, as I used Mesh -> None? How can I delete those lines, while still using Show and others Graphics[]?
Thanks for all help!
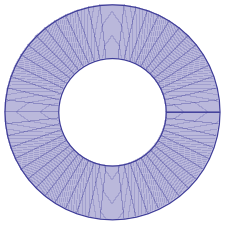
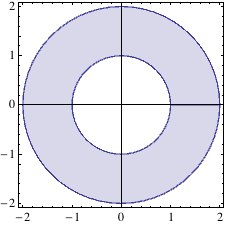
Show[Graphics[{}, Method -> {"TransparentPolygonMesh" -> True} ], ParametricPlot[a {Cos[t], Sin[t]}, {a, 1, 2}, {t, 0, 2 Pi}, Mesh -> None, PlotStyle -> Opacity[0.2]]]- see this Q&A for more... $\endgroup$