At least in v10.1 ContourPlot doesn't support ScalingFunctions, but ListLinePlot does, unofficially. Therefore this might be of some use.
Using logscale from ListLogLinearPlot for the whole real numbers :
logify[_][x_ /; x == 0] := 0 logify[off_][x_] := Sign[x] Max[0, (off + Re@Log@x)/off] inverse[off_][x_] := Sign[x] Exp[(Abs[x] - 1) off] logscale[n_] := {logify[n], inverse[n]} (* additional definition *) logscale[n_, m_] := logscale /@ {n, m} Now:
cp = ContourPlot[ 729 + x^4 + y^4 + 3 x^2 (-225 + y^2) == 730 y^2, {x, -32, 32}, {y, -34, 34}, MaxRecursion -> 3]; pts = Cases[Normal@cp, Line[x_] :> x, -3]; ListLinePlot[pts, ScalingFunctions -> logscale[2, 2], AspectRatio -> 1] 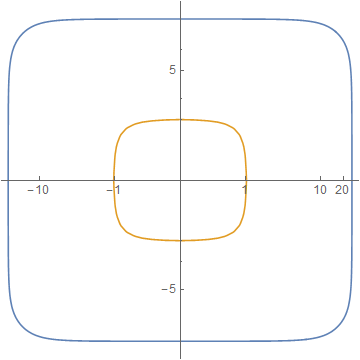
You can change the numeric parameters in logscale to get different effects; see the linked post for further examples.
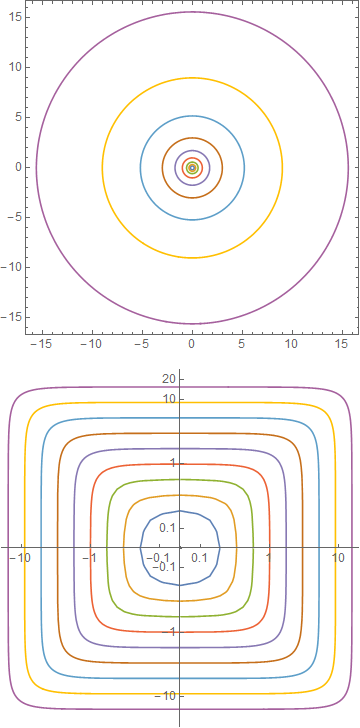
An additional example:
cp2 = ContourPlot[ Evaluate[x^2 + y^2 == # & /@ (3^Range[-3, 5])], {x, -16, 16}, {y, -16, 16}, PlotPoints -> 50] pts2 = Cases[Normal@cp2, Line[x_] :> x, -3]; ListLinePlot[pts2, ScalingFunctions -> logscale[3, 3], AspectRatio -> 1]