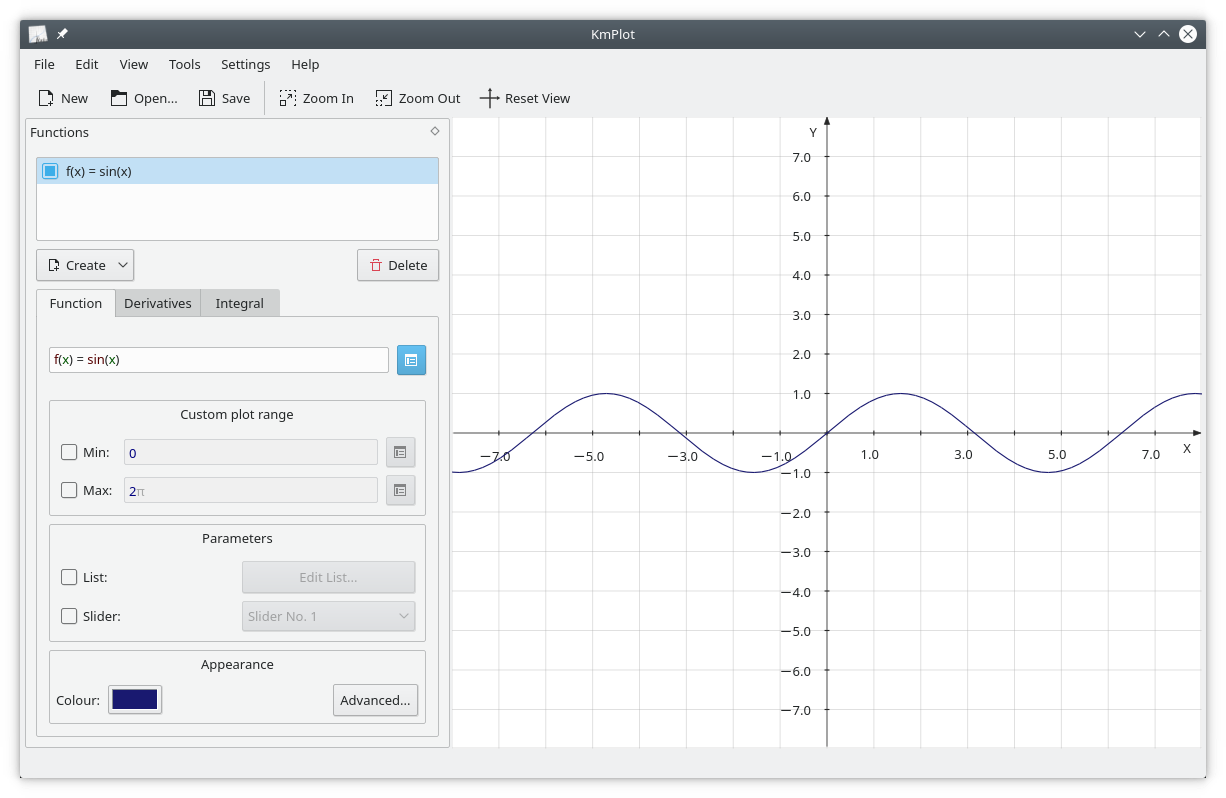
KmPlot is a program to plot graphs of functions, their integrals or derivatives. The graphs can be colorized and the view is highly configurable, is scalable, and can be zoomed. The program features a powerful mathematical parser, different plot types (cartesian, parametric, polar, implicit, differential), and provides simple mathematical tools like for finding maximum/minimum of a function. Parametrized functions can be visualized by adjusting the variable parameter via a slider. Plots can be exported as bitmap format pictures (BMP, PNG) and can be printed.

Install on
Linux


Buraxılışlar RSS
1.3.25122 2026-02-05
1.3.25121 2026-01-08
1.3.25120 2025-12-11
1.3.25083 2025-11-06
1.3.25082 2025-10-09
1.3.25081 2025-09-11
1.3.25080 2025-08-14
1.3.25043 2025-07-03
1.3.25042 2025-06-05
1.3.25041 2025-05-08
1.3.25040 2025-04-17
1.3.24123 2025-03-06
1.3.24122 2025-02-06
1.3.24121 2025-01-09
1.3.24120 2024-12-12
1.3.24083 2024-11-07
1.3.24082 2024-10-10
1.3.24081 2024-09-12
1.3.24080 2024-08-22
1.3.24052 2024-07-04
1.3.24051 2024-06-13
1.3.24050 2024-05-23
1.3.24022 2024-04-11
1.3.24021 2024-03-21
1.3.24020 2024-02-28
1.3.23085 2024-02-15
Nightly installers
KmPlot nightly installers are also available to download from the KDE CDN. These versions are intended for testing purpose. Get involved and help us make them better!
Qeyri-stabil versiya.
Tərtibat mərhələsi şöbəsinin sonucu versiyasından yaradılıb.