
Category:gnuplot
command-line plotting program 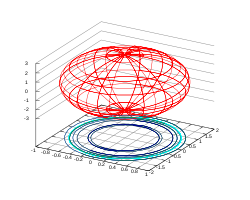 | |||||
| Upload media | |||||
| Instance of |
| ||||
|---|---|---|---|---|---|
| Part of |
| ||||
| Copyright license |
| ||||
| Has use | |||||
| Developer |
| ||||
| Operating system |
| ||||
| Software version identifier |
| ||||
| Inception |
| ||||
| user manual URL | |||||
| official website | |||||
| |||||
Media in category "gnuplot"
The following 84 files are in this category, out of 84 total.
-
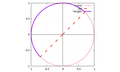
 A parametric curve with a tangent and a normal 01.png 640 × 384; 17 KB
-
 A parametric curve with a tangent and a normal 02.png 640 × 384; 32 KB
-
 A parametric curve with a tangent and a normal 03.png 640 × 384; 23 KB
-
 A parametric curve with a tangent and a normal 04.png 640 × 384; 26 KB
-
 A parametric curve with a tangent and a normal 05.png 640 × 384; 32 KB
-
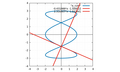
 Branch of a graph with gnuplot 02.svg 800 × 480; 28 KB
-
 Branch of a graph with gnuplot.svg 800 × 480; 24 KB
-
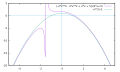
.png/120px-Calculer_la_courbure_pour_une_fonction_cos(x).png) Calculer la courbure pour une fonction cos(x).png 640 × 384; 23 KB
Calculer la courbure pour une fonction cos(x).png 640 × 384; 23 KB
-
_01.png/120px-Calculer_la_courbure_pour_une_fonction_exp(x**2)_01.png) Calculer la courbure pour une fonction exp(x**2) 01.png 640 × 384; 20 KB
Calculer la courbure pour une fonction exp(x**2) 01.png 640 × 384; 20 KB
-
.png/120px-Calculer_la_courbure_pour_une_fonction_log(x-1).png) Calculer la courbure pour une fonction log(x-1).png 640 × 384; 21 KB
Calculer la courbure pour une fonction log(x-1).png 640 × 384; 21 KB
-
 Calculer la courbure pour une fonction paramétrique 2d 01.png 640 × 384; 24 KB
-
 Calculer la courbure pour une fonction paramétrique 2d 02.png 640 × 384; 28 KB
-
 Causal function with gnuplot and C language.png 640 × 384; 19 KB
-
 Cm.png 500 × 500; 43 KB
-
 Draw a typical circular sector 01.png 640 × 384; 49 KB
-
 Draw a typical circular sector 02.png 640 × 384; 44 KB
-
 Draw tangent of a vectoriel function 01.png 640 × 384; 23 KB
-
 Draw tangent of a vectoriel function 02.png 640 × 384; 27 KB
-
 Draw tangent of a vectoriel function 03.png 640 × 384; 37 KB
-
 Draw the tangent of a vectoriel function in 3d 01.png 640 × 384; 31 KB
-
 Draw the tangent of a vectoriel function in 3d 02.png 640 × 384; 24 KB
-
,g(t))_01.png/120px-Draw_the_velocity_and_the_accelerator_vectors_at_the_point_P(f(t),g(t))_01.png)
-
,g(t))_02.png/120px-Draw_the_velocity_and_the_accelerator_vectors_at_the_point_P(f(t),g(t))_02.png)
-
,g(t))_04.png/120px-Draw_the_velocity_and_the_accelerator_vectors_at_the_point_P(f(t),g(t))_04.png)
-
,g(t),h(t))_03.png/120px-Draw_the_velocity_and_the_accelerator_vectors_at_the_point_P(f(t),g(t),h(t))_03.png)
-
 Find PA, the length of the Normal from P to the x axis. 01.png 640 × 384; 17 KB
-
 Find PA, the length of the Normal from P to the x axis. 02.png 640 × 384; 23 KB
-
 Find PA, the length of the Normal from P to the x axis. 03.png 640 × 384; 20 KB
-
 Find PA, the length of the Normal from P to the x axis. 04.png 640 × 384; 17 KB
-
 Find PA, the length of the Normal from P to the x axis. 05.png 640 × 384; 23 KB
-
 Find PA, the length of the tangent from P to the x axis 01.png 640 × 384; 17 KB
-
 Find PA, the length of the tangent from P to the x axis 02.png 640 × 384; 23 KB
-
 Find PA, the length of the tangent from P to the x axis 03.png 640 × 384; 23 KB
-
 Find PA, the length of the tangent from P to the x axis 04.png 640 × 384; 19 KB
-
 Find PA, the length of the tangent from P to the x axis 05.png 640 × 384; 20 KB
-
 Find PB, the length of the Normal from P to the y axis. 01.png 640 × 384; 24 KB
-
 Find PB, the length of the Normal from P to the y axis. 02.png 640 × 384; 20 KB
-
 Find PB, the length of the Normal from P to the y axis. 03.png 640 × 384; 17 KB
-
 Find PB, the length of the Normal from P to the y axis. 04.png 640 × 384; 23 KB
-
 Find PB, the length of the tangent from P to the y axis 01.png 640 × 384; 18 KB
-
 Find PB, the length of the tangent from P to the y axis 02.png 640 × 384; 23 KB
-
 Find PB, the length of the tangent from P to the y axis 03.png 640 × 384; 23 KB
-
 Find PB, the length of the tangent from P to the y axis 04.png 640 × 384; 19 KB
-
 Find PB, the length of the tangent from P to the y axis 05.png 640 × 384; 20 KB
-
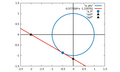
 Find the intersection points of the normal with the x-y axis 01.png 640 × 384; 23 KB
-
 Find the intersection points of the normal with the x-y axis 02.png 640 × 384; 25 KB
-
 Find the intersection points of the normal with the x-y axis 03.png 640 × 384; 22 KB
-
 Find the intersection points of the normal with the x-y axis 04.png 640 × 384; 19 KB
-
 Find the intersection points of the normal with the x-y axis 05.png 640 × 384; 26 KB
-
-

-

-

-

-
 Fourier serie for my wikibook.png 640 × 384; 23 KB
-
 Gnuplot window with gamma function.png 660 × 518; 8 KB
-
 Gnuplot-1.png 1,841 × 1,080; 74 KB
-
 Graph of 1 over x.png 642 × 475; 11 KB
-
 Heaviside function with gnuplot and C language.png 640 × 384; 8 KB
-
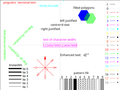
 Histograma barras de erros gnuplot.svg 640 × 480; 21 KB
-
 Histograma com barras de erros gnuplot.svg 640 × 480; 21 KB
-
 If a curve C has a smooth parametrization 01.png 640 × 384; 20 KB
-
 If a curve C has a smooth parametrization 02.png 640 × 384; 20 KB
-
_Formes_indéterminées_A00.png/120px-Limite_f(x,y)_Formes_indéterminées_A00.png) Limite f(x,y) Formes indéterminées A00.png 640 × 480; 119 KB
Limite f(x,y) Formes indéterminées A00.png 640 × 480; 119 KB
-
_Formes_indéterminées_A01.png/120px-Limite_f(x,y)_Formes_indéterminées_A01.png) Limite f(x,y) Formes indéterminées A01.png 640 × 480; 114 KB
Limite f(x,y) Formes indéterminées A01.png 640 × 480; 114 KB
-
_Formes_indéterminées_A02.png/120px-Limite_f(x,y)_Formes_indéterminées_A02.png) Limite f(x,y) Formes indéterminées A02.png 640 × 480; 119 KB
Limite f(x,y) Formes indéterminées A02.png 640 × 480; 119 KB
-
_Formes_indéterminées_A03.png/120px-Limite_f(x,y)_Formes_indéterminées_A03.png) Limite f(x,y) Formes indéterminées A03.png 640 × 480; 143 KB
Limite f(x,y) Formes indéterminées A03.png 640 × 480; 143 KB
-
 Mathc gnuplot-fr.pdf 1,239 × 1,754, 282 pages; 7 MB
-
 Newton'smethod 01.png 640 × 480; 28 KB
-
 Newton'smethod 02.png 640 × 480; 25 KB
-
 Newton'smethod 03.png 640 × 480; 22 KB
-
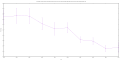 Nzchildpoverty2013-2022.svg 2,000 × 1,000; 15 KB
-
 OpenPsion5MX Octave.png 640 × 240; 38 KB
-
 Pngcairo test.png 640 × 480; 38 KB
-
 Scriptcarta smith.pdf 1,275 × 1,650, 3 pages; 36 KB
-
 Sektorediagrama 001.png 387 × 387; 9 KB
-
.png/120px-The_area_A_of_the_region_bounded_by_the_graphs_of_r_=_2*cos(t).png) The area A of the region bounded by the graphs of r = 2*cos(t).png 640 × 384; 49 KB
The area A of the region bounded by the graphs of r = 2*cos(t).png 640 × 384; 49 KB
-
.png/120px-The_area_A_of_the_region_bounded_by_the_graphs_of_r_=_2.+2.*cos(t).png)
-
.png/120px-The_area_A_of_the_region_bounded_by_the_graphs_of_r_=_exp(t).png) The area A of the region bounded by the graphs of r = exp(t).png 640 × 384; 41 KB
The area A of the region bounded by the graphs of r = exp(t).png 640 × 384; 41 KB
-
 The center of mass of the lamina 01.png 640 × 384; 15 KB
-
 The center of mass of the lamina 02.png 640 × 384; 18 KB
-
 The center of mass of the lamina 03.png 640 × 384; 16 KB
-
_and_r_=_g(t)_01.png/120px-Two_polar_equations_r_=_f(t)_and_r_=_g(t)_01.png) Two polar equations r = f(t) and r = g(t) 01.png 640 × 384; 50 KB
Two polar equations r = f(t) and r = g(t) 01.png 640 × 384; 50 KB
-
_and_r_=_g(t)_02.png/120px-Two_polar_equations_r_=_f(t)_and_r_=_g(t)_02.png) Two polar equations r = f(t) and r = g(t) 02.png 640 × 384; 57 KB
Two polar equations r = f(t) and r = g(t) 02.png 640 × 384; 57 KB