1
$\begingroup$

This is a screen shot from an animation generated by a matplotlib example

enter image description here

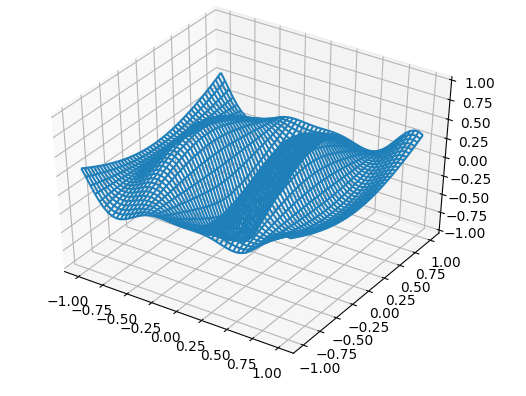
the key part in the code is

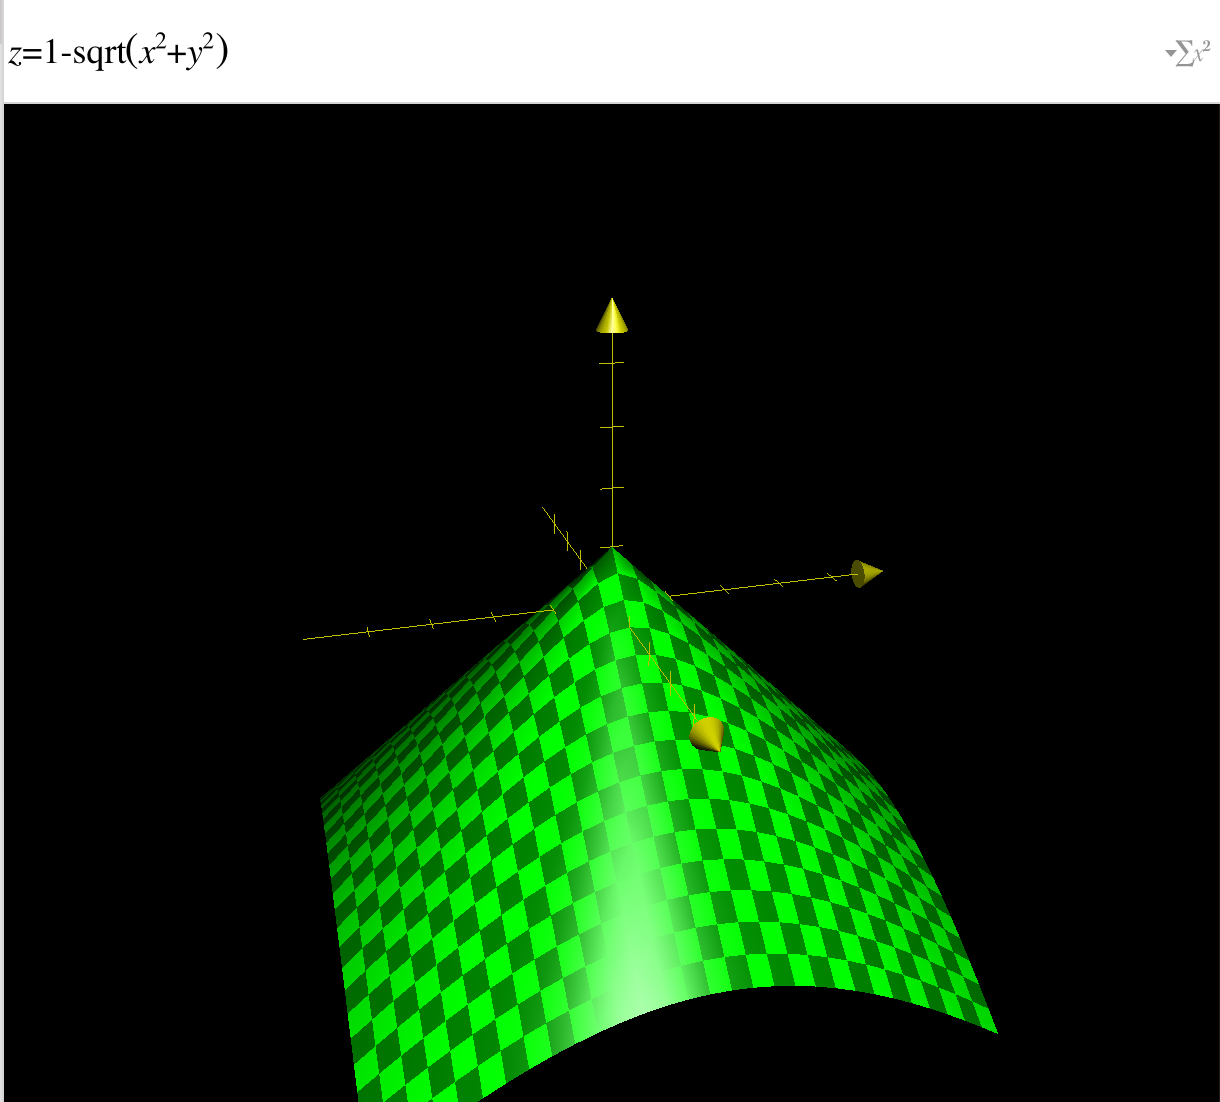
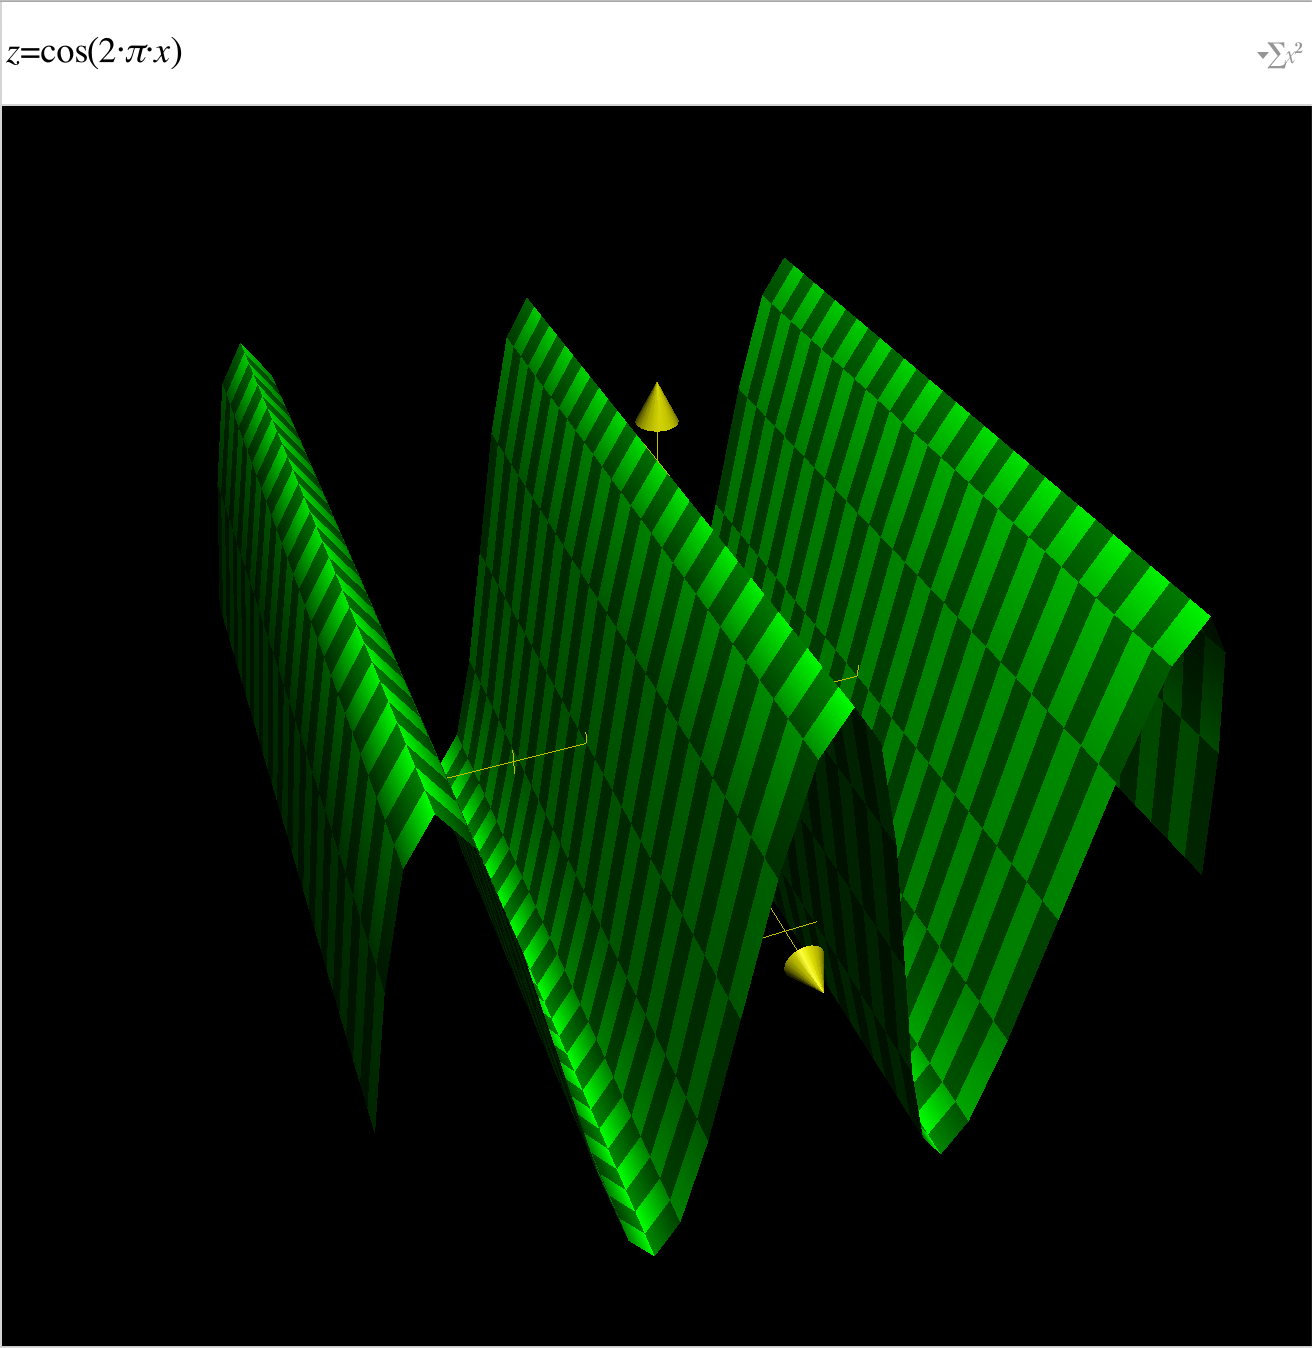
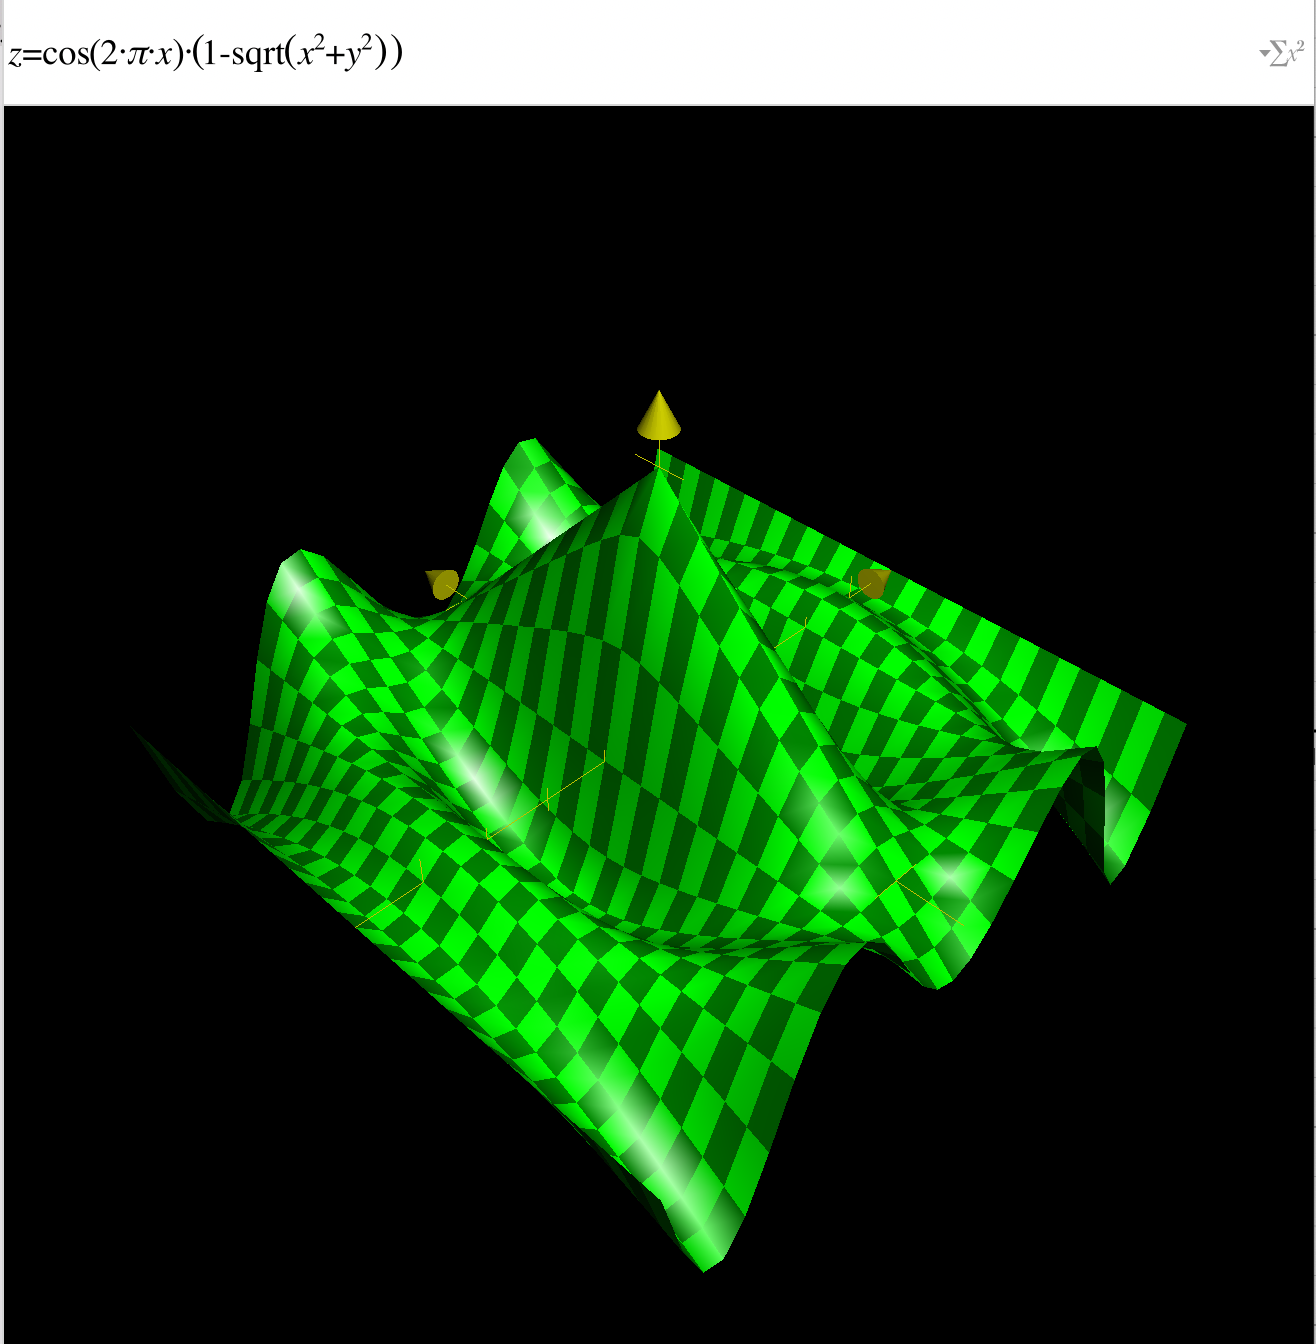
 R = 1 - np.sqrt(X**2 + Y**2) Z = np.cos(2 * np.pi * X + phi) * R 

corresponding equation is

$\left(- \sqrt{X^{2} + Y^{2}} + 1\right) \cos{\left (2 \pi X + \phi \right )}$

Could some give an explanation or hint about this kind of equation?

Is there a name of this type of graphics?

usually cosine/sine could generate something like a (half) circle, what does R part do?

$\endgroup$

1 Answer 1

6
$\begingroup$

The R part generates a cone where the point is at (0, 0, 1) and it spreads out below that. It meets the x-y plane at the unit circle:

A cone with the point at (0, 0, 1) and spreading out downward

The cos component defines an extruded cosine wave along the X-axis:

The graph of cos(2*π*x)

So the final equation takes the cosine wave and multiplies its amplitude by the cone. It will have full amplitude at the origin, and decrease to 0 at the unit circle on the x-y plane. Past that it becomes negative:

Multiplying the second equation by the first

The phi component shifts the sine wave forward or backward along the x axis.

$\endgroup$

Start asking to get answers

Find the answer to your question by asking.

Ask question

Explore related questions

See similar questions with these tags.