Deployment or Cluster view in AutoOps
ECH ECK ECE Self-Managed
The Deployment view (for Elastic Cloud Hosted deployments) or Cluster view (for ECE, ECK, and self-managed clusters), is the event control panel that gives you an overview of the events, resource usage, and performance of your deployments or clusters.
To get to this view, go to AutoOps in your deployment or cluster and select Deployment or Cluster from the side navigation.
You can use the Deployment or Cluster dropdown at the top of the screen to select which deployment or cluster you want to monitor.
The Deployment or Cluster view shows the following panels.
The Events Over Time panel lists all the recent events the Elasticsearch cluster has triggered, ordered by criticality. It also displays a color-coded heat map to help understand when and how often a particular event happened. Click on any mosaic to get details about a particular event, such as the specific node, index, or shard affected, event time and duration, and a detailed description of the actions you can take to mitigate that event.
Refer to AutoOps events for more details.
The Open Events panel lists open events sorted by severity and time. When the conditions that triggered the event no longer exist, the event is automatically set to close and appear in the Events History panel. Closing an event does not necessarily indicate that the customer resolved the issue, but rather that AutoOps no longer detects it.
The Events History panel lists events that were triggered in the past but are no longer active because of changed conditions.
Let's say your cluster experienced a peak in search rate, triggering a "Too many tasks on queue" event. Now, your cluster is more relaxed in terms of search rate, so this event is no longer an issue, but it was recorded for historical reasons. Like Open Events, Events History is also sorted first by severity and then by time.
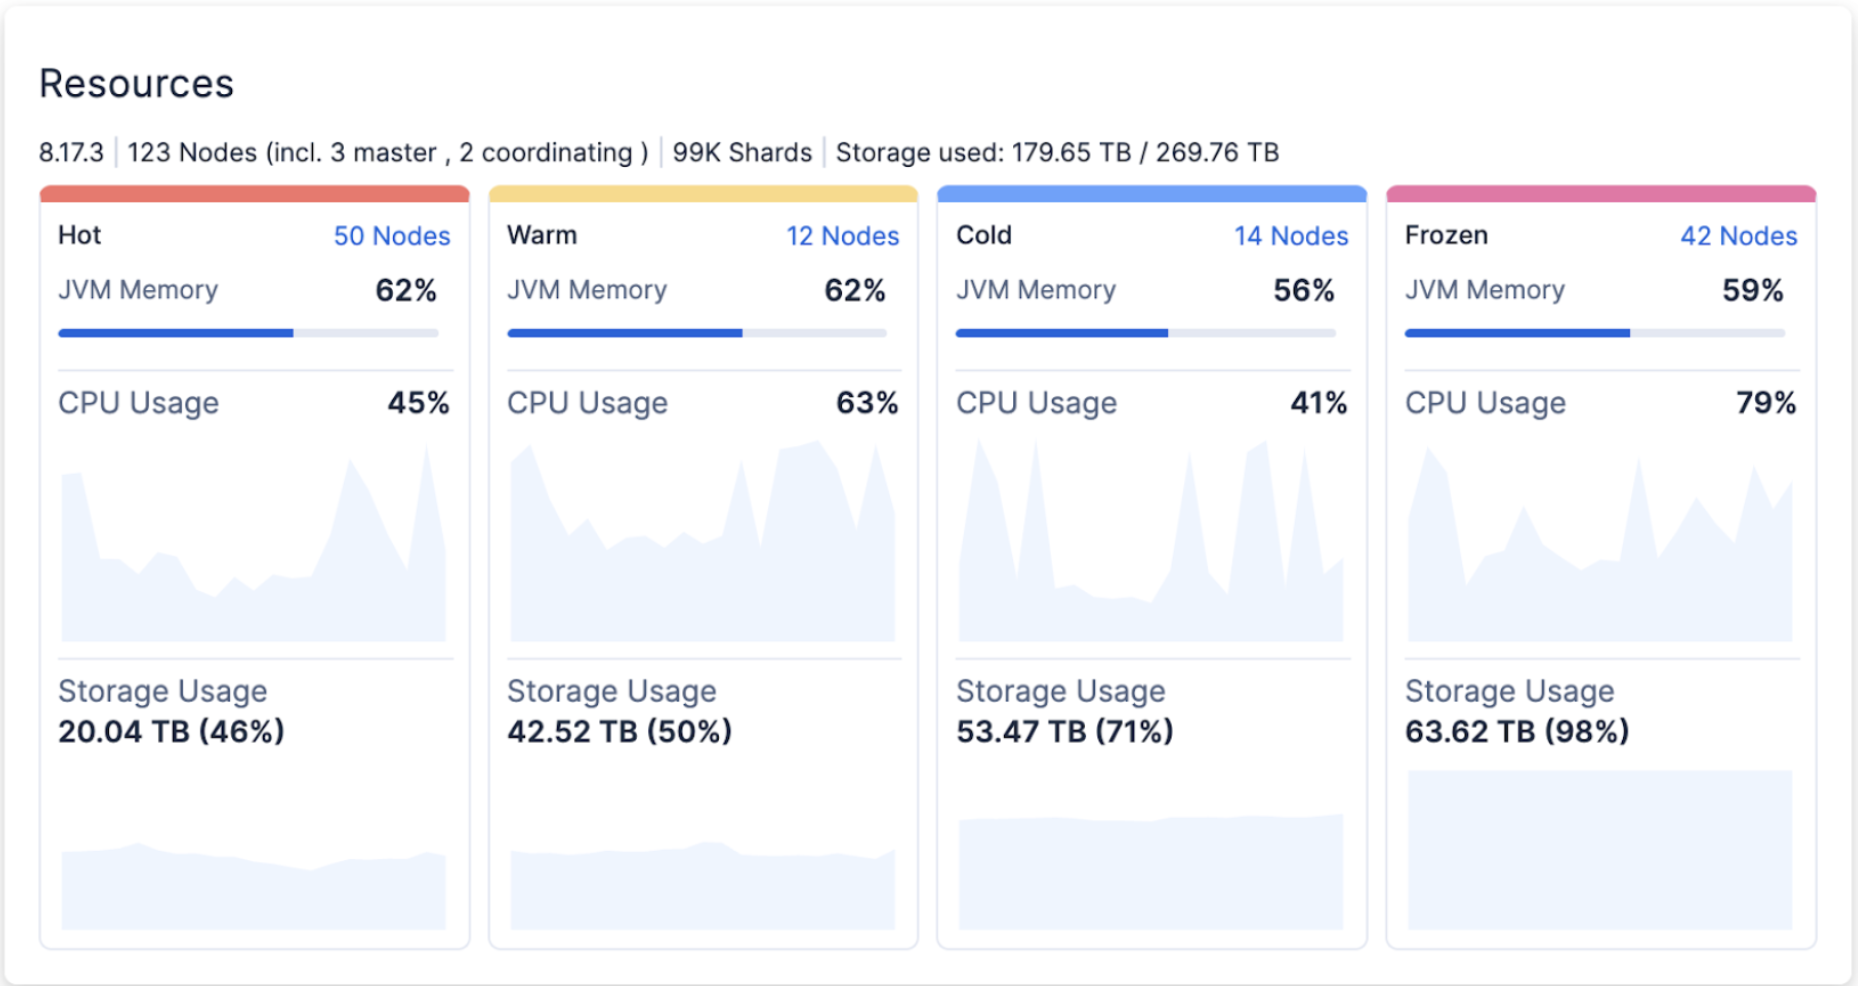
The Resources panel provides a quick overview of Elasticsearch cluster resource usage. The resources are presented based on their respective data tiers and include JVM memory usage, CPU usage, and storage usage over time. You can view essential cluster information such as the Elasticsearch version, total number of nodes, total number of shards, and total volume of used storage.

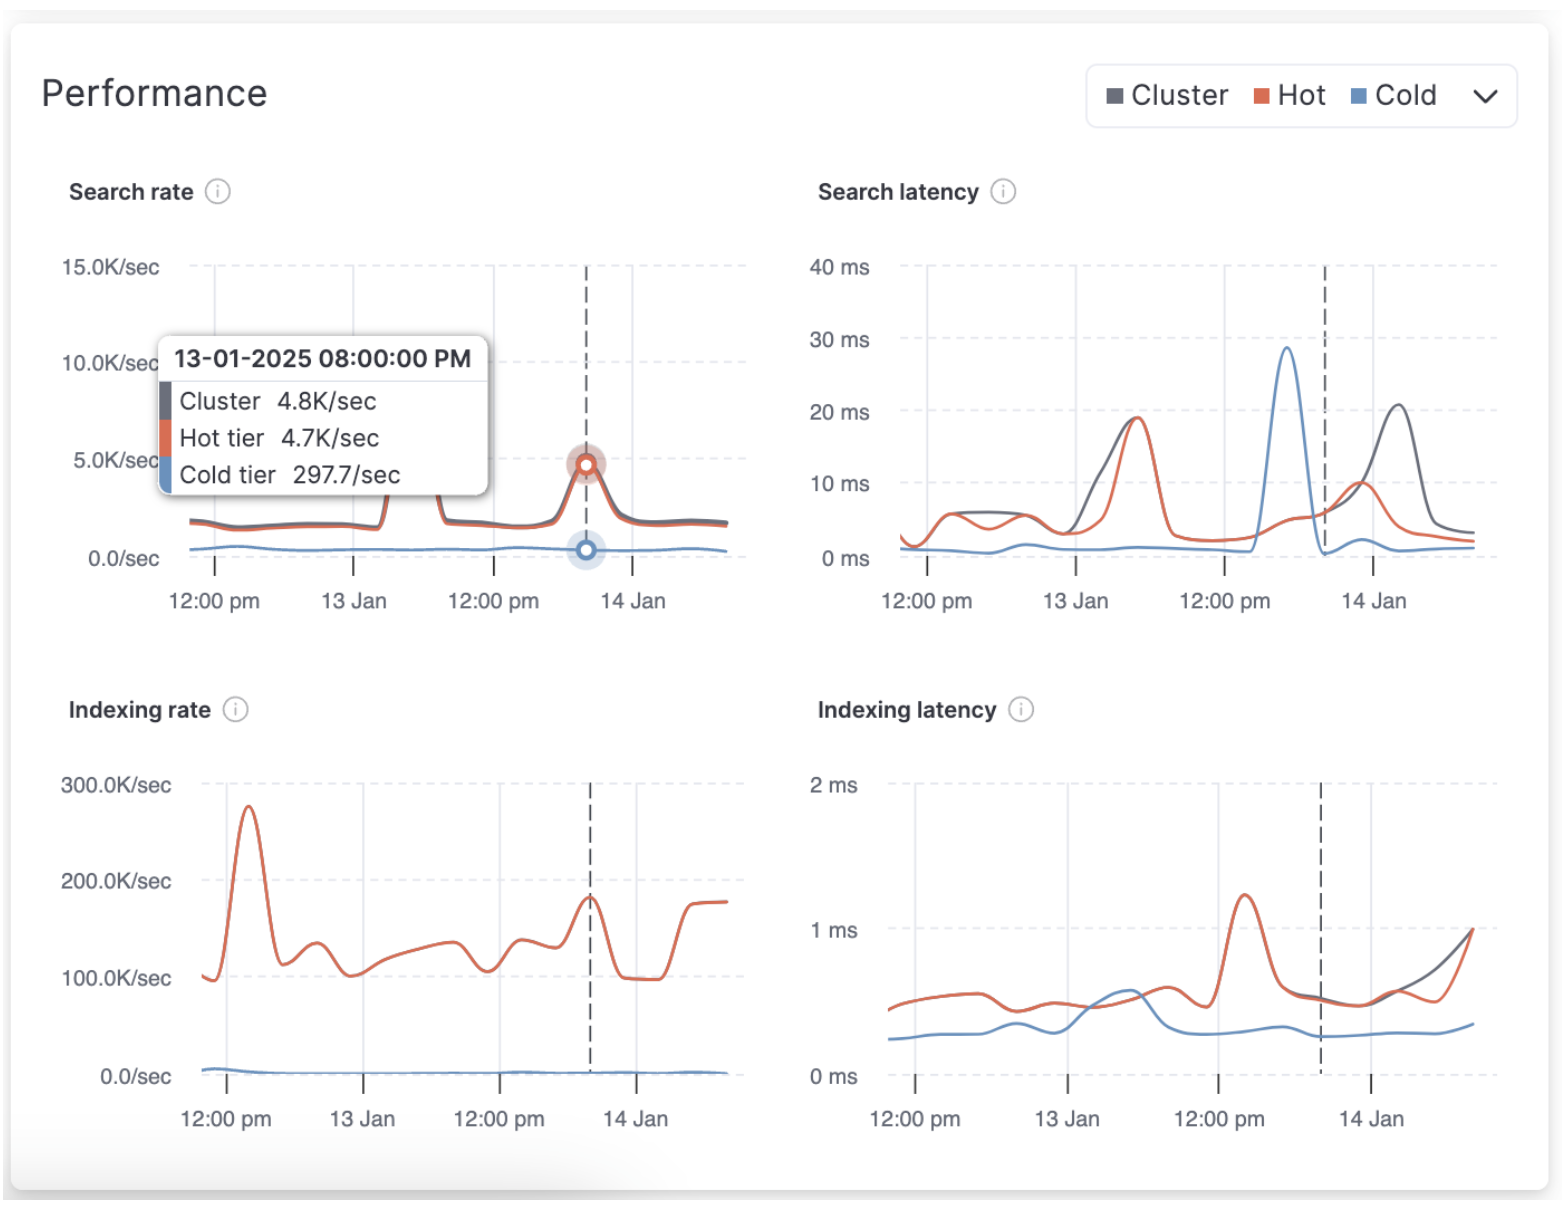
The Performance panel shows the following key performance metrics aggregated at both the cluster level and the selected tier levels:
- Search rate: The number of search requests executed per second across all shards in the deployment or cluster, as well as within the selected data tiers.
- Search latency: The average latency of search operations across all shards in the deployment or cluster, and within the selected data tiers.
- Indexing rate: The number of documents indexed per second across all shards in the deployment or cluster, as well as within the selected data tiers.
- Indexing latency: The average latency of indexing operations across all shards in the deployment or cluster, and within the selected data tiers.
