

Abstract
The Wallacea biogeographic region of Sulawesi, the Moluccas and Lesser Sunda is globally renowned for exceptional endemism, but is currently emerging as a development frontier in Indonesia. We assessed patterns and drivers of forest loss and fragmentation across the region, and used dynamic deforestation models to project future deforestation to 2053. Up to 10 231 km2 was deforested between 2000 and 2018, and a further 49 570 km2 is expected to be lost by 2053, with annual deforestation rates ranging between 0.09% and 2.17% in different sub-regions (average: 1.23%). Key biodiversity areas (priority sites for endemic and threatened biodiversity) are particularly vulnerable to deforestation if they are small, coastal and unprotected. Sub-regional variation in deforestation patterns and drivers must be acknowledged if conservation interventions are to be targeted and effective. We provide a valuable baseline from which to monitor Wallacea’s new development course, as Indonesia undergoes profound policy changes that will provide both challenges and opportunities for environmental governance and conservation.

Original content from this work may be used under the terms of the Creative Commons Attribution 4.0 license. Any further distribution of this work must maintain attribution to the author(s) and the title of the work, journal citation and DOI.
1. Introduction
Deforestation drives biodiversity declines in tropical countries (Alroy 2017), with acute impacts in regions of high endemism (Brooks et al 2002, Barlow et al 2018). Indonesia, as one of the world’s most diverse archipelagos, has experienced some of the highest deforestation rates in the world; more than 60 000 km2 deforested between 2000 and 2012 (Margono et al 2014). Previous analyses of forest data across the country revealed substantial regional variation in deforestation rates and drivers (Austin et al 2019). The highest rates of deforestation occurred on Sumatra and Borneo, mainly as a consequence of the expansion of industrial oil palm and timber plantations (Curtis et al 2018). Together with infrastructural development, these sectors more recently appear to be having a similar role in deforestation in Papua, Eastern Indonesia (e.g. Gaveau et al 2021), but far less attention has been paid to central Indonesia and the Wallacea biodiversity hotspot (Burung Indonesia 2014, Supriatna et al 2020).
Despite comprising one-fifth of Indonesia’s land surface, Wallacea, including the islands of Sulawesi, Maluku (the Molluccas) and Nusa Tenggara (Lesser Sundas), supports more than half the country’s species listed as threatened on the IUCN Red List (CEPF 2014, Supriatna et al 2020). The archipelago’s rich biogeographic history resulted in levels of endemism that are among the highest worldwide, making the region a global priority for conservation (Brooks et al 2006), ecosystem service provision (Turner et al 2012) and restoration (Strassburg et al 2020). The main threats to the region’s biodiversity are reported to be similar to other parts of Indonesia—primarily deforestation and forest degradation driven by agriculture, mining, and infrastructure development (CEPF 2014). However, unlike the islands of western Indonesia, crop production in Wallacea is currently dominated by smallholders producing coconut and cocoa (Sulawesi), cashew and coffee (Nusa Tenggara) and nutmeg (Maluku) (Directorate General of Estate Crops Indonesia 2019). It is therefore likely that the patterns and drivers of deforestation are somewhat different to those experienced in other more heavily studied regions. As land-use trajectories are little studied in Wallacea, predicting future environmental change remains challenging (Kelley et al 2017), making it difficult to comprehend the future impacts on biodiversity. This is especially concerning given that the archipelago is emerging as a new development frontier to support Indonesia’s extractive industries, food and fuel security, and infrastructure, with the potential to considerably increase existing threats (Sutherland et al 2019, Supriatna et al 2020).
Here we examine the patterns and drivers of deforestation in Wallacea, revealing the emerging pressures threatening the region’s key biodiversity areas (KBAs; globally recognised sites that support threatened or irreplaceable species) (IUCN 2016). We use this information to parameterise deforestation models and predict the extent of future deforestation to understand how this could exacerbate threats to KBAs. We apply a spatially-explicit and dynamic deforestation modelling approach that internalises estimating both rate and location of land-cover change based on historical dynamics and a randomised process.
Further to deforestation, we also assess the effects of fragmentation, leading to pervasive impacts on forests and biodiversity globally (Haddad et al 2015), by capturing past and projected fragmentation rates and estimating the vulnerability of the KBA network to both.
As KBAs typically extend beyond protected areas, and are based on population viability requirements for range-restricted and threatened species, our assessment highlights where to target limited conservation resources to protect vulnerable areas that have the greatest value for endemic taxa. In the context of land-use planning, deforestation risk information could also be useful to ensure development targets are met.
2. Methods
2.1. Study system
Wallacea encompasses approximately 1680 islands (Lohman et al 2011), covering 338 000 km2 (figure 1). Across this diverse region there are 227 terrestrial KBAs (BirdLife International 2020). To capture potential geographic variation in land-cover change patterns and drivers, we divided Wallacea into nine sub-regions following historical provincial boundaries and island groups: Gorontalo and North Sulawesi; Central Sulawesi; West and South Sulawesi; Southeast Sulawesi; North Maluku; Central Maluku; South Maluku; West Nusa Tenggara; and East Nusa Tenggara (figure 1, supporting information S1 (available online at stacks.iop.org/ERL/16/094048/mmedia)).
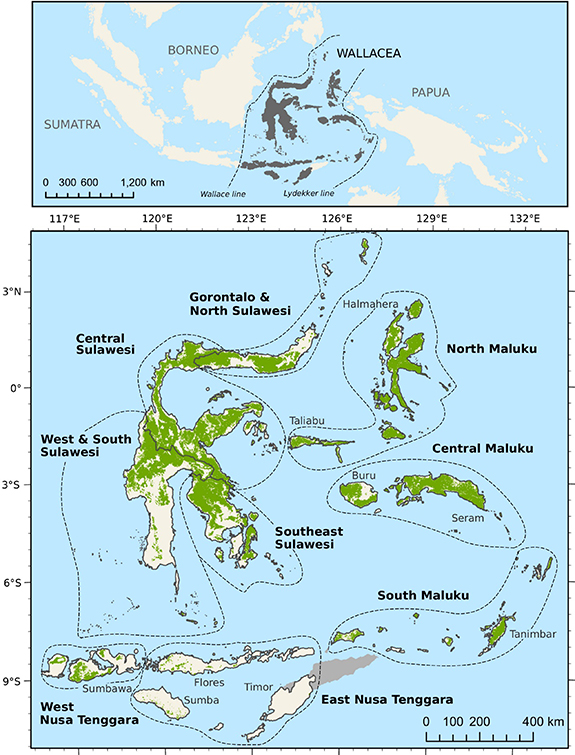
Figure 1. The Wallacea region in Southeast Asia (top panel) and forest cover for the nine sub-regions (bottom panel) subject to deforestation projections. The dashed lines in the top panel represent the biogeographic boundaries of Wallacea. Forest cover in the bottom panel (light green) is extracted for the year 2000 from Hansen et al (2013), Margono et al (2014) and Giri et al (2011).
Download figure:
Standard image High-resolution imageForest was defined according to Margono et al (2014) as stands >5 ha with a natural composition and structure that had not been cleared in recent history (before the year 2000) and having >70% tree canopy cover at the Landsat pixel (30 m resolution) scale (supporting information S2). This definition corresponds with primary and secondary forest categories used by the Indonesian Ministry of Forestry in the year 2018). Mangrove forests were added using maps from Giri et al (2011). We acquired annual forest loss data between 2001 and 2018 from the Global Forest Change repository (v1.6; Hansen et al 2013), and applied it to forest cover data from 2000 (data available from Voigt et al 2021).
The Global Forest Change dataset includes both forest loss from permanent conversion, as well as temporary forest loss from different natural and anthropogenic sources. We sought to minimise the inclusion of temporary loss events by choosing a conservative definition of forest, which excluded tree cover loss within plantations, agro-forests, mixed gardens, regrowth or scrubland. Since most wildfires in Indonesia are associated with anthropogenic causes and lead to forest loss in highly degraded rather than primary areas, we are confident that most of the mapped changes in forest we refer to are anthropogenic and permanent, rather than temporary. We therefore use the terms deforestation and forest loss interchangeably.
We selected potential deforestation predictors based on those known to be important in the tropics and, more specifically, Indonesia (table 1; supporting information S2, Austin et al 2019). All layers were converted to the Asia South Albers Equal Area Conic projection and resampled to the same extent and origin at 180 × 180 m pixel size (bilinear for continuous predictors, and nearest-neighbour resampling for categorical predictors) to facilitate computational processes. All spatial manipulations were performed in Python (Python Software Foundation 2019), and data aggregated, analysed and visualised in Python, R (R Core Team 2020) and ArcGIS Pro (Esri 2020).
Table 1. Predictors used in deforestation modelling, including their description, source and year (supporting information S2).
| Name | Description | Source | Year |
|---|---|---|---|
| Forest cover and loss | Forest cover and loss previous to the calibration period (2001–2013) and in the calibration period (2014–2018) | Giri et al (2011), Hansen et al (2013), Margono et al (2014) | 2000, 2001–2013, 2014–2018 |
| Slope | Slope in 2000 derived from the digital elevation model (30 m) | Farr et al (2007) | 2000 |
| Fire activity | The average number of active fires per year (Moderate Resolution Imaging Spectroradiometer (MODIS) and the Visible Infrared Imaging Radiometer Suite (VIIRS)) as a proxy for fire proneness and agricultural activity. | MODIS Collection 6 NRT (2018), VIIRS 375m NRT (2018) | 2000–2018, 2012–2018 |
| Accessibility | Accessibility from settlements, considering roads, slope and landcover (Weiss et al 2018, Deere et al 2020) | Populated places (World Resources Insitute (WRI)), Landcover (Ministry of Environment and Forestry, Republic Indonesia 2013), Roads (WRI), Slope (Farr et al 2007) | 1990–2011 |
| Human population pressure | Local population pressure (Σ = 1) | This publication, Rose et al (2018) | 1990–2017 |
| Main commodity | Distance to an Indonesian village (Desa) (includes human settlements and surrounding land mapped by the Indonesian Bureau of Statistics) which derives income from staple food agricultural, plantation agriculture, non-agricultural or fisheries commodities | Indonesian Bureau of Statistics (2018) | 2014 |
| Transmigrant settlements | Distance to settlements with an ethnic majority from outside of Wallacea | Indonesian Bureau of Statistics (2011), Indonesian Ministry of Environment and Forestry (2013) | 2011 |
| Mining | Exploration and production mining concessions (absence of mining concessions as reference) | WRI | 2017 |
| Land-use | Non-forest areas (APL), production forests (HP, HPK), and limited production forests (HPT). Protected forests (CA, HSAW, KSPA, SM, TN, TAHURA, TNL, TWA, TWA/HW, TWAL, TB) as reference areas | Ministry of Forestry (2010) | 2010 |
2.2. Future deforestation projections
We adapted a dynamic and spatially-explicit modelling framework developed by Rosa et al (2013) to project future deforestation in each of the nine sub-regions (supporting information S3). The model is a data-driven probabilistic model that uses past deforestation, a spatial autocorrelation effect of the neighbourhood of deforested pixels and predictors of deforestation as inputs to capture three important aspects of deforestation: uncertainty, emergence, and contagion. In contrast to other models (e.g. Soares-Filho et al 2002, Verburg et al 2002) it internalises estimating both rate and location of forest loss based on historical dynamics and randomised processes (Rosa et al 2013). The model has been applied in different contexts for Latin America (e.g. Ochoa-Quintero et al 2015, Bradley et al 2017, Guerra et al 2020), but less so in other tropical regions.
The model dynamically updates past deforestation for each projection step based on the outcome of the previous step. Remaining predictors are static either because they are unlikely to change within the calibration or projection timeframe (e.g. slope), change slightly but unpredictably over long time-scales (e.g. accessibility, human pressure, the presence of transmigrant settlements) or are poorly documented or difficult to reliably predict (e.g. main commodity produced in villages, land-use allocation). An exception is fire, which although included as a static predictor, integrates 18 years of past fire alerts and thus reflects the spatial footprint of proneness to fire and high levels of agricultural activities involving burning. It represents likely future fire dynamics, as previously burnt areas are more susceptible to burning in the future (Hoscilo et al 2011).
We used a forward step-wise regression to fit models that describe forest loss as a function of predictors for each region by successively adding all potential non-correlated predictors (Pearson’s correlation coefficient <0.7). The models were fitted using ‘Filzbach’, a freely available library (https://github.com/predictionmachines/Filzbach), which uses a Markov chain Monte Carlo (MCMC) sampling method. Starting with all models with a single predictor, we selected and retained the predictors with the most predictive power employing a cross-validation technique (Rosa et al 2013). For the cross-validation, we trained the models with a random subset of 50% pixels, and then calculated a goodness of fit likelihood between the model projection and the observations with the other 50% pixels. The predictor yielding the model with the highest likelihood was kept and the remaining predictors added individually until all were tested. Out of the complete set of models, ranging between 56 and 79 for each sub-region depending on the total number of predictors, we then used the best performing model (table S2) for each sub-region to estimate the probability of deforestation for the 5 year calibration period (2014–2018) and subsequent 5 year periods up until 2053.
This estimation of the probability of deforestation was done using a slightly different set of predictor values at each iteration, thereby incorporating parameter uncertainty. These predictor values were drawn from a Gaussian distribution resulting from the MCMC fitting, and the estimated mean and standard deviation for each. The updated probability of loss per pixel was then converted into loss or no loss by drawing a random number from a uniform distribution between 0 and 1. We then classified the pixel as lost if the number was less than the probability of deforestation. This procedure was run multiple times (n = 100 iterations) to assess the uncertainty in model projections over time. The binary maps of forest loss and resulting forest cover were used to validate the projections, to calculate deforestation and estimate fragmentation across the study region and for each KBA.
We validated the projected forest by calculating the perfect match, commission and omission errors for the calibration period (2014–2018). We also validated the match of the projected deforestation (i.e. the modelled change) of a pixel, within a 1, 2 and 10 pixel neighbourhood, against observed deforestation data following Rosa et al (2013, 2014).
The probability of deforestation, including model uncertainty, was visualised by aggregating the binary map iterations into the summed probability of deforestation (i.e. if a pixel was deemed to be deforested in 50 of 100 iterations, it was assigned a summed deforestation probability of 50%).
2.3. Forest fragmentation
We quantified past and future forest fragmentation in each sub-region for the years 2000, 2018, 2033 and 2053. We estimated the size and number of fragments, and the percentage forest within fragments that were ⩽2 km2 (the minimum size reported to be ecologically viable based on datasets from neighbouring Borneo; Lucey et al 2017) by converting observed or binary projected forest loss maps into individual polygons, and calculating the area of each using Python Geospatial Data Abstraction Library (GDAL) and OGR Simple Features Library (2020). We then quantified the change in fragmentation between the different years, compared to the baseline in 2000.
2.4. Deforestation and fragmentation in key biodiversity areas
We intersected the KBA and forest layers to quantify forest loss and fragmentation in each KBA in 2018, 2033 and 2053, relative to the 2000 baseline. We considered the 227 non-nested terrestrial KBAs delineated by Burung Indonesia (BirdLife International 2020), each having an area between 0.6 and 4 644 km2. Within the sub-regions, the KBA network covers between 18% (West and South Sulawesi) and 39% (South Maluku) of the terrestrial area. We used official land-use maps (Ministry of Forestry 2010) to identify the overlap of KBAs with protected forests. Out of the 227 KBAs, 102 had most of their area protected (⩾50% protection; 14 of which were fully protected), 84 mostly unprotected (<50% protection) and 41 entirely unprotected.
The vulnerability of KBAs to future land-cover changes was assessed by ranking them according to the percentage of projected forest loss (median across the 100 model iterations) within their boundaries, and the percentage of forest in small fragments, by 2053. Only KBAs that were in the top 20% for both measures in all iterations (200 out of 200) were considered and the rank order was defined by the percentage forest loss as all highly ranked KBAs had 100% forest in fragments ⩽2 km2. Since KBAs were developed as a network of sites that support endemic or highly threatened species, losing a large proportion of habitat in smaller KBAs has a disproportionately adverse impact on endemic species than in larger ones. However, we also ranked KBAs by the total area lost or fragmented as an alternative prioritisation of threat.
3. Results
3.1. Model accuracy and predictors of deforestation
The model achieved high spatial agreement between observed and projected forest maps: a median of 97% of pixels were perfectly matched between projections and the calibration data (2014–2018) across Wallacea, and accuracy ranged between 96% and 99% for the nine sub-regions (table S3). The overall prevalence of false positives (commission errors) was 2% (<0.01%–4% for sub-regions), and the prevalence of false negatives (omission errors) was 3% (1%–4% for sub-regions) (table S3). Assessing the match of observed deforestation versus modelled deforestation as suggested by Rosa et al (2014) across the calibration period, we found a median of 50% of the observed deforestation events were in the immediate neighbourhood (within 180 m) of projected forest loss, 73% within 360 m and 99% within 1800 m (figure S1).
Among the predictors considered in the deforestation models, high average fire incidence over time (a proxy for fire proneness and agricultural activity involving burning; median coefficient: 10.90) and proximity to deforestation prior to the calibration period (4.84) contributed the largest increase in deforestation probability overall across sub-regions (figure 2; table S2).
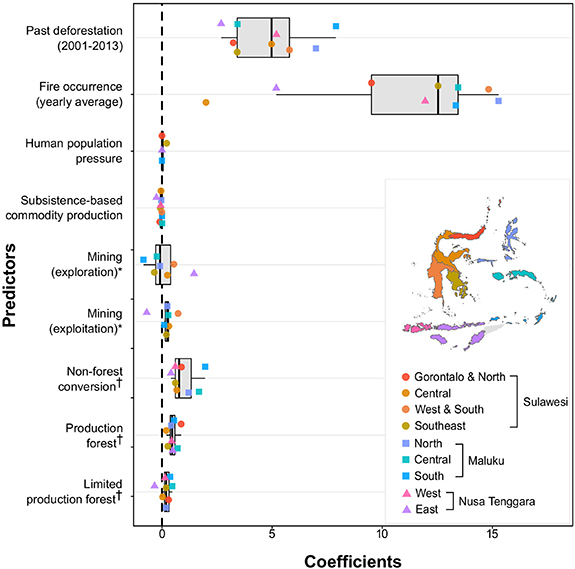
Figure 2. Influence of predictors on deforestation between 2000 and 2018 in modelling sub-regions of Wallacea. Predictor coefficients are summarised across sub-regions (boxplot showing median and 25th and 75th quartiles). Coefficient values <0 (dashed line) decreased, while values >0 increased the probability of deforestation. The effect of mining concessions (exploration and exploitation) is relative to the effect of not having a mining concession (*). The effect of non-forest, production forest and limited production forest is relative to the effect of protected forests (†) (supporting information S2). Combinations of predictors were tested for each sub-region, and the combination resulting in the highest likelihood selected as the best model. The predictors for each sub-regional model could therefore differ (table S2). Predictors for which all sub-regional coefficients were close to zero (mean coefficient smaller than 0.05 and a spread smaller than 0.1) were excluded from the figure (accessibility, plantation, non-agricultural and fisheries commodity production, transmigrant settlements). The 95% confidence intervals derived from the 100 model iterations around points are not shown, as they fall within the points.
Download figure:
Standard image High-resolution imagePredictors relating to resource extraction (mining, forestry) and conversion of forest also intensified deforestation in most sub-regions.
3.2. Deforestation in the past and future
In the year 2000, forest cover in the sub-regions varied from just 4% (East Nusa Tenggara) to 72% (North Maluku) (figures 3 and 4; table S4). By 2018, overall forest cover had decreased to 93% of that present in 2000 over all, at an annual deforestation rate of 0.39%. Forest cover is then projected to decline to 60% by 2053, at an annual rate of 1.23%, equating to a loss of 49 570 km2 across Wallacea. Compared to 2000, the forest expected to remain in 2053 varies by sub-region, from 95% in East Nusa Tenggara to 44% in North Maluku (annual rates of future loss 0.1% and 2.17% respectively) (table S4).
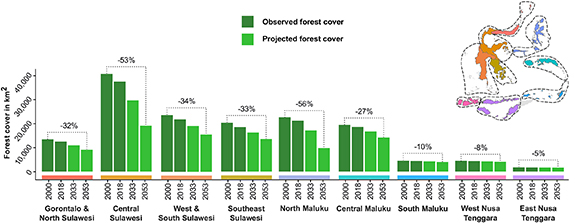
Figure 3. Forest cover change and percentage loss for sub-regions in Wallacea. Forest cover observed in 2000 and 2018 (dark green) and median area projected for 5 year periods 2029–2033 and 2049–2053 (light green). Percentage loss between the forest cover in 2000 and 2053 is shown above bars. Sub-regions in Wallacea and respective colour codes in inlay map and underneath bars.
Download figure:
Standard image High-resolution image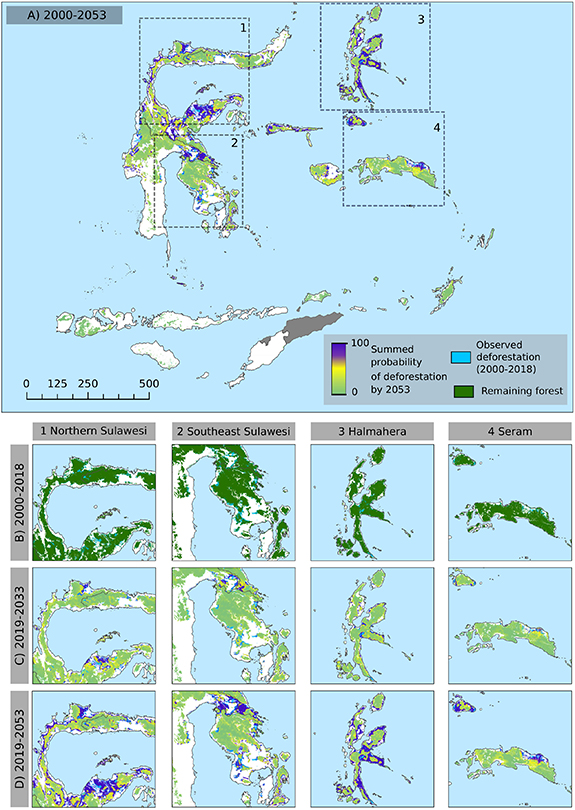
Figure 4. Observed and projected deforestation across Wallacea (A) and focal areas (1, Northern Sulawesi; 2, Southeast Sulawesi; 3, Halmahera; 4, Seram) over time (B)–(D). Probability of deforestation in panel (A), (C) and (D) (green, low; yellow, medium; purple, high) is summed over 100 binary forest loss projections and accumulated from 2019 to 2033 (C), and 2019–2053 (A) and (D). Observed deforestation (light blue) from 2000 to 2018 and remaining forest cover (dark green) in focal areas (B). Data available from Voigt et al (2021)
Download figure:
Standard image High-resolution image3.3. Forest fragmentation
Across Wallacea, there were 34% more fragments in 2018 compared to the baseline in 2000, which grew to 253% (3.5-fold) by 2053. The highest increase in number of fragments is projected for North Maluku, rising by 786% (nine-fold) in 2053. The percentage of forest in fragments across Wallacea rose 35% between 2000 and 2018, and up to 484% (5.8-fold) by 2053 (table S5). The sub-region with the greatest levels of fragmentation is North Sulawesi and Gorontalo with 1030% (11 times) more of its forest as fragments in 2053 compared to 2000.
3.4. Vulnerability of Wallacea’s KBAs
Forest cover in Wallacea’s KBAs declined by 2% between 2000 and 2018, and this trend was set to continue: 12% loss by 2033 and 26% by 2053. Over time, KBAs in Central Sulawesi are projected to experience the greatest deforestation of any sub-region: 39% loss between 2000 and 2053 (table S6). Meanwhile, the deforestation expected for individual KBAs ranges from 2% to 52% in East Nusa Tenggara and Central Sulawesi respectively. KBAs across both East and West Nusa Tenggara as well as South Maluku are expected to experience negligible future fragmentation. However, those in North Maluku will become highly fragmented, with a 2200% (23-fold) increase in the number of fragments and a 3420% (35-fold) rise in the percentage of forest fragmented between 2000 and 2053.
In total, 21 KBAs comprise the top 20% most adversely affected by percentage deforestation and forest fragmentation (across all iterations). All of these are projected to lose at least 74% forest cover by 2053, and all remaining forest will be found in fragments ⩽2 km2 in size. The most vulnerable KBAs according to percentage loss criteria are typically small (median 57 km2 compared to 114 km2 for all KBAs) and located in coastal regions or small islands, with 19 of the 21 found in the provinces of Sulawesi or Central and North Maluku (figure 5; table S7). When considering an area-criterion for ranking vulnerable KBAs, 41 were in the top 20% most affected by forest loss and fragmentation, with at least 54 km2 reduction in forest cover and 13 km2 of forest in small fragments. These KBAs are typically large (median 940 km2) (figure S2, table S8).
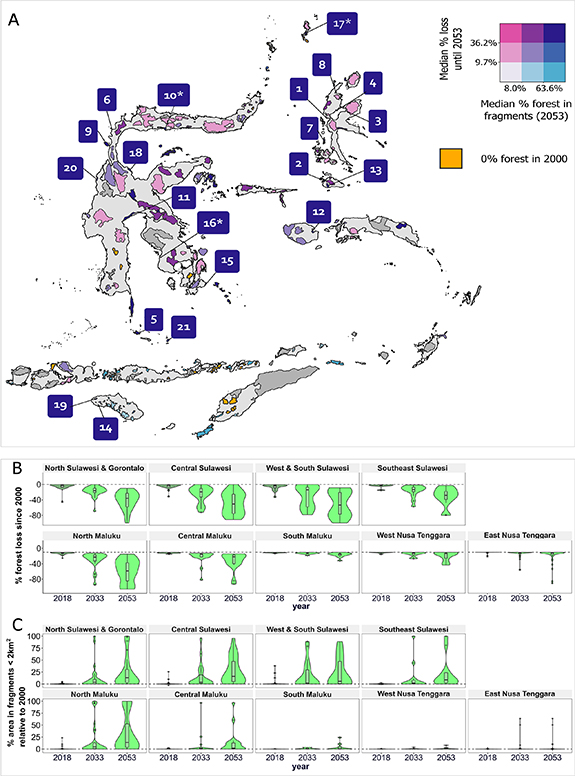
Figure 5. Vulnerability of key biodiversity areas (KBAs) to percentage forest loss and fragmentation. (A) Map of KBAs with bivariate colour coding of the percentage forest in KBAs in 2053 compared to 2000 (blues) and the percentage forest in fragments (⩽2 km2; purples). KBAs that were ranked in highest 20% for both percentage forest loss and fragmentation are labelled with their ranks (table S7). Label colour corresponds to bivariate colour code. An asterisk marks KBAs in which the majority of their forest area are protected, KBAs without asterisk are mostly unprotected. (B) Percentage forest loss since 2000 and (C) percentage area in fragments relative to 2000 for the sub-regions and years 2018, 2033 and 2053. Violin plots width in (B) and (C) were scaled to 1. Boxplots show median and 25th and 75th quartiles.
Download figure:
Standard image High-resolution image4. Discussion
The Wallacea archipelago comprises 20% of Indonesia, with exceptionally high levels of endemism. Development has been relatively slow compared to that on the western islands of Sumatra, Java and Kalimantan (Tolo 2019), which dominate the environmental literature (e.g. Supriatna et al 2017, Gaveau et al 2018). However, in a bid to become a major global economy by 2025, Indonesia is promoting policies and foreign investment opportunities for agriculture, resource extraction and infrastructure, with a focus on previously underdeveloped regions such as Wallacea (CEPF 2014, Song et al 2018, Tolo 2019). While past development has resulted in 10 231 km2 of deforestation in Wallacea between 2000 and 2018, our analysis suggests that an additional 49 570 km2 of forest could be lost by 2053 under current trajectories. The resulting annual deforestation rate of 1.23% would be higher than the global average for tropical forests (0.49%) in the 1990s and 2000s, as well as exceeding those experienced in the last 20 years on neighbouring Borneo (Gaveau et al 2013, Achard et al 2014).
Increasing deforestation in Wallacea is accompanied by increased forest fragmentation, in line with worldwide trends. Fragmentation of forest ecosystems has pervasive impacts on biodiversity, degrading key ecological processes and altering nutrient cycles (Haddad et al 2015). Smaller, more isolated habitat fragments support fewer species, often resulting in a disproportionate loss of species of high conservation concern such as endemics and threatened taxa (Crooks et al 2017). Fragmentation also intensifies edge effects whereby habitat and biodiversity become more susceptible to further deterioration due to biophysical changes near habitat edges (Pfeifer et al 2017). Therefore, fragmentation not only increases the potential for further habitat degradation in Wallacean islands, but could also exacerbate the biodiversity losses already experienced through deforestation. The effects are likely to take some time to accrue, and may be more adversely experienced by endemic taxa.
4.1. Variation in sub-regional patterns and drivers of deforestation
Archipelago-wide patterns of deforestation, degradation and drivers can mask important regional variation. For example, the islands of Nusa Tenggara had the least forest cover in 2000 and, consequently, will experience low rates of deforestation (<0.16% by 2053). In comparison, North Maluku is projected to lose 56% forest cover by 2053 and Central Sulawesi is projected to lose the greatest primary forest extent in the archipelago (21 596 km2). The smallest and least protected KBAs in these two regions tend to be most vulnerable to loss and degradation of large proportions of their forest, highlighting the need for localised conservation interventions.
Mining and industrial agriculture were key drivers of deforestation in Wallacea, as elsewhere in Indonesia (Austin et al 2019, Gaveau et al 2021) and worldwide (Curtis et al 2018). These drivers are associated with above average economic growth in Sulawesi and North Maluku provinces (Tolo 2019), and are expected to lead to further expansion into forests in the future. For example, most active mines are currently located in Central and South Sulawesi and North Maluku, but concessions to explore mining potential are distributed across Wallacea (https://geoportal.esdm.go.id/minerba/) and were linked to higher deforestation probability in our model. Conversion of forest to oil palm agriculture has been less prevalent in central Indonesia compared to other parts of the country, such as Sumatra and Kalimantan or neighbouring Malaysia (Supriatna et al 2017, Gaveau et al 2018). On Borneo, for example, plantations expanded by 170% between 2001 and 2017 (Gaveau et al 2018). Instead, communities in Wallacea have favoured small-scale farming for corn, coffee, cacao, coconut and tobacco, although this also leads to significant deforestation (Austin et al 2019). For instance, in Gorontalo, corn cultivation was promoted as a means to decrease poverty, but has resulted in growing encroachment and deforestation in protected areas (Supriatna et al 2020). However, in recent years, the oil palm industry has expanded in Central and West Sulawesi, a trend that together with expansion of resource extraction could lead to forest loss above the baseline projections presented here.
4.2. Caveats, uncertainties and scenario development
Like other modelling approaches, the accuracy of the deforestation projections are dependent on the assumptions made about what drives forest loss, the spatial resolution of the data, and the temporal scale at which models are calibrated. The scale of interpretation is limited to the scale at which the model was applied (180 m pixel resolution). The model is not intended to identify small deforestation events below the spatial resolution of the data, and projected dynamics inevitably become increasingly uncertain in the future. As with any such approach, being able to detect deforestation events at landscape scale would require refining models and incorporating finer-scale deforestation source data as well as predictor data at this higher resolution, which are not yet readily available at the scale of the Wallacea region.
We took a business-as-usual approach to our projections in order to assess a baseline trajectory against which subsequent trends, including possible interventions, can be compared. Although forest loss drivers and patterns in coming years will likely be similar to the recent past, future dynamics are unlikely to match the past perfectly. For example, future deforestation could be affected by changes in political leadership, agendas and development priorities (e.g. Ferrante and Fearnside 2019), variations in commodity prices for agricultural products (Gaveau et al 2018), changes in global climate and the socio-economic impacts of shock events such environmental catastrophes (earthquakes, tsunamis) or the global COVID-19 pandemic (Brancalion et al 2020).
Such potential future changes and their impact are impossible to anticipate and thus challenging to include in models as the one presented here. However, more refined landscape scale scenarios could be developed based on the presented baseline models, working with relevant stakeholders and beneficiaries in the region. These scenarios could help to explore the potential future developments that influence deforestation and better understand the uncertainties of our assumptions. Potential scenarios include allocation of investment in infrastructure and urban development projects, resource extraction such as mines or further agricultural expansion on the one hand, as well as the implementation and effectiveness of deforestation mitigation measures on the other. The data necessary to develop these scenarios could be more easily compiled and assumptions co-developed at landscape scale, creating highly relevant fine-scale projections of forest loss outcomes, their potential impact on endemic and threatened biodiversity and pathways to mitigate the impact.
4.3. Conservation solutions for Wallacea’s forests
Protected forests experience the lowest deforestation across Wallacea. KBAs that are predominately protected are predicted to suffer less deforestation by 2053 (median percentage loss: 21%) than those primarily unprotected (median percentage loss: 37%). Out of the 21 KBAs identified as the 20% most vulnerable, only three are fully protected, and most contained forests that were designated for conversion to agriculture. However, protection status does not prevent deforestation in every case. For example, in the two KBAs with highest expected forest loss by 2053 in terms of area (Pegunungan Tokalekaju and Gunung Lumut in Central Sulawesi, table S8 and figure S2), deforestation is projected in protected areas and areas designated as limited production forest, which cannot be legally converted to agriculture or other land-uses. Overlapping land claims for protection and resource extraction has led to substantial illegal extraction, encroachment and deforestation across Indonesia (Gaveau et al 2017, Baja et al 2019), indicating that long-term investment in monitoring and law enforcement is needed. Some of the best examples of improvements to date involve local communities, and have led to positive environmental outcomes in some protected areas in Sumatra (Linkie et al 2014, 2015).
Local community involvement in forest management has been the cornerstone of Indonesia’s social forestry programme since 2015, and has been promoted as a solution to alleviate development pressures on forest while improving social welfare (Kartodihardjo et al 2013, Meijaard et al 2020). By allowing the land to be used for multiple purposes the opportunity costs for conservation can be reduced, although the success of these schemes in addressing deforestation and poverty alleviation has been variable (Santika et al 2019), and the uptake of social forestry has been low outside West Indonesia (Meijaard et al 2020). Using deforestation risk maps such as the one presented here in combination with socio-economic information on what influences success of social forestry programmes, could help optimise these schemes by implementing them in areas in which high socio-economic gains coincide spatially with positive outcomes for deforestation reduction.
Other opportunities for bolstering forest protection arise from zero-deforestation pledges and sustainability certification systems in forestry and agricultural sectors. They could direct agricultural expansion away from areas with high biodiversity value and reduce pressure on primary forests. The designation of high conservation areas in oil palm plantations, for instance, can lead to positive outcomes for at least some threatened species (Deere et al 2020), although certification appears to have mixed outcomes for local communities (Santika et al 2020). Involvement of these communities in sustainability efforts is fundamental to reducing deforestation.
Large areas of Wallacea, particularly South Sulawesi and Nusa Tenggara, already lost substantial forest cover to urbanisation, farmland and mining, but still hold potential value to biodiversity and habitat connectivity. Restoration of mining sites and expired logging leases is already required in Indonesia, but the costs to fully compensate for biodiversity losses are extremely high (Budiharta et al 2018). This reinforces the need for strategic planning and mitigation at an early development phase, aided by information about potential future forest change such as the one presented here.
The future of Wallacea’s forests and biodiversity is at a crossroad, as Indonesia develops a new regulatory framework within which the natural environment is to be managed. With the introduction of the Omnibus Law and a new mining law in 2020, profound shifts in policy bring significant challenges and opportunities for environmental governance and conservation (Amatullah et al 2020, Sembiring et al 2020). Legislation for permit systems, environmental impact assessment and foreign/national investment in infrastructure and resource extraction projects are all under review. While Indonesia’s decentralisation led to more permits for mining, logging and large-scale agriculture, the upcoming ‘recentralisation’ could prove beneficial for strategic planning that reduces the environmental impacts of operations and curtails opportunities for corruption. However, loosening of permit requirements and changes to environmental impact assessments could also accelerate forest loss. Thus, our assessment provides a valuable baseline from which the effects of Wallacea’s new development plans can be evaluated, providing insights into how regional and localised interventions can help improve prospects for the archipelago’s highly threatened endemic biodiversity.
Acknowledgments
This study was funded under the Newton Fund’s Wallacea Programme via the UK Natural Environment Research Council (NERC, NE/S007067/1) and the Indonesian Ministry for Research, Technology & Higher Education (Ristekdikti, NKB-2892/UN2.RST/HKP.05.00/2020 and 1/E1/KP.PTNBH/2019). MJS was also supported by a Leverhulme Trust Research Leadership Award. Research in Indonesia was authorised by Ristekdikti under permit 268/E5/E5.4/2019 (7/TKPIPA/E5/Dit.K1/VI/2019).
Data availability statement
The data is included in the article or openly available from NERC EDS Environmental Information Data Centre under the following URL/DOI: https://doi.org/10.5285/c7148c20-c6b3-43e1-9f99-b6e38e4dfdaf.