25
$\begingroup$

Let us first define two positive definite matrices:

M1 = {{2, -6}, {4, 8}}; M2 = {{2, 3}, {4, 8}}; 

then set two points p1={-1,-1} and p2={1,1}. Finally we define an anisotropic distance function, namely:

d[q1_, q2_, M_] := Sqrt[(q1 - q2).M.(q1 - q2)] 

When trying to plot the anisotropic Voronoi cells as follows:

Show[ Graphics[Point[{p1, p2}]], RegionPlot[ { d[{x, y}, p1, M1] < d[{x, y}, p2, M2], d[{x, y}, p1, M1] > d[{x, y}, p2, M2] }, {x, -4, 4}, {y, -4, 4} ] ] 

I obtain the following image:

Resulting image with unwanted mesh

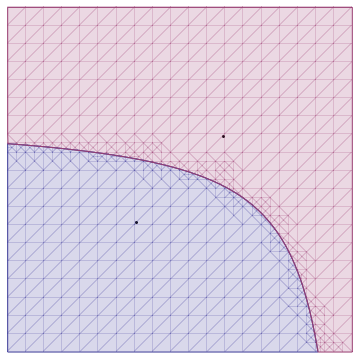
My question is: How can I get rid of the underlying mesh, which is visible in this example?

Two remarks:

  1. Removing the points' plotting also removes the mesh.
  2. Adding something like Mesh->None to the RegionPlot doesn't help.

Edit:

It seems this problem is specific to Mac OS X. Here is the Options[RegionPlot] output:

{AlignmentPoint -> Center, AspectRatio -> 1, Axes -> False, AxesLabel -> None, AxesOrigin -> Automatic, AxesStyle -> {}, Background -> None, BaselinePosition -> Automatic, BaseStyle -> {}, BoundaryStyle -> Automatic, ColorFunction -> Automatic, ColorFunctionScaling -> True, ColorOutput -> Automatic, ContentSelectable -> Automatic, CoordinatesToolOptions -> Automatic, DisplayFunction :> $DisplayFunction, Epilog -> {}, Evaluated -> Automatic, EvaluationMonitor -> None, FormatType :> TraditionalForm, Frame -> True, FrameLabel -> None, FrameStyle -> {}, FrameTicks -> Automatic, FrameTicksStyle -> {}, GridLines -> None, GridLinesStyle -> {}, ImageMargins -> 0.`, ImagePadding -> All, ImageSize -> Automatic, ImageSizeRaw -> Automatic, LabelStyle -> {}, MaxRecursion -> Automatic, Mesh -> None, MeshFunctions -> {#1 &, #2 &}, MeshShading -> None, MeshStyle -> Automatic, Method -> Automatic, PerformanceGoal :> $PerformanceGoal, PlotLabel -> None, PlotPoints -> Automatic, PlotRange -> Full, PlotRangeClipping -> True, PlotRangePadding -> Automatic, PlotRegion -> Automatic, PlotStyle -> Automatic, PreserveImageOptions -> Automatic, Prolog -> {}, RotateLabel -> True, TextureCoordinateFunction -> Automatic, TextureCoordinateScaling -> Automatic, Ticks -> Automatic, TicksStyle -> {}, WorkingPrecision -> MachinePrecision} 
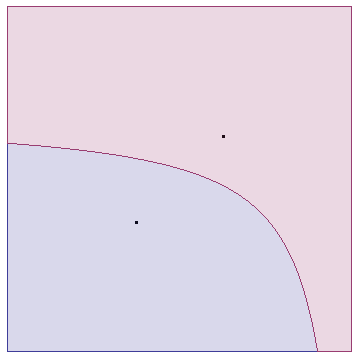
$\endgroup$
8
  • $\begingroup$ This mesh should not appear by default. Does it appear in other types of graphics, like DensityPlot for example? What OS and Mathematica version? $\endgroup$ Commented Feb 6, 2012 at 12:11
  • 1
    $\begingroup$ No mesh when I plot it on M 7.0.1.0, XP SP3 $\endgroup$ Commented Feb 6, 2012 at 12:13
  • $\begingroup$ Just in case: could you please include the result of Options[RegionPlot] in your question? $\endgroup$ Commented Feb 6, 2012 at 12:13
  • 1
    $\begingroup$ I get a mesh in Mathematica v8.0.4 on OS X Lion $\endgroup$ Commented Feb 6, 2012 at 12:38
  • 1
    $\begingroup$ I get a mesh on 8.0.4 on OS X Snow Leopard. $\endgroup$ Commented Feb 6, 2012 at 21:33

3 Answers 3

28
$\begingroup$

You are combining the images in the form

Show[Graphics[simplePrimitives], complicatedRegionPlot] 

The options in the resulting figure are inherited from the first term, namely Graphics[simplePrimitives]. This does not include the "TransparentPolygonMesh" -> True generated by RegionPlot. You see the mesh as a result. If you combine things as follows:

Show[complicatedRegionPlot, Graphics[simplePrimitives]] 

Then the resulting image will have the standard RegionPlot options and you'll no longer see the mesh.

I think the preferred way to do this, however, is to use Epilog, as in J.M.'s response.

$\endgroup$
6
  • 2
    $\begingroup$ +1 for explaining why the mesh shows up in addition to fixing the problem $\endgroup$ Commented Feb 6, 2012 at 13:44
  • $\begingroup$ What OS are you using? I see no mesh at all. I wonder if the mesh is a Mac-only thing. $\endgroup$ Commented Feb 6, 2012 at 14:04
  • $\begingroup$ The simplest solution in some sense although the others work as well. $\endgroup$ Commented Feb 6, 2012 at 14:49
  • $\begingroup$ @Szabolcs I used V8.0.4 on Mac OS X. I can confirm that V8.0.0 on Windows running in Virtual Machine displays no Mesh. That's odd. The inconsistency seems to be a bug to me. $\endgroup$ Commented Feb 6, 2012 at 15:21
  • $\begingroup$ Just a guess: Maybe graphics rendering is done differently on different platforms (or different modes are enabled by default), and some idiosyncrasy of the Mac rendering forced the developers to use this workaround. I noticed that @Heike's screenshot is not antialiased. Antialiasing is missing on Windows only when hardware accelerated rendering is used (this mode is automatically turned on e.g. if a Polygon with different VertexColors is included, but it's usually off) $\endgroup$ Commented Feb 6, 2012 at 15:42
23
$\begingroup$

You could use the (undocumented) option Method -> {"TransparentPolygonMesh" -> True} for this, e.g.

Show[Graphics[Point[{p1, p2}]], RegionPlot[{d[{x, y}, p1, M1] < d[{x, y}, p2, M2], d[{x, y}, p1, M1] > d[{x, y}, p2, M2]}, {x, -4, 4}, {y, -4, 4}], Method -> {"TransparentPolygonMesh" -> True}] 

which produce

Mathematica graphics

$\endgroup$
1
  • $\begingroup$ Method -> {"TransparentPolygonMesh" -> True} is not documented, for Graphics, in Mathematica 10.3.1 (and possibly in 10.3). $\endgroup$ Commented Dec 24, 2015 at 19:53
13
$\begingroup$

RegionPlot[{d[{x, y}, p1, M1] < d[{x, y}, p2, M2], d[{x, y}, p1, M1] > d[{x, y}, p2, M2]}, {x, -4, 4}, {y, -4, 4}, Epilog -> Point[{p1, p2}]] seems to do what you want:

RegionPlot[] example

$\endgroup$
1
  • $\begingroup$ On that note: if you just want to tack on simple graphics primitives (e.g. Point[], Line[]) to your plots, the use of either the Prolog or Epilog options looks slightly neater than using Show[]. $\endgroup$ Commented Feb 6, 2012 at 13:58

Start asking to get answers

Find the answer to your question by asking.

Ask question

Explore related questions

See similar questions with these tags.