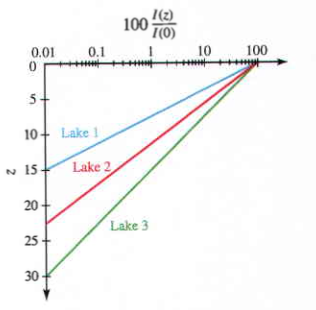
I need to produce a plot that looks something like this:
 from
from
from a function definition where z (the vertical axis) is the independent variable. I can easily invert the function, so making the vertical axis the dependent variable is easy. But I can't find a way to orient the system as it is in the picture, with x values increasing from left to right, and y values from top to bottom, with the axes as shown. I've found several related questions on this site, but nothing that specifically addresses this issue, nor can I find a Plot option that solves my problem.