Another way that produces a more uniform distribution of lines is to take the DistanceTransform of the text. I start with the text itself:
image = Rasterize@Graphics[ Text[ Style["MUSEUM", 64, Bold, FontFamily -> "Arial"] ], ImageSize -> {360, 200}] 
And the use the distance transform:
ImageAdjust@DistanceTransform@ColorNegate@image 
as probability weights of points:
probs[res_:0.01] := Rescale[ Flatten[ ImageData[ ImageAdjust@DistanceTransform@ColorNegate@image , DataReversed -> True] , 1] , {-res, 1}] -> Flatten[Transpose@Array[List, {360, 200}], 1]; Note I rescale the probabilities by res so that points corresponding to absolutely black regions have slightly more than zero probability of being picked.
Now I choose a lot of points at random but make sure that their x-coordinates are within a certain threshold, here 25 (if you notice, same thing happens in the image you posted):
{Opacity[0.05], Line@#} & /@ Select[RandomChoice[probs[], {20000, 2}], Norm[#[[1, 1]] - #[[2, 1]]] < 25 &] // Graphics 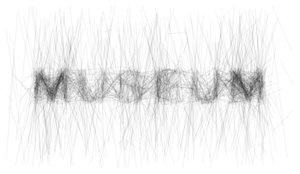
This is promising! Two parameters are key here: the amount by which you rescale the probability of black pixels and the threshold of x-coordinates you allow. Depending on how you choose these you need to use more or fewer lines and higher or lower opacity to achieve the desired result. Here's my attempt at the actual one:
{Opacity[0.09], Hue[RandomReal[]], Line@#} & /@ Select[RandomChoice[probs[.15], {50000, 2}], Norm[#[[1, 1]] - #[[2, 1]]] < 36 &] // Graphics[#, Background -> Black] & 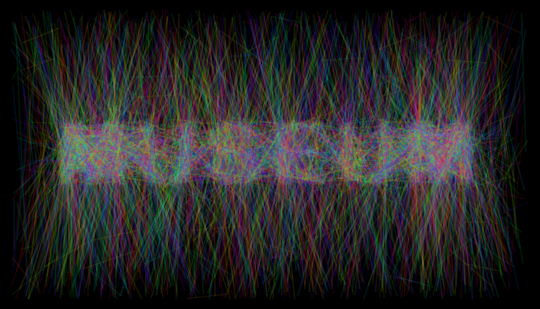
Finally, here's a pretty gif showing the effect of harmonically varying the threshold:
Table[{Opacity[0.09], Line@#} & /@ Select[RandomChoice[probs[.15], {10000, 2}], Norm[#[[1, 1]] - #[[2, 1]]] < Floor[36 + 15 Cos[i]] &] // Graphics, {i, 0, 2 π - π/12, π/12}]//Export[#Export["pretty.gif", gf]&#]& 