I've written my incredibly complex, incredibly elegant analysis function, that works great on small test data. But when I run it on my real (bigger) data set it keeps running out of memory. It turns out that the analysis function does not free memory, but I can't imagine why. It takes a large number of points, but returns only several scalar values.
Every time I run this it takes up about 500 MB of memory. (here is another example).
What is the best way to debug memory problems?
I've read the memory management tutorial, turned off cachingcaching and verified I have no lingering variableslingering variables in my contexts and of course I have set $HistoryLength to zero.
Also running Reverse@Sort[{ByteCount[Symbol[#]], #} & /@ Names["`*"]] show no huge memory symbols. Just the data:
{{191816648, "alldata"}, {28184, "before"}, {28184, "after"}, {24096, "compiledSelectBin"}, {15344, "AppendLeftRight"}, {8840, "compiledSelectBinFunc"}...} EDIT One can use this code to track memory consumption:
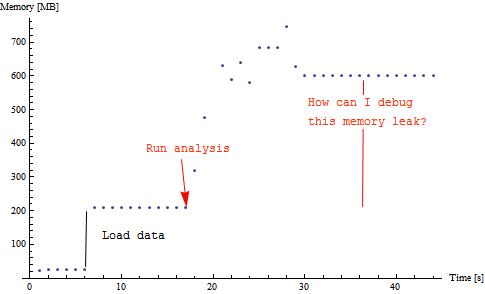
DynamicModule[{pm = {}}, Dynamic@Refresh[pm = Append[pm, MemoryInUse[]]; If[Length[pm] > 120, pm = Drop[pm, 1]]; ListPlot[pm/1024/1024, AxesLabel -> {"Time [s]", "Memory [MB]"}, PlotRange -> {0, All}], UpdateInterval -> 1, TrackedSymbols :> {}]] I think I finally have a minimum example. Here it is. Unzip to a folder and evaluate the two cells in LeakP.nb. If you evaluate the second cell multiple times you can watch the memory consumption grow. Could somebody (on win7 64 bit mma 8) confirm this?
EDIT 1
I really hope I have nailed it down. Here is a self contained example:
$HistoryLength = 0; data = RandomReal[{-1, 1}, {10, 100000, 2}]; data = Developer`ToPackedArray[#] & /@ data; data = Flatten[data, 1]; Dimensions[data] HistogramList[data, 30, Automatic]; ClearAll[data]; ClearSystemCache[]; EDIT 2
This is fixed in Mathematica 9.0.0.