added 48 characters in body
Source Link
Artes
  • 58.2k
  • 13
  • 161
  • 251

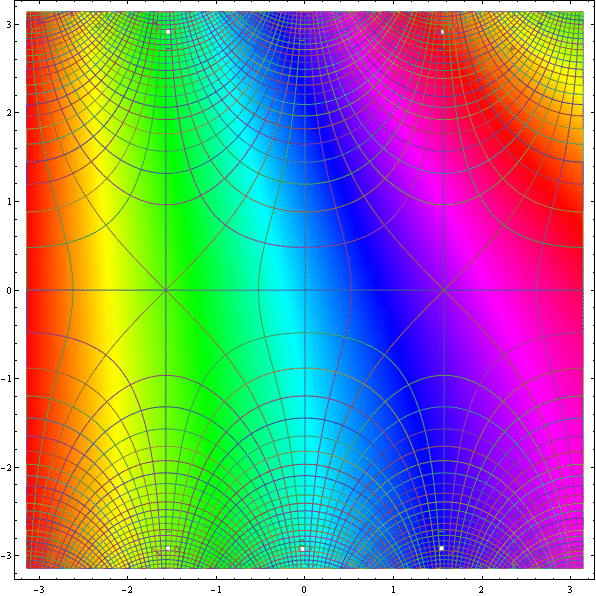
This seemsis a good way :

DensityPlot[ -(1/2)Rescale[ Arg[Sin[xArg[Sin[-x +- I y]], {-Pi, Pi}], {x, -Pi, Pi}, {y, -Pi, Pi}, MeshFunctions -> Function @@@ {{{x, y, z}, Re[Sin[x + I y]]},  {{x, y, z}, Im[Sin[x + I y]]},  {{x, y, z}, Abs[Sin[x + I y]]}},   MeshStyle -> {Directive[Gray, Opacity[0Directive[Opacity[0.8], Thickness[0.001]], Directive[Gray, Opacity[0Directive[Opacity[0.7], Thickness[0.001]],   Directive[White, Opacity[0.7]3], Thickness[0.005]]006]]},   ColorFunction -> Hue, Mesh -> 50, Exclusions -> None,  PlotPoints -> 100] 

enter image description hereenter image description here

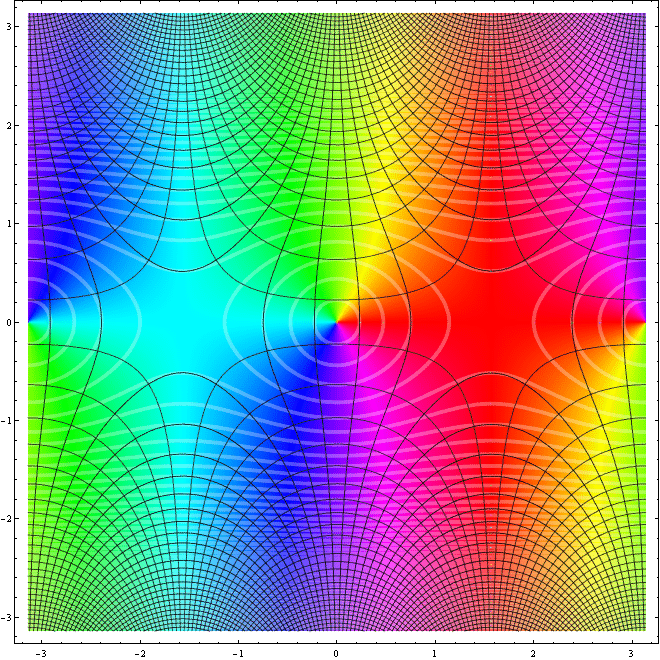
This seems a good way :

DensityPlot[ -(1/2) Arg[Sin[x + I y]], {x, -Pi, Pi}, {y, -Pi, Pi}, MeshFunctions -> Function @@@ {{{x, y, z}, Re[Sin[x + I y]]}, {{x, y, z}, Im[Sin[x + I y]]},  {{x, y, z}, Abs[Sin[x + I y]]}}, MeshStyle -> {Directive[Gray, Opacity[0.8], Thickness[0.001]], Directive[Gray, Opacity[0.7], Thickness[0.001]], Directive[White, Opacity[0.7], Thickness[0.005]]}, ColorFunction -> Hue, Mesh -> 50, Exclusions -> None,  PlotPoints -> 100] 
enter image description here

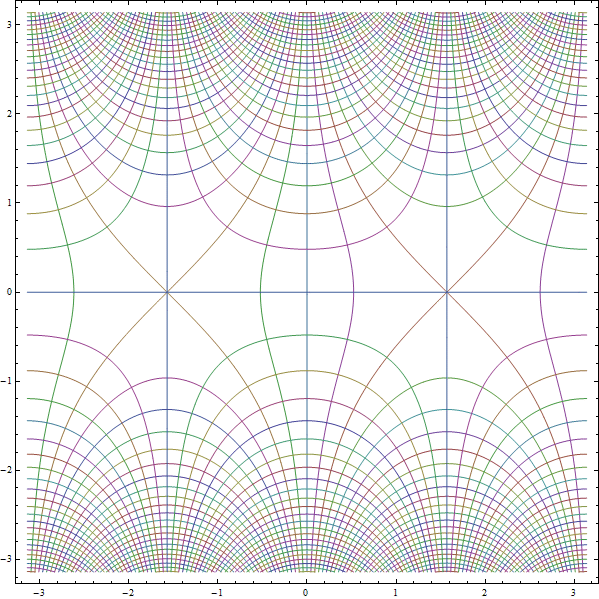
This is a good way :

DensityPlot[ Rescale[ Arg[Sin[-x - I y]], {-Pi, Pi}], {x, -Pi, Pi}, {y, -Pi, Pi}, MeshFunctions -> Function @@@ {{{x, y, z}, Re[Sin[x + I y]]},  {{x, y, z}, Im[Sin[x + I y]]}, {{x, y, z}, Abs[Sin[x + I y]]}},   MeshStyle -> {Directive[Opacity[0.8], Thickness[0.001]], Directive[Opacity[0.7], Thickness[0.001]],   Directive[White, Opacity[0.3], Thickness[0.006]]},   ColorFunction -> Hue, Mesh -> 50, Exclusions -> None, PlotPoints -> 100] 

enter image description here

added another approach
Source Link
Artes
  • 58.2k
  • 13
  • 161
  • 251

I can showThis seems a few ways to tackle the problem, which apprears promising.good way :

ContourPlot[ Evaluate @ {Table[ReDensityPlot[ @-(1/2) Sin[xArg[Sin[x + I y]y]], =={x, 1/2-Pi, kPi}, {ky, -25Pi, 25Pi}], MeshFunctions -> Function @@@ {{{x, y, z}, Re[Sin[x + I y]]},  Table[Im @ Sin[x + I y] == 1/2 k,  {k{x, -25y, 25z}], Im[Sin[x + I y]]},   {{x, -Piy, Piz}, {yAbs[Sin[x + I y]]}},  MeshStyle -Pi> {Directive[Gray, PiOpacity[0.8], Thickness[0.001]], Directive[Gray, Opacity[0.7], Thickness[0.001]], Directive[White, Opacity[0.7], Thickness[0.005]]}, PlotPoints  ColorFunction -> 100Hue, MaxRecursionMesh -> 5]50, Exclusions -> None, PlotPoints -> 100] 
enter image description hereenter image description here

andAnother ways to tackle the problem, which apprears promising.

RegionPlot[ContourPlot[ Evaluate @ {Table[1/2 (k + 1) > ReTable[Re @ Sin[x + I y] >== 1/2 k, {k, -25, 25}],  Table[1/2 (k + 1) > ImTable[Im @ Sin[x + I y] >== 1/2 k, {k, -25, 25}]},     {x, -Pi, Pi}, {y, -Pi, Pi}, PlotPoints -> 50100, MaxRecursion -> 4]5] 

enter image description hereenter image description here

I can show a few ways to tackle the problem, which apprears promising.

ContourPlot[ Evaluate @ {Table[Re @ Sin[x + I y] == 1/2 k, {k, -25, 25}], Table[Im @ Sin[x + I y] == 1/2 k, {k, -25, 25}]}, {x, -Pi, Pi}, {y, -Pi, Pi}, PlotPoints -> 100, MaxRecursion -> 5] 

enter image description here

and

RegionPlot[ Evaluate @ {Table[1/2 (k + 1) > Re @ Sin[x + I y] > 1/2 k, {k, -25, 25}], Table[1/2 (k + 1) > Im @ Sin[x + I y] > 1/2 k, {k, -25, 25}]},  {x, -Pi, Pi}, {y, -Pi, Pi}, PlotPoints -> 50, MaxRecursion -> 4] 

enter image description here

This seems a good way :

DensityPlot[ -(1/2) Arg[Sin[x + I y]], {x, -Pi, Pi}, {y, -Pi, Pi}, MeshFunctions -> Function @@@ {{{x, y, z}, Re[Sin[x + I y]]},    {{x, y, z}, Im[Sin[x + I y]]},   {{x, y, z}, Abs[Sin[x + I y]]}},  MeshStyle -> {Directive[Gray, Opacity[0.8], Thickness[0.001]], Directive[Gray, Opacity[0.7], Thickness[0.001]], Directive[White, Opacity[0.7], Thickness[0.005]]},   ColorFunction -> Hue, Mesh -> 50, Exclusions -> None, PlotPoints -> 100] 

enter image description here

Another ways to tackle the problem, which apprears promising.

ContourPlot[ Evaluate @ {Table[Re @ Sin[x + I y] == 1/2 k, {k, -25, 25}],  Table[Im @ Sin[x + I y] == 1/2 k, {k, -25, 25}]},    {x, -Pi, Pi}, {y, -Pi, Pi}, PlotPoints -> 100, MaxRecursion -> 5] 

enter image description here

deleted 5 characters in body; added 15 characters in body
Source Link
Artes
  • 58.2k
  • 13
  • 161
  • 251

I can show a few ways to tackle the problem, which apprears promising.

ContourPlot[ Evaluate @ {Table[Re @ Sin[x + I y] == 1/2 k, {k, -25, 25}], Table[Im @ Sin[x + I y] == 1/2 k, {k, -25, 25}]}, {x, -Pi, Pi}, {y, -Pi, Pi}, PlotPoints -> 100, MaxRecursion -> 5] 

enter image description here

and

RegionPlot[ Evaluate @ {Table[1/2 (k + 1) > Re @ Sin[x + I y] > 1/2 k, {k, -25, 25}], Table[1/2 (k + 1) > Im @ Sin[x + I y] > 1/2 k, {k, -25, 25}]}, {x, -Pi, Pi}, {y, -Pi, Pi}, PlotPoints -> 50, MaxRecursion -> 4] 

enter image description here

and

RegionPlot[ Evaluate @ {Table[1/2 (k + 1) > Re @ Sin[x + I y] > 1/2 k, {k, -25, 25}], Table[1/2 (k + 1) > Im @ Sin[x + I y] > 1/2 k, {k, -25, 25}]}, {x, -Pi, Pi}, {y, -Pi, Pi}, PlotPoints -> 50,  MaxRecursion -> 4,  ColorFunction -> Function[{x, y, z}, Hue[z]]]Hue[Re@Sin[x + I y]]]] 

enter image description hereenter image description here

These plots seem to be good points for further playing around to get better solutions.

I can show a few ways to tackle the problem, which apprears promising.

ContourPlot[ Evaluate @ {Table[Re @ Sin[x + I y] == 1/2 k, {k, -25, 25}], Table[Im @ Sin[x + I y] == 1/2 k, {k, -25, 25}]}, {x, -Pi, Pi}, {y, -Pi, Pi}, PlotPoints -> 100, MaxRecursion -> 5] 

enter image description here

and

RegionPlot[ Evaluate @ {Table[1/2 (k + 1) > Re @ Sin[x + I y] > 1/2 k, {k, -25, 25}], Table[1/2 (k + 1) > Im @ Sin[x + I y] > 1/2 k, {k, -25, 25}]}, {x, -Pi, Pi}, {y, -Pi, Pi}, PlotPoints -> 50, MaxRecursion -> 4] 

enter image description here

and

RegionPlot[ Evaluate @ {Table[1/2 (k + 1) > Re @ Sin[x + I y] > 1/2 k, {k, -25, 25}], Table[1/2 (k + 1) > Im @ Sin[x + I y] > 1/2 k, {k, -25, 25}]}, {x, -Pi, Pi}, {y, -Pi, Pi}, PlotPoints -> 50,  MaxRecursion -> 4,  ColorFunction -> Function[{x, y, z}, Hue[z]]] 

enter image description here

These plots seem to be good points for further playing around to get better solutions.

I can show a few ways to tackle the problem, which apprears promising.

ContourPlot[ Evaluate @ {Table[Re @ Sin[x + I y] == 1/2 k, {k, -25, 25}], Table[Im @ Sin[x + I y] == 1/2 k, {k, -25, 25}]}, {x, -Pi, Pi}, {y, -Pi, Pi}, PlotPoints -> 100, MaxRecursion -> 5] 

enter image description here

and

RegionPlot[ Evaluate @ {Table[1/2 (k + 1) > Re @ Sin[x + I y] > 1/2 k, {k, -25, 25}], Table[1/2 (k + 1) > Im @ Sin[x + I y] > 1/2 k, {k, -25, 25}]}, {x, -Pi, Pi}, {y, -Pi, Pi}, PlotPoints -> 50, MaxRecursion -> 4] 

enter image description here

and

RegionPlot[ Evaluate @ {Table[1/2 (k + 1) > Re @ Sin[x + I y] > 1/2 k, {k, -25, 25}], Table[1/2 (k + 1) > Im @ Sin[x + I y] > 1/2 k, {k, -25, 25}]}, {x, -Pi, Pi}, {y, -Pi, Pi}, PlotPoints -> 50, MaxRecursion -> 4, ColorFunction -> Function[{x, y}, Hue[Re@Sin[x + I y]]]] 

enter image description here

These plots seem to be good points for further playing around to get better solutions.

Source Link
Artes
  • 58.2k
  • 13
  • 161
  • 251
Loading