You could use the splitstyle function from this question :
splitstyle[styles__]:=Module[{st=Directive/@{styles}},{{Last[st=RotateLeft@st],#}}&]; g[y_]:=Total[Table[1,{z,1,Round[y+1]}]]; Plot[Table[g[x*n],{n,1,3}],{x,0,1},PlotStyle->splitstyle[Red,Green,Blue]] 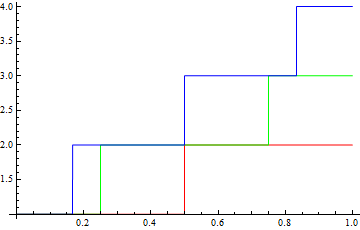
Or to use the standard colours:
Plot[Table[g[x*n],{n,1,3}],{x,0,1},PlotStyle->splitstyle@@ColorData[1]/@{1,2,3}] 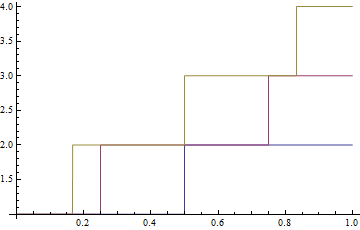
(Note: This does not work in Mathematica 11.)