Similar to Szabolcs's and my answers hereSzabolcs's and my answers here, I would suggest writing your own custom tick function, so that the labels are set into a Pane which can be both Rotated and have ImageMargins.
myTickList[min_, max_, seg_, shift_?NumericQ, phi_?NumericQ, len_: 0.01] := Table[{i, Rotate[Pane[Style["y =" <> ToString[i], LineSpacing -> {0, 12}], FrameMargins -> {{shift, 0}, {0, 0}}], phi], {len, 0}}, {i, If[Head[seg] === List, Union[{min, max}, seg], Range[min, max, seg]]}] Examples:
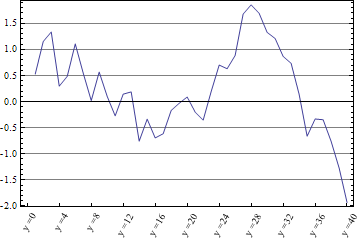
fakedata = Accumulate@RandomVariate[NormalDistribution[0, 0.5], 40]; ListLinePlot[fakedata, Frame -> True, GridLines -> {None, Automatic}, FrameTicks -> {{Automatic, Automatic}, {myTickList[0, 40, 4, 25, Pi/4], None}}] 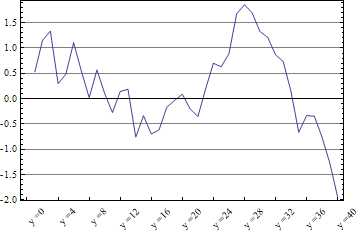
ListLinePlot[fakedata, Frame -> True, GridLines -> {None, Automatic}, FrameTicks -> {{Automatic, Automatic}, {myTickList[0, 40, 4, 5, Pi/3], None}}]