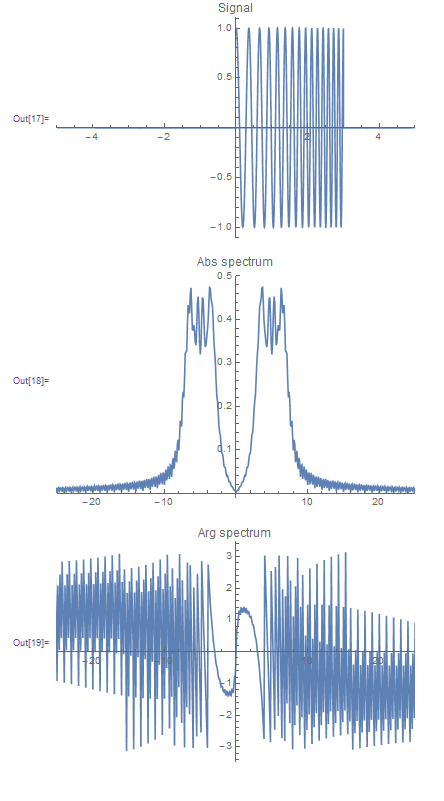
I am calculating the phase spectrum of a linear chirped signal. I actually don't know how the phase spectrum should be, but I would expect something in the range of interest (the bandwidth) at least to behave smoothly. This is what I obtain:
(*Define the time range and the number of sample points,this \ determines the frequency range and resolution.In order for the \ fftshift function to work properly,the number of sample points should \ be even.*) trange = 10.0; num = 2^12; dt = trange/num; df = 1/(num dt); fftshift[flist_] := RotateRight[flist, (Length@flist)/2 - 1]; signal[t_] := Cos[initialPhase + 2*Pi*(chirpInitialFrequency*t + (chirpLinearRate/2)* t^2)]*(UnitStep[t] - UnitStep[t - 3.0]) initialPhase = 0.0; chirpFrequencyCenter = 5.0; chirpBandwidth = 5.0; chirpInitialFrequency = chirpFrequencyCenter - chirpBandwidth/2; chirpFinalFrequency = chirpFrequencyCenter + chirpBandwidth/2; chirpDuration = 3.0; chirpLinearRate = (chirpFinalFrequency - chirpInitialFrequency)/ chirpDuration; (*Now define the sampled signal in the time domain*) xValuesSampledSignal := RotateLeft[Table[t, {t, -dt num/2 + dt, num/2 dt, dt}], num/2 - 1]; yValuesSampledSignal = signal /@ xValuesSampledSignal; (*Then define the spectrum,and plot the signal along with the \ amplitude and phase of the spectrum*) yValuesDiscreteFourierTransform = fftshift[Fourier[yValuesSampledSignal, FourierParameters -> {1, -1}]]; ListLinePlot[Transpose[{xValuesSampledSignal, yValuesSampledSignal}], PlotRange -> {{-5, 5}, All}, PlotLabel -> "Signal"] ListLinePlot[Abs[dt yValuesDiscreteFourierTransform], DataRange -> df {-num/2 + 1, num/2}, PlotRange -> {{-25, 25}, All}, PlotLabel -> "Abs spectrum"] ListLinePlot[Arg[dt yValuesDiscreteFourierTransform], DataRange -> df {-num/2 + 1, num/2}, PlotRange -> {{-25, 25}, All}, PlotLabel -> "Arg spectrum"] The magnitude spectrum seems correct. I think the routine to calculate the spectrum is correct, it works well with other more simple signals.