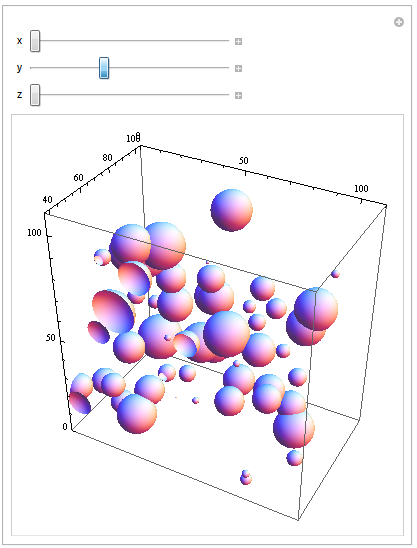
You can do this by specifying a dynamic PlotRange. Here is an example using Manipulate. You will need to adapt your range for each dimension:
z = 100; p = RandomReal[100, {z, 3}]; r = RandomReal[10, {z}]; obj = GraphicsComplex[p, Sphere[Range[z], r]]; t0 = AbsoluteTime[]; gr = Graphics3D[obj, Axes -> True] Manipulate[ Show[gr, PlotRange -> {{x, Automatic}, {y, Automatic}, {z, Automatic}}], {x, 0, 100, 1}, {y, 0, 100, 1}, {z, 0, 100, 1}]
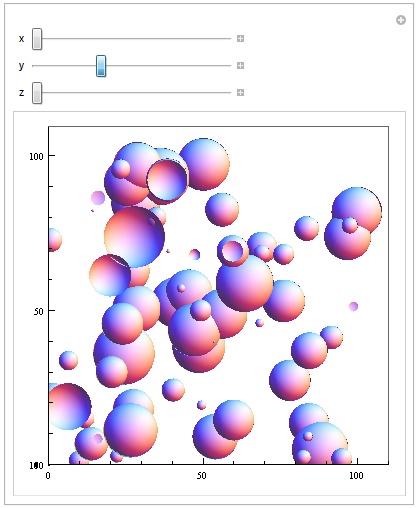
In order to generate images you will have to replace the Manipulate by a Table command and generate the images. Have a closer look at ViewPoint to specify the view on your Graphics3D object. This will allow you to generate images looking from the different directions.
Here is an example:
Manipulate[ Show[gr, ViewPoint -> {0, -Infinity, 0}, PlotRange -> {{x, Automatic}, {y, Automatic}, {z, Automatic}}], {x, 0, 100, 1}, {y, 0, 100, 1}, {z, 0, 100, 1}]
edit
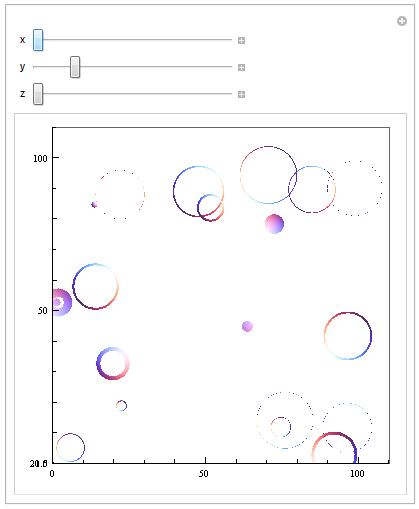
To get sections you could also use PlotRange. Here is an example giving you slices of thickness 1 in y-direction:
Manipulate[ Show[gr, ViewPoint -> {0, -Infinity, 0}, PlotRange -> {{x, Automatic}, {y, y + 1}, {z, Automatic}}], {x, 0, 100, 1}, {y, 0, 100, 1}, {z, 0, 100, 1}]
PlotRangeto emulate that to a certain degree, try:Manipulate[ gr = Graphics3D[obj, Axes -> True, PlotRange -> {Automatic, Automatic, {0, z}}], {{z, 100}, 0, 100}]. For the image stack, this will be more complicated... $\endgroup$Spheres or provide a minimal example of the data you are working with so we can help with your case. $\endgroup$