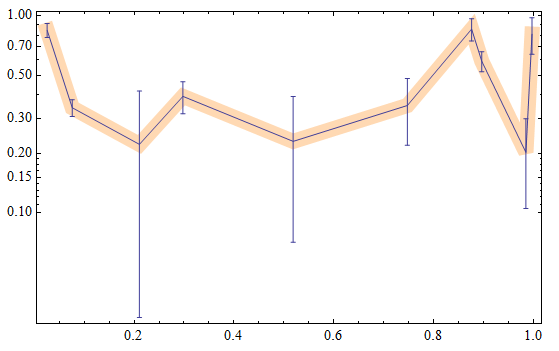
I have a plot with ErrorListPlot
data = Sort@RandomReal[1, {10, 2}]; error = RandomReal[0.5, 10]; errorplot = ErrorListPlot[ Partition[Riffle[data, ErrorBar /@ error], 2], Joined -> True] 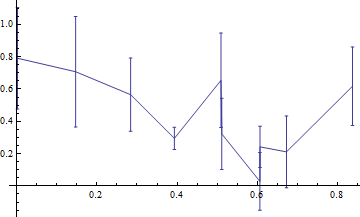
However, I would like to have it with the y-axis on a log scale. I can use ListLogPlot to get the log scale but this doesn't plot the errorbars.
logplot = ListLogPlot[ data, PlotRange -> All, AxesOrigin -> {0, 0}, Joined -> True ] 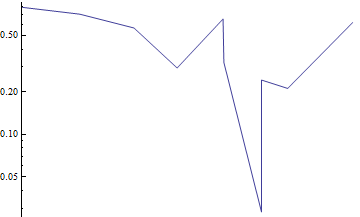
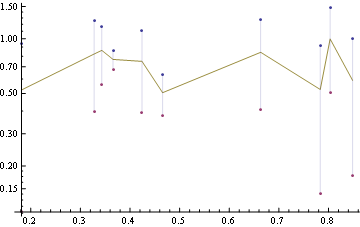
I tried Show[logplot, errorplot, PlotRange->All] to see if it would plot with the scale and ticks from the logplot but that didn't work right:
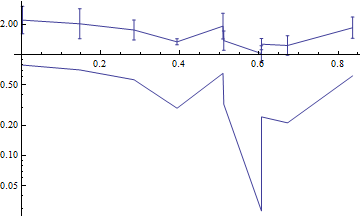
I also tried to take the Ticks from the logplot: Show[errorplot, Ticks -> Ticks /. AbsoluteOptions@logplot] but that just gives an error.
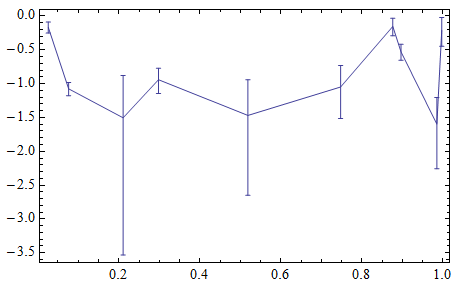
I tried to manually take the log of the data and then grab the tick-marks but that didn't work right
data = Sort@RandomReal[{10, 100}, {10, 2}]; error = RandomReal[20, 10]; logdata = Transpose[{data[[All, 1]], Log[10, data[[All, 2]]]}]; errorup = Log[10, data[[All, 2]] + error] - logdata[[All, 2]]; errordown = Log[10, data[[All, 2]] - error] - logdata[[All, 2]]; logerror = Log[10, error]; logplot = ListLogPlot[ data, Joined -> True, AxesOrigin -> {0, 0} ] errorlogplot = ErrorListPlot[ Partition[ Riffle[logdata, ErrorBar /@ Transpose[{errordown, errorup}]], 2], Joined -> True, AxesOrigin -> {0, 0} ] errorlogplot2 = ErrorListPlot[ Partition[ Riffle[logdata, ErrorBar /@ Transpose[{errordown, errorup}]], 2], Joined -> True, AxesOrigin -> {0, 0}, Ticks -> (Ticks /. AbsoluteOptions@logplot) ] 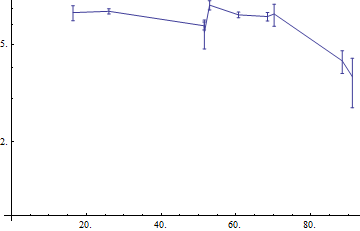
Is there an easy way to do this?
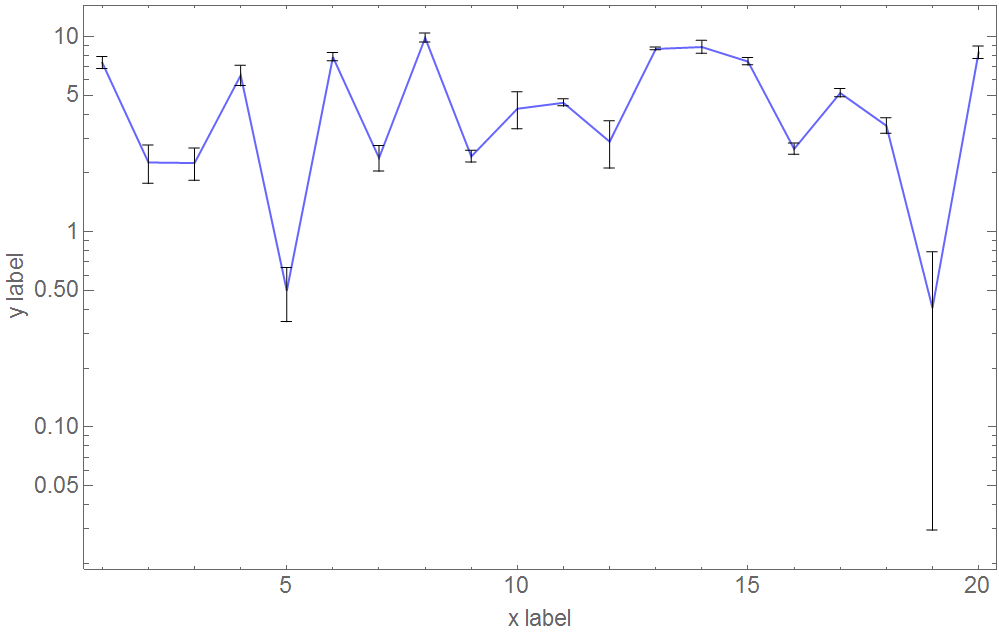
On the log scale the error bars will appear asymmetrical.
CustomTickspackage is a superior alternative to trying to set it up by hand. The edition I have installed isn't functioning correctly, otherwise I would have posted it as an answer. But, it is worth a look. $\endgroup$