Creating a data set dset with date values for the period of 5 months starting on a Sunday associated with random integers ( DayName @ {2015, 04, 12} (* Sunday*)).
dset = DateRange[{2015, 04, 12}, DatePlus[{2015, 04, 12}, {5, "Month"}], Quantity[1, "Days"]] // {#, RandomInteger[100, Length @ #]} & // Transpose ;
To create tick marks, FoldList gets all Wednesdays (Sunday + 4) from the dset by using DatePlus which is then associated with tick labels in the postfix expressions.
ticks = FoldList[DatePlus[#, {1, "Week"}] &, DatePlus[dset[[1, 1]], {4, "Day"}], dset[[All, 1]]] // {#, Rotate["Week " <> ToString @#, \[Pi]/2] & /@ Range @ Length@# } & // Transpose;
The grid corresponds to the starting of a week. E.g. Week 1 starts on the first Sunday. Therefore the value associated with Sunday lays on the first line and 6 points lay in between.
grid = FoldList[DatePlus[#, {1, "Week"}] &, dset[[1, 1]], dset[[All, 1]]];
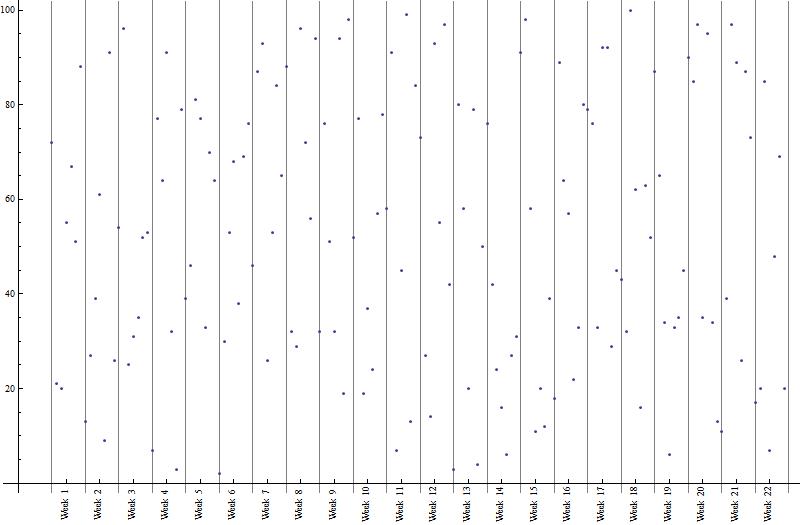
And here the plot
DateListPlot[dset, Ticks -> {ticks, Automatic}, AxesOrigin -> {DatePlus[dset[[1, 1]], {-1, "Week"}], 0}, GridLines -> {grid, None}, Axes -> True, ImageSize -> 800, Frame -> False]
Update 1
To demonstrate that above solution works as well if there are gaps of data points, because the ticks and grid lines do not depend on availability of data points.
Here a data set from Amundsen-Scott 90°00’S with temperature measurements in irregular intervals.
dset = WeatherData["WMO89009", "Temperature", {"Jun. 1, 2014", "Dec. 1, 2014", "Day"}];
Here a more robust way to generate ticks and grid lines, in order NOT to be dependent on first date value being a Sunday. Derived from idea presented by @kguler
ticks = Select[DateRange[dset[[1, 1]], dset[[-1, 1]]] , DayMatchQ[#, Wednesday] &] // {#, Rotate["Week " <> ToString@#, \[Pi]/2] & /@ Range@Length@#} & // Transpose; grid = Select[DateRange[dset[[1, 1]], dset[[-1, 1]]] , DayMatchQ[#, Sunday] &];
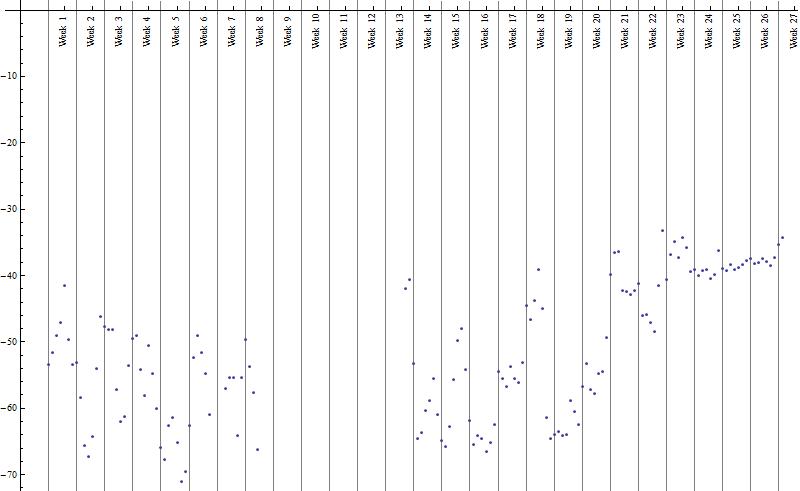
And here the plot again
DateListPlot[dset, Ticks -> {ticks, Automatic}, AxesOrigin -> {DatePlus[dset[[1, 1]], {-1, "Week"}], 0}, GridLines -> {grid, None}, Axes -> True, ImageSize -> 800, Frame -> False]
Points have intentionally not be joined in order to see the irregularity of measurements being taken. (I know, the question assumes 7 data points within 7 days, by the way not stating one on each day. Whereas the data points from Amundsen-Scott have an irregular number of measurements within 7 days and is only meant for demonstrating how to handle this special case.
Update 2
Weather data from the South Pole:
dset = WeatherData["WMO89009", "Temperature", {"Jun. 1, 2014", "Dec. 1, 2014", "Day"}];
Using DayRange is about 100 times faster to create ticks and grid than using Pick or Select in combination with DateRange.
fnDayDates[d_, dset_] := DayRange[First@First@#, First@Last@#, d]&[dset] ticks = fnDayDates[Wednesday,dset] // {#,Rotate["Week " <> ToString@#, \[Pi]/2] & /@ Range@Length@#}& // Transpose;
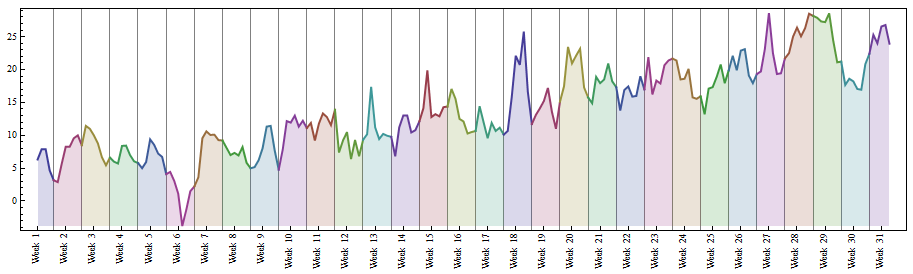
Here we go:
colorAntarctic[ z_ ] := Lighter @ RGBColor[z/2, 1 - z, 1]; DateListPlot[dset, Ticks -> {ticks, Automatic}, TicksStyle -> Directive[ Bold, 12], AxesOrigin -> {DatePlus[dset[[1, 1]], {-1, "Week"}], 0}, GridLines -> {fnDayDates[Sunday, dset], None}, ColorFunction -> colorAntarctic, Axes -> True, Filling -> Axis, PlotMarkers -> Automatic, Joined -> True, AspectRatio -> 1/3, ImageSize -> 800, Frame -> False, PlotLabel -> Style["South Pole 90\[Degree]00\[CloseCurlyQuote]S - Jun. 1, \ 2014-Dec. 1, 2014", Bold, 14]]
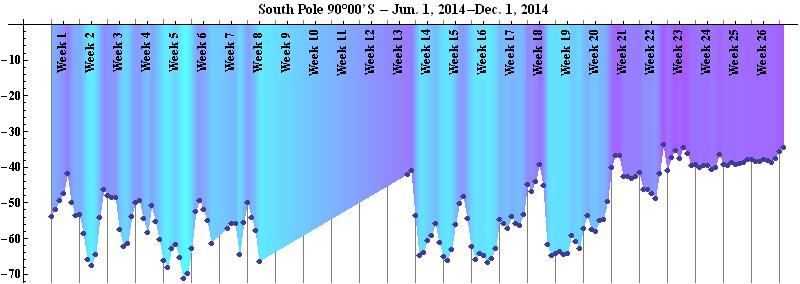
PS: by the way, penguins don't care, hi,hi,hi
DayRangeis about 100 times faster than usingSelectorPickin combination withDateRange. Enjoy "playing" with Mathematica, as you mention in your profile.... $\endgroup$