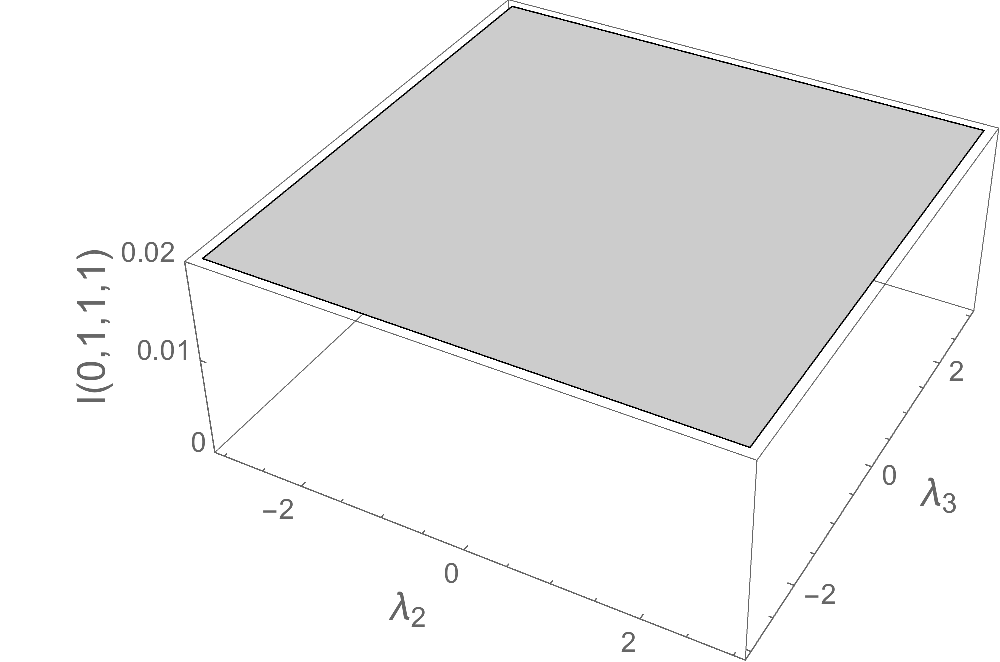
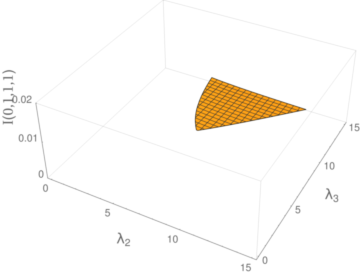
I assume you are referring to the z-axis label, which is badly behaved (it tends to jump to the top or bottom of the axis on my example plot), especially at certain viewpoints:
Although, by the nature of perspective in 3D plots, the axes labels will not always appear to be in the middle the the axis, here the position does seem to move out from the midpoint. My first guess was that this had to do with the interaction of the viewpoint and the Rotate applied to the label, but that doesn't seem to be the case, as an unrotated label does the same thing, so my current thought is that Mathematica's built-in label-placement function is struggling to find a clear view with the long numbers needed for the ticks.
Existing Answers
Positioning the label of the z-axis on 3D plots is a topic that has beed addressed here previously in several ways. As long as all you want is a good image of the plot to export, you could just specify the position of the label manually as a new graphic (as in this question) or via Inset with Epilog (here) or with Framed (here). However, these solutions are "static" and do not play well if you want to view your plot interactively by rotating and zooming, etc. This question shows several methods of dealing with axes labels overlapping crowded axes, but I think that the placement of the label in this instance should be addressed.
Workaround using Ticks
There is a "dynamic" work-around, but it is a bit dirty. Essentially, we can abuse Ticks to manually place a new axis label as a tick mark at the axis midpoint. Going through Ticks has the advantage that the label moves with the axis as it is repositioned when the plot is interacted with. We can define a new function for the ticks on the z-axis that includes a label (thanks to this question for the IntegerChop function):
zTicksLabel[ticks__, label_, style_: Null] := Module[ {IntegerChop, nform, nlength, zmin, zmax, t, longest}, IntegerChop = With[{r = Round[#]}, r + Chop[# - r]] &; nform[n_] := Which[ n == 0, n, 10^-5 <= Abs[n] <= 10^5, n, IntegerQ[Log10[Abs[n]]], ScientificForm[N@n, NumberFormat -> (Row[{If[n < 0, "-"], 10^#3}] &)], Divisible[n, 10^Floor@Log10@Abs[n]], ScientificForm[N@n, NumberPoint -> ""], True, ScientificForm[n] ]; nlength = First[ImageSize /. Options[Rasterize@Invisible@nform@#]] &; If[Length@{ticks} == 1, t = IntegerChop@ticks; {zmin, zmax} = {Min@t, Max@t}, {zmin, zmax} = First@{ticks}; t = IntegerChop[N@FindDivisions[{zmin, zmax}, Last@{ticks}]] ]; longest = First@MaximalBy[t, nlength]; Join[ {#, nform@#} & /@ t, {{ Mean[{zmax, zmin}], Row[ {Invisible@nform@longest, If[style === Null, l, Style[l, style]] /. {l -> Rotate[Row[{Invisible["M"], label, Invisible["M"]}], Pi/2]}, Invisible@nform@longest}, Invisible["M"] ] }} ] ];
In response to the comments, I have made this function more sophisticated. The argument ticks, takes either:
- an explicit list of tick positions like
{tick1, tick2, ...}, in which case only those ticks will be drawn; - or the sequence
{zmin, zmax}, n, in which case the function draws about n z-axis ticks between zmin and zmax according to the function FindDivisions (rather than the mysterious Mathematica default).
The argument label takes an expression (which can be anything that can be rotated and given a Style, but in most cases should be a string) and places it somewhat outside a tick in the middle. However, because the label is made with Ticks, it inherits the TickStyle options if they are specified, rather than LabelStyle, so I have left room for style options to be specified explicitly with the style argument. Also, this just rotates the label into a vertical position, rather than aligning it to the z-axis, as has been noted in the comments.
Apply it as so:
Plot3D[master, {l2, 0, 15}, {l3, 0, 15}, AxesLabel -> {Subscript[\[Lambda], 2], Subscript[\[Lambda], 3], Null}, LabelStyle -> Blue, TicksStyle -> Red, PlotRange -> {0, 0.02}, Ticks -> {Automatic, Automatic, zTicksLabel[{#1, #2}, 3, "I(0,1,1,1)", Orange] &} ]
As a further example, to make all axes labels a larger size, we just pass FontSize -> 14 to LabelStyle and the style argument of zTicksLabel (keeping TicksStyle at size 10):
Plot3D[master, {l2, 0, 15}, {l3, 0, 15}, AxesLabel -> {Subscript[\[Lambda], 2], Subscript[\[Lambda], 3], Null}, LabelStyle -> 14, TicksStyle -> 10, PlotRange -> {0, 0.02}, Ticks -> {Automatic, Automatic, zTicksLabel[{#1, #2}, 3, "I(0,1,1,1)", 14] &} ]
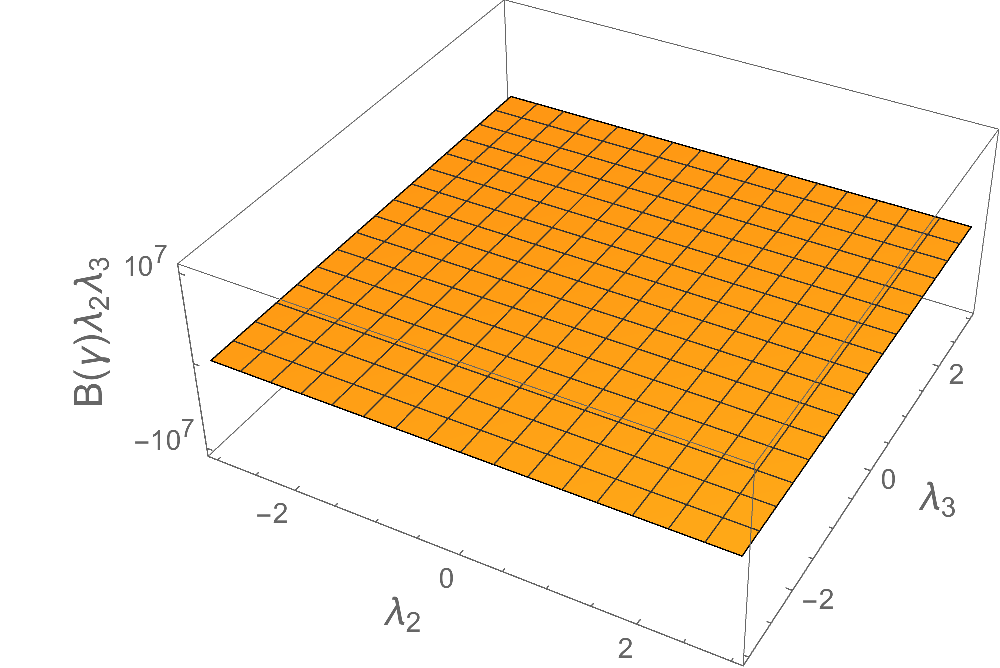
And lastly, if you only want two z-axis ticks at particular locations, do something like
Plot3D[master, {l2, 0, 15}, {l3, 0, 15}, AxesLabel -> {Subscript[\[Lambda], 2], Subscript[\[Lambda], 3], Null}, LabelStyle -> 14, TicksStyle -> 10, PlotRange -> {-1.1*^7, 1.1*^7}, Ticks -> { Automatic, Automatic, zTicksLabel[{-10^7, 10^7}, "B(\[Gamma])\!\(\*SubscriptBox[\(\[Lambda]\), \(2\)]\)\!(\*SubscriptBox[\(\[Lambda]\), \(3\)]\)", 14] & } ]
Pi/2makes it vertical. Thus the comments about seeing nothing askew. I suspect you would like the label to be parallel to the axis, but admittedly that is a guess. $\endgroup$