This example comes from the Mathematica documentation for Plot under Basic Examples.
Can someone please explain why these are each plotted as a different color in this case:
Plot[Evaluate[Table[BesselJ[n, x], {n, 4}]], {x, 0, 10}, Filling -> Axis] 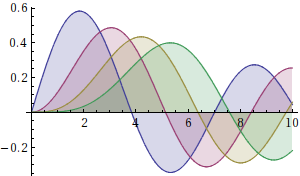
But when Evaluate[] is removed, all of them are the same color:
Plot[Table[BesselJ[n, x], {n, 4}], {x, 0, 10}, Filling -> Axis] 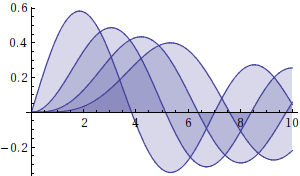
I know it must have to do with the order of things being evaluated, but I'm really not sure why it is working like this - can someone please point me in the correct direction?