ParametricPlot[
Evaluate@Table[{r*Cos[Theta], r*Sin[Theta]}, {r, 1, 5}], {Theta, 0,
2 Pi}]
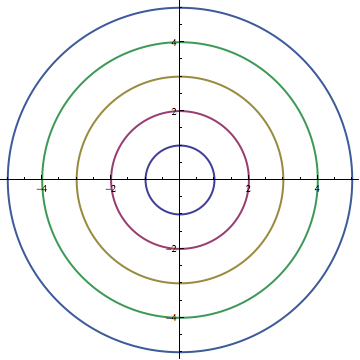
Why? Try `Trace[]` on both your version and the one with `Evaluate`. You see that, without `Evaluate`, you `ParametricPlot` sees `Table[{r Cos[Theta], r Sin[Theta]}, {r, 1, 5}]` as its first argument (`ParametricPlot` has attribute `HoldAll`), while with `Evaluate` it receives `{{Cos[Theta], Sin[Theta]}, {2 Cos[Theta],
2 Sin[Theta]}, {3 Cos[Theta], 3 Sin[Theta]}, {4 Cos[Theta], 4 Sin[Theta]}, {5 Cos[Theta], 5 Sin[Theta]}}` as its first argument.
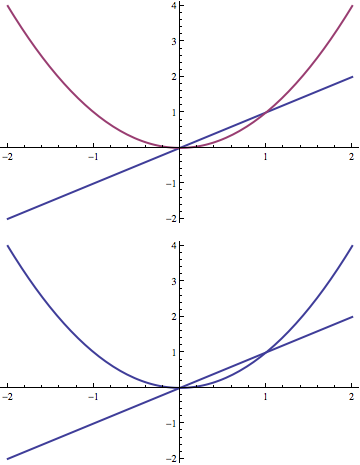
`ParametricPlot` (as well as `Plot`) seem to colour things differently or not depending on the head of their first argument. Example:
g[x___] := List[x]
Plot[{x, x^2}, {x, -2, 2}]
Plot[g[x, x^2], {x, -2, 2}]