Analogy and motivation
Let's say I'm a dairy farmer in Wisconsin. I look at some data about milk output from my dairy and find that output is down 50% from last year. This is a remarkable drop, and it must be explained! What on earth is causing this? I need to call a vet to check that there isn't some infection afflicting the cows. I need to send our feed for analysis and make sure it's properly balanced. I need to have our milking machinery serviced and checked. This is all going to be very time-consuming and expensive, but it's very important to get to the bottom of it.
But first, I should count how many cows I have, because if I have half as many cows as the year before, then all these expensive solutions which actually might be good for solving a "less milk per cow" problem are not the right solutions for a "fewer cows" problem.
If our Stack Exchange cows are our answerers, the analysis presented in OP is suggesting that our very best cows, the ones that produce more than 3 answers in a given week, are being particularly affected. They're dropping faster than the overall answers! The proportion of answers by the >=3 answerers is down! But, before we go about an expensive way of figuring out what is targeting our best producers, is there any simpler explanation?
One could, perhaps, find these same effects due to an actual cause that is "answers in general are down" plus an analysis strategy based on thresholds that creates an illusion that the top answerers are most affected.
Recapitulating results
I've grabbed post data from SO in two weeks, one from Nov 2022 and one from April 2023. I'll refer to these as just Nov and Apr from now on, but note these are 1-week examples from each, not the whole month.
Details of the analysis are here: https://pastebin.com/mVEMVuFD I'll just include the results in the rest of the post.
33571 answers in Nov. 21001 answers in Apr, 62.6% of Nov.
2399 users with >=3 answers in Nov. 1360 users with >=3 answers in Apr. 56.7%
47.9% of answers in Nov are by users with >=3 answers. 39.6% of answers in April are by users with >=3 answers.
So far, these results are right in line with the data presented in the original post here: the number of users with >=3 answers has dropped off quite a bit. The proportion of answers by the top answerers is down to a lower fraction than overall answers (39.6% is much smaller than 62.6%).
Checking an alternative explanation
So, let's consider another possible explanation, which is that this result is really just a threshold phenomenon, introduced by the 3-answer threshold. If we want to know if the top answerers are really more affected than the general trend, we need to compare to a suitable null hypothesis.
We can simulate what the data would look like if the decrease is uniform by starting with our Nov data, and randomly tossing out 62.6% of the answers. Then, we can look again at the April results and check whether they are consistent with a simple across-the-board reduction (if they look like the simulated data), or whether the data are more consistent with an alternative hypothesis that the top answerers are being specifically targeted (if they don't).
I run the simulation 1000 times. The mean total answers in the simulation is 21000, 62.6% of the original count (good reality check there).
The mean number of answerers with >=3 is 1461, 60.9% of Nov.
The percentage of answers by the top answerers is 40.9% of Nov.
It looks to me like indeed, the reduction in top answerers, at least comparing just these two weeks of data, is more than what you'd expect just from an across-the-board drop. The simulation predicts 1461 users with >=3 answers, but the actual April data only had 1360 such users. If you were just expecting the number to drop proportional to the number of answers, though, you would have predicted 2399 * 0.626 = 1502 users, so some of the drop is accounted for by the general effect filtered through the threshold, rather than the specific one.
Similarly, for the "fraction of answers by the top users", the simulation predicts 40.9%. The actual observation 39.6% doesn't seem practically different from the expectation (though it would be statistically significant if you used my simulations as an empirical null distribution).
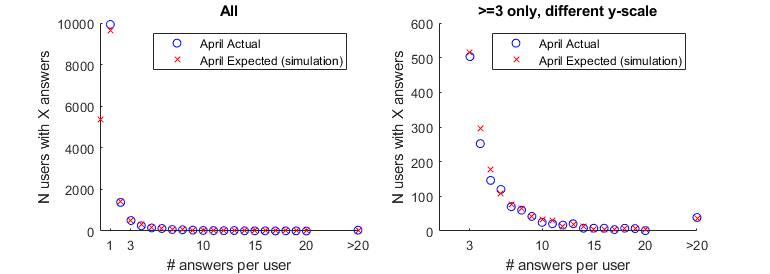
If we plot out the actual April versus simulated data we can get a better idea of what's going on. It looks like there are really no fewer answerers than predicted among the very top answerers, those producing over 20 answers in a week. Rather, it looks like there's a proportional drop in people posting 3-4 answers and an increase in those posting 1. I think these data would make me look for reasons that people aren't posting more than 1 answer, rather than only focusing on why people who post a lot of answers might be going away. Some people have pointed to the 30-minute timeout as a possible cause. One might look at historically how many of the people who post 3-4 answers in a week are new accounts posting in rapid succession to guess at that impact. You might also look at how many people experience the 30 minute block in a week. If the number seeing the block is similar to or greater than the 100-150 missing people who'd normally post >=3 answers, that might support it as a cause.
Importantly, the simulation predicts about 5300 people who would have posted in November just don't post an answer at all in April, and of the 1000 fewer people posting at least 3 answers, all but about 100 are following a general pattern of fewer answers rather than a specific pattern.
Summary
In summary, it does look like you're losing more of the "3+ answer" crowd than you'd expect just from the drop in answers, so it's important to figure out where they're going. Importantly, though, it may not be that anyone is going anywhere, really, but just that users who before would post 1 answer aren't posting more. Overall, the discrepancy in frequent answerers is still quite small compared to the overall drop in answers, which likely originates in a drop in questions, as others have pointed out.
I am very open to feedback and criticism on this approach. I didn't have a lot of time to play around in SEDE, but if someone wants to make a data set that has week-by-week data instead of just one week extracted, I'd be happy to tweak the rest of my code to plot this out over time.