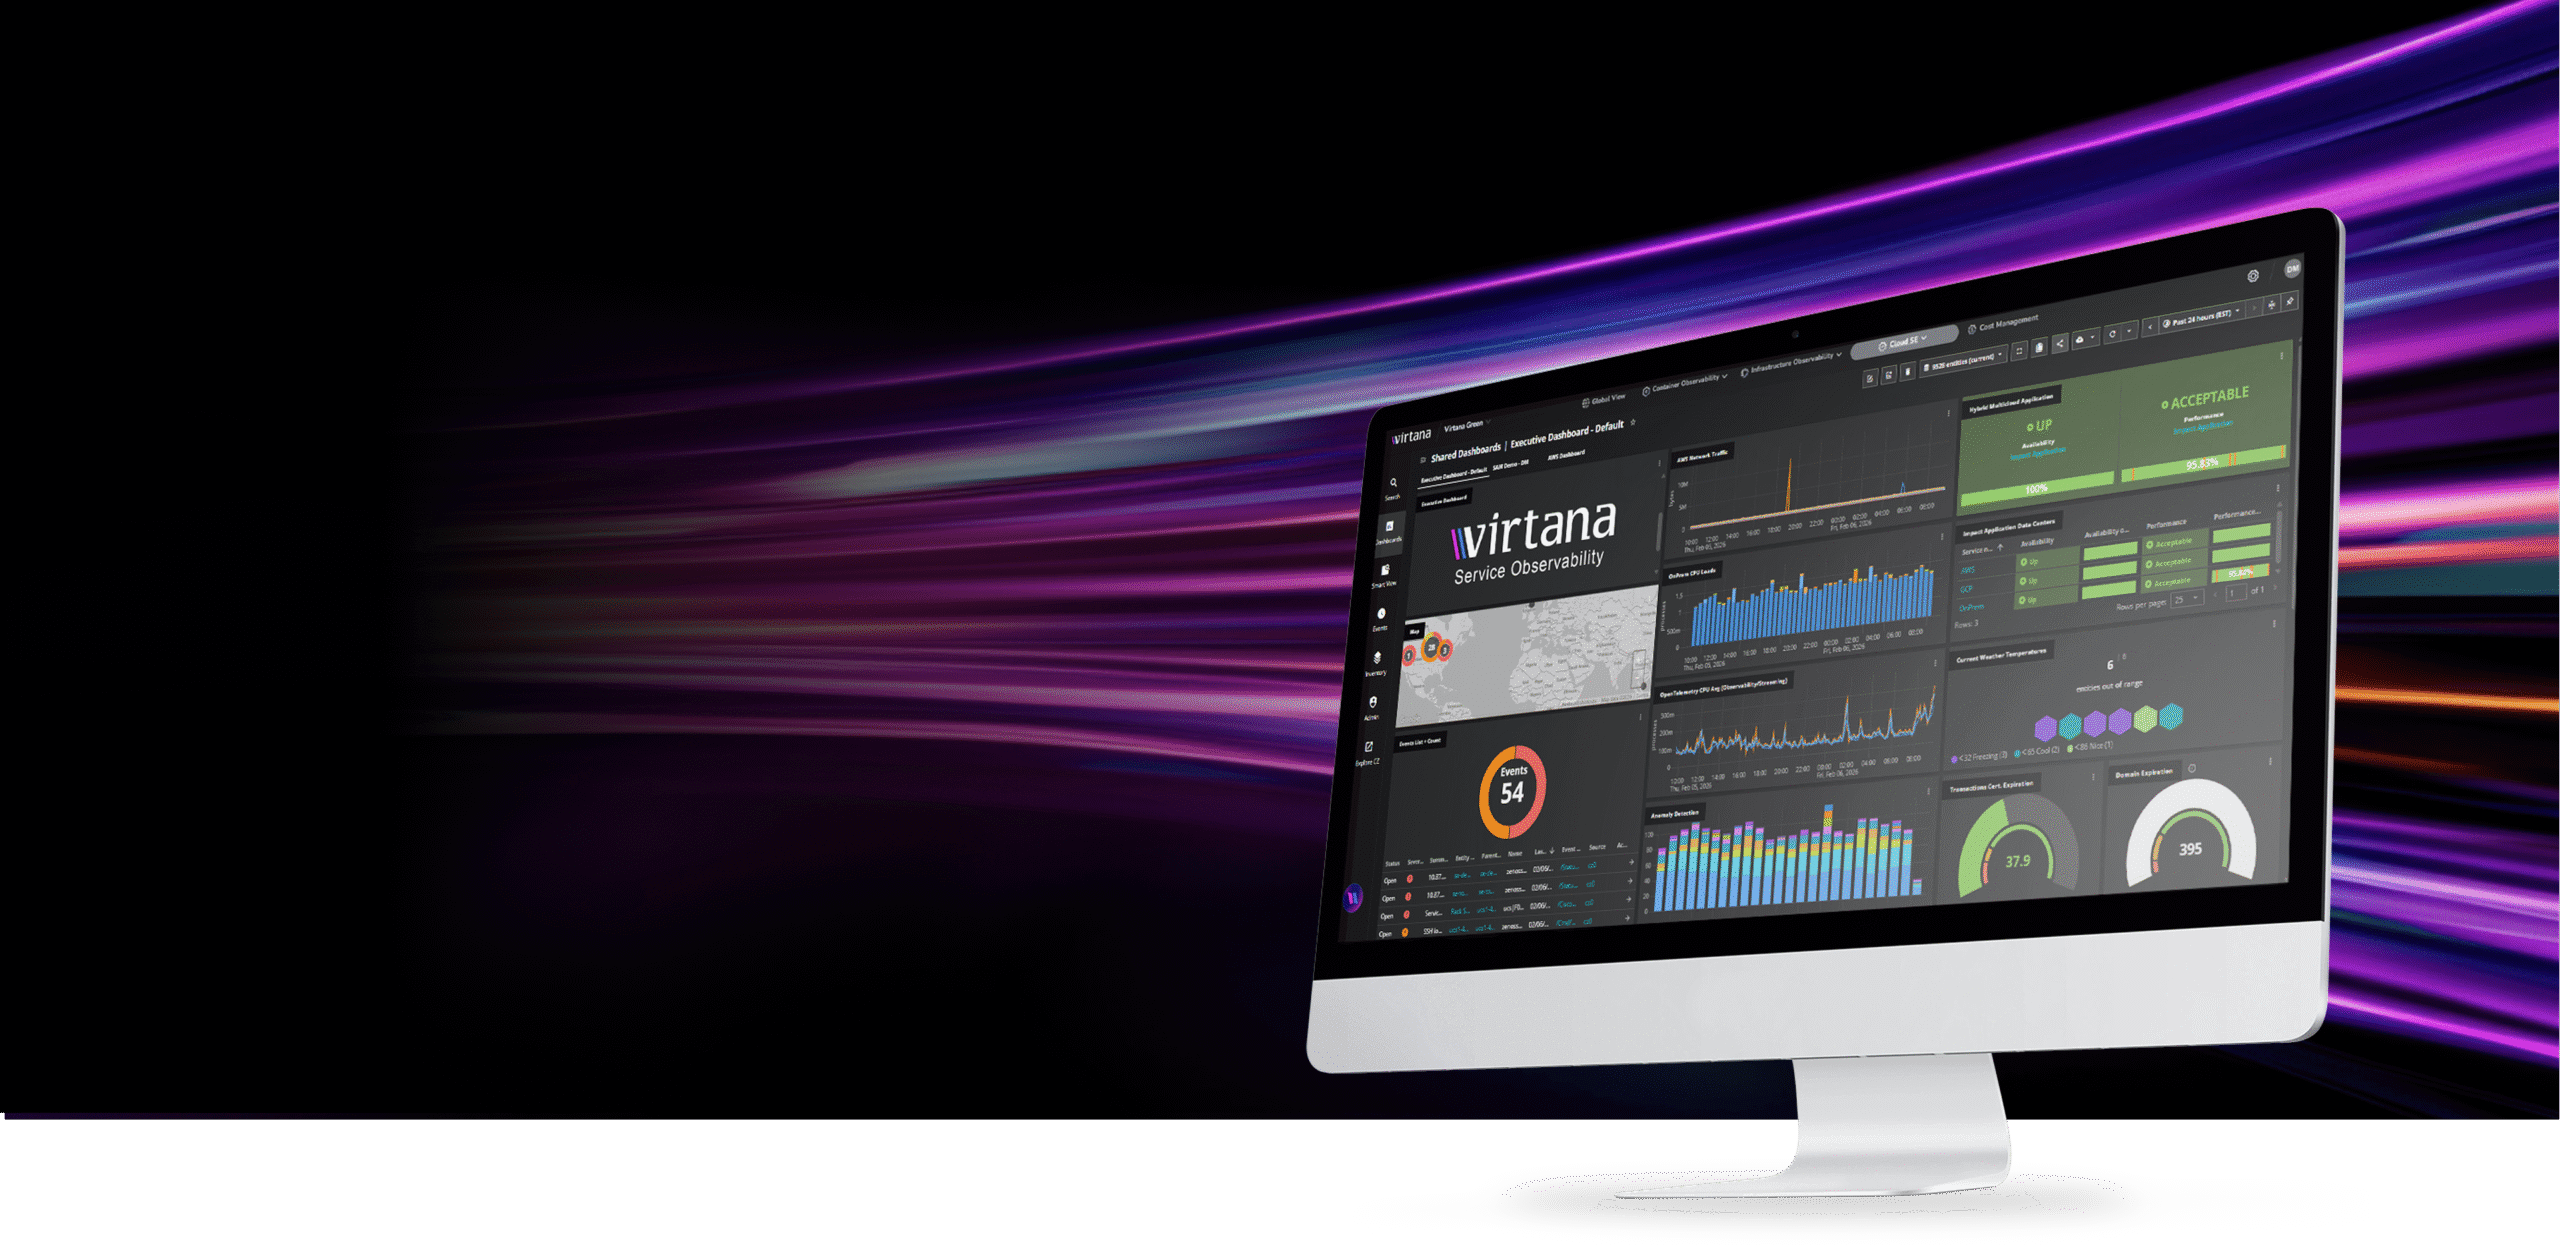
Welcome to Service Observability by Virtana
The Zenoss service observability you trust—now natively part of the Virtana Platform with AI-driven intelligence, impact analysis, and automation.
Request a Demo Explore Virtana Platform CapabilitiesImmediate AI-assisted root-cause analysis with real-time service modeling
Intelligent automation and integrations across IT operations workflows
Prevention of disruptions through predictive analytics and AIOps
See services the way your business experiences them
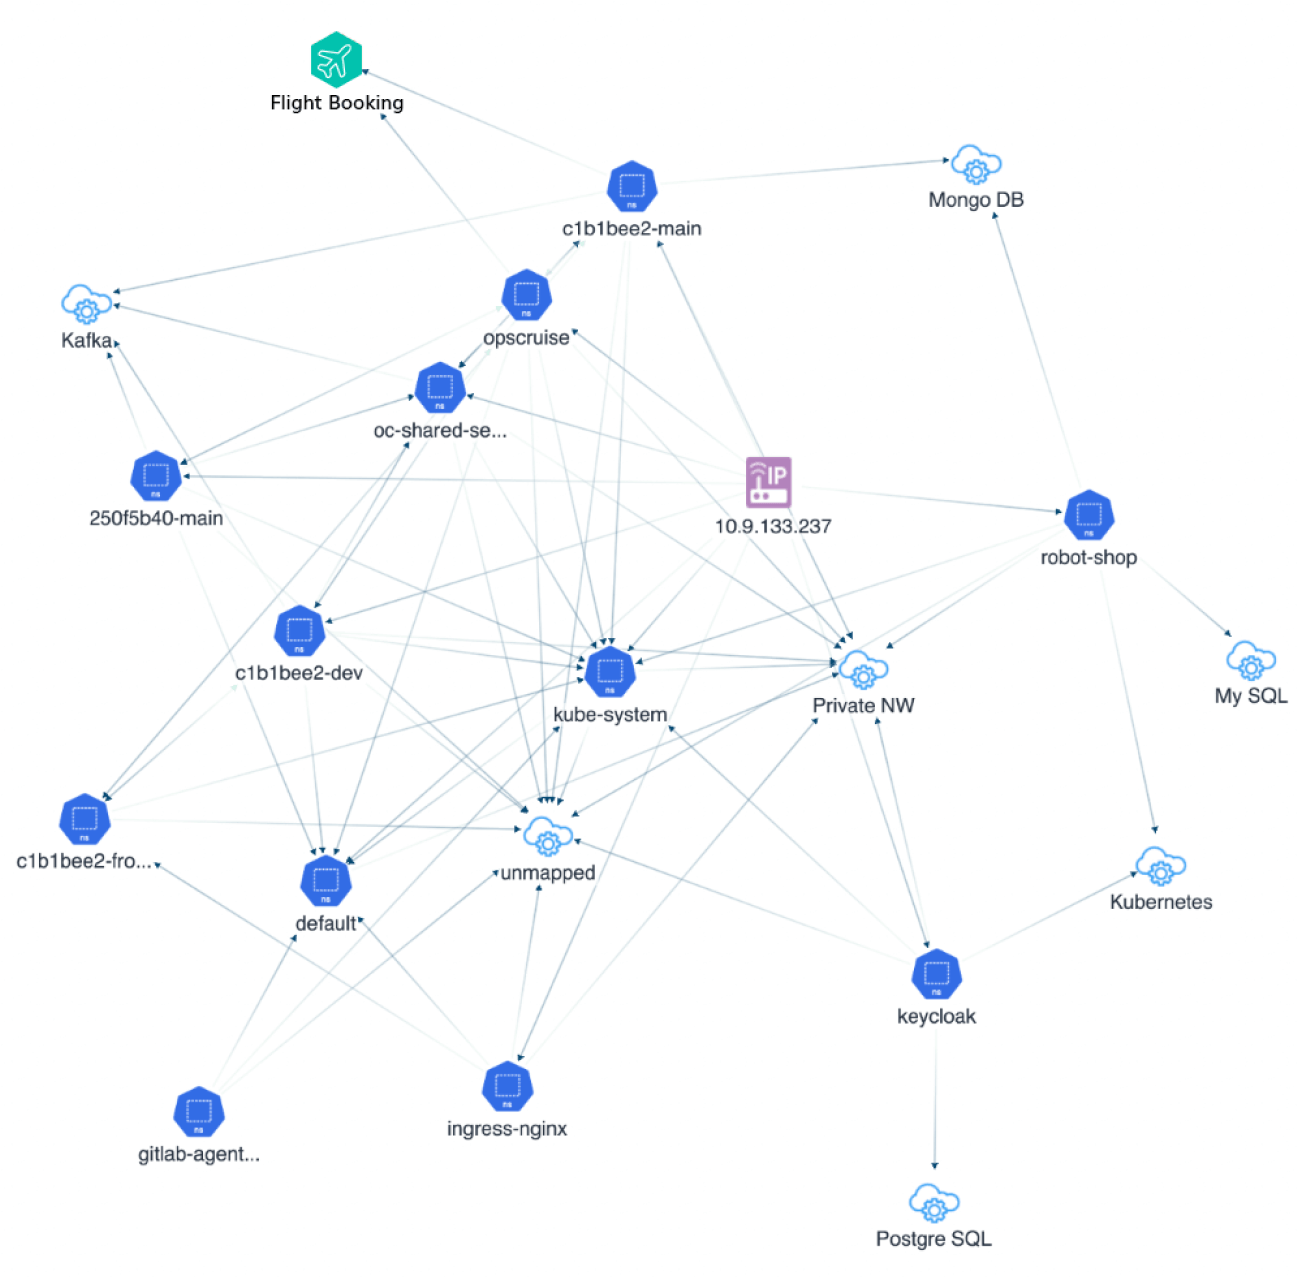
Service Observability connects infrastructure and application components into an end-to-end operational view, so teams can isolate issues faster, understand impact, and scale reliability across hybrid environments.
- Service impact, in real time: Understand what’s affected and what matters first.
- Faster isolation and AI-guided RCA: Reduce investigation time with service-aware modeling and intelligent correlation.
- Automation at scale: Share service context with ITOM tools and automate response across workflows.
- Predictive operations: Detect emerging issues early and prevent disruptions before customers feel them.
Virtana delivers a unified platform spanning Global View AIOps, Infrastructure Observability, Application Observability, Service Observability, AI Factory Observability, and Agentic AI (Virtana Copilot)—correlating signals across domains to cut noise, pinpoint issues faster, understand service impact, and automate recovery with policy-safe actions.

Built for IT Ops, SRE/DevOps, Platform Engineering, and leaders accountable for resilience, efficency, and modernization outcomes
Reduce visibility issues.
Too many monitoring tools and siloed data prevent teams from seeing the full-service picture. Virtana brings together service context, AI intelligence, and automation to modernize operations.
- Hybrid complexity demands visibility across on-prem and cloud infrastructure
- Mature operations require prediction and prevention—not just alerting
- AI-powered automation reduces manual effort and accelerates response
FAQs
Q: What happened to Zenoss?
A: Zenoss technology is now part of Virtana. Its service-centric observability capabilities have been integrated into the Virtana Platform and are delivered today as Service Observability. To learn more about the acquisition, please see the official press release.
Q: Is Service Observability the same product Zenoss customers used before?
A: Service Observability builds on the core Zenoss capabilities—service modeling, dependency mapping, and impact analysis—and extends them with Virtana’s AI-powered root cause intelligence, predictive analytics, and deeper integration across infrastructure, containers, and AI workloads.
Q: How does Service Observability fit into the broader Virtana Platform?
A: Service Observability is one pillar of the Virtana Platform, alongside Infrastructure Observability, Application Observability, AI Factory Observability, and Global View AIOps. Together, they provide unified visibility across services, infrastructure, and workloads.
Q: What about Zenoss Service Dynamics?
A: Zenoss Service Dynamics becomes Virtana Service Dynamics. Virtana is committed to flexible deployment with the entire Virtana Platform available on-prem or in a cloud.
Q: Do I need to buy the full Virtana Platform to use Service Observability?
A: No. Service Observability can be adopted independently, and it also integrates seamlessly with Virtana’s broader observability and AIOps capabilities as needs expand.
Q: How do I get started or see Service Observability in action?
A: You can request a demo below to see how Service Observability delivers the trusted Zenoss service-centric approach—now enhanced with AI-driven insights, predictive analytics, and automation inside the Virtana Platform.
Q: How can existing Zenoss customers get started with Virtana?
A: Zenoss users can reach out to their customer success manager to start using Virtana capabilities including:
- Agentic Alert Response Policies to automate your alert response workflows while keeping a human in the loop
- Application Observability to get deeper visibility into application behavior and container performance with distributed tracing and advanced analytics
Q: Where can existing Zenoss customers access support?
A: Existing Zenoss customers should continue to use the Zenoss Support Portal for product support, case management, and technical resources. Access the Zenoss Support Portal. Zenoss Cloud, Service Dynamics and ZenPack documentation are all available on docs.virtana.com.
Q: Where can I find Zenoss legal documents like the EULA, MSA, and DOSSS?
A: Zenoss legal and contractual documents, including the End User License Agreement (EULA), Master Services Agreement (MSA), and Description of Software, Support & Services (DOSSS), are available on the Virtana Legal Notices page. View Virtana Legal Notices.
Q: How can I access the Zenoss Learning Center?
Q: What happened to ZenPacks?
A: ZenPacks—extensions used to expand monitoring coverage in Zenoss—are now a core part of the Virtana Data Collector integration framework.
Virtana continues to support integration and extensibility capabilities that allow customers to monitor compute, network, storage, cloud, and application environments across hybrid infrastructure. These integrations are delivered through the Virtana Data Collector within the Virtana Platform. A unified data collector aligned with Service Observability, Application Observability, AI Factory Observability and Infrastructure Observability capabilities.
If you are an existing Zenoss customer using ZenPacks, you can continue to access support and documentation .
Q: Does Virtana provide hybrid IT monitoring?
A: Yes. Virtana delivers AI-powered hybrid IT monitoring through its unified observability platform, providing visibility across on-premises, colocation, and public cloud environments.
Service Observability to model business services across hybrid infrastructure joins: Global View AIOps to correlate signals, cut noise and resolve faster with event intelligence; AI Factory Observability for end-to-end visibility from GPUs to AI workloads; Application Observability to pinpoint issues faster with end-to-end context; Infrastructure Observability to align the performance, cost and capacity of your data centers; and Virtana Copilot, agentic AI providing natural language guidance with policy-safe actions. These modules make Virtana the deepest and broadest observability platform.
Virtana is designed for enterprises operating complex, multi-vendor hybrid environments that require both resilience and efficiency, the entire Virtana AI platform can be deployed on-prem or as a SaaS solution
Request a Demo of Service Observability
