blabb's answer may be right as far as it relates to what's wrong in the edited binary, but the suggestion to use a kernel debugger to find the problematic stack is way off course.
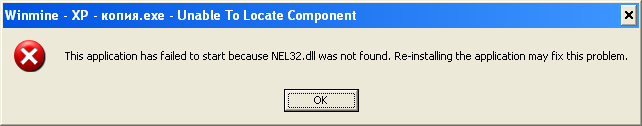
For this demonstration I use Windows XP rather than 7 like you. The effects are pretty much the same except that the NTSTATUS on XP is 0xC0000135 rather than 0xC000007B.
We open WinDbg and execute the binary:
Microsoft (R) Windows Debugger Version 6.12.0002.633 X86 Copyright (c) Microsoft Corporation. All rights reserved. CommandLine: "C:\Documents and Settings\Administrator\My Documents\Downloads\Winmine - XP - копия.exe" Symbol search path is: *** Invalid *** **************************************************************************** * Symbol loading may be unreliable without a symbol search path. * * Use .symfix to have the debugger choose a symbol path. * * After setting your symbol path, use .reload to refresh symbol locations. * **************************************************************************** Executable search path is: ModLoad: 01000000 01021000 winmine.exe ModLoad: 7c900000 7c9b2000 ntdll.dll ModLoad: 7c800000 7c8f6000 C:\WINDOWS\system32\kernel32.dll
A message box pops up:
We don't dismiss the message box. Instead we break in WinDbg:
Break-in sent, waiting 30 seconds... WARNING: Break-in timed out, suspending. This is usually caused by another thread holding the loader lock (b58.e64): Wake debugger - code 80000007 (first chance) eax=c0000135 ebx=00000000 ecx=00000a2b edx=00090608 esi=7ffdfc00 edi=c0000135 eip=7c90e514 esp=0006f6f0 ebp=0006f7d4 iopl=0 nv up ei pl nz na po cy cs=001b ss=0023 ds=0023 es=0023 fs=003b gs=0000 efl=00000203 *** ERROR: Symbol file could not be found. Defaulted to export symbols for ntdll.dll - ntdll!KiFastSystemCallRet: 7c90e514 c3 ret
Yes, it actually takes these 30 seconds.
Let's look at the stack:
0:000> ~* k . 0 Id: b58.e64 Suspend: 1 Teb: 7ffdf000 Unfrozen ChildEBP RetAddr WARNING: Stack unwind information not available. Following frames may be wrong. 0006f7d4 7c91c880 ntdll!KiFastSystemCallRet 0006fa34 7c9246f2 ntdll!LdrDisableThreadCalloutsForDll+0xce 0006fa78 7c92469b ntdll!sprintf+0x13e 0006fa98 7c9247d5 ntdll!sprintf+0xe7 0006fb14 7c920244 ntdll!sprintf+0x221 0006fc94 7c91fad7 ntdll!RtlInitMemoryStream+0x2e8 0006fd1c 7c90e457 ntdll!RtlLookupElementGenericTable+0x80 00000000 00000000 ntdll!KiUserApcDispatcher+0x7 1 Id: b58.324 Suspend: 1 Teb: 7ffde000 Unfrozen ChildEBP RetAddr WARNING: Stack unwind information not available. Following frames may be wrong. 0028fc98 7c901046 ntdll!KiFastSystemCallRet 0028fd18 7c90e457 ntdll!RtlEnterCriticalSection+0x46 00000000 00000000 ntdll!KiUserApcDispatcher+0x7
The second thread is probably used to communicate with CSRSS to display the message or something like that and it's not really interesting. The first thread is what's important, and its symbols are all messed up.
Let's fix that:
0:000> lm start end module name 01000000 01021000 winmine (deferred) 7c800000 7c8f6000 kernel32 (deferred) 7c900000 7c9b2000 ntdll (export symbols) C:\WINDOWS\system32\ntdll.dll 0:000> .symfix+ 0:000> .reload /f Reloading current modules ... 0:000> lm start end module name 01000000 01021000 winmine (pdb symbols) C:\Documents and Settings\Administrator\Desktop\debugger_x86\sym\winmine.pdb\3B7D84751\winmine.pdb 7c800000 7c8f6000 kernel32 (pdb symbols) C:\Documents and Settings\Administrator\Desktop\debugger_x86\sym\kernel32.pdb\A02FC3EC19B4474FB75641AF4C5B031C2\kernel32.pdb 7c900000 7c9b2000 ntdll (pdb symbols) C:\Documents and Settings\Administrator\Desktop\debugger_x86\sym\ntdll.pdb\CEFC0863B1F84130A11E0F54180CD21A2\ntdll.pdb 0:000> k ChildEBP RetAddr 0006f6ec 7c90d9ca ntdll!KiFastSystemCallRet 0006f6f0 7c9423a9 ntdll!NtRaiseHardError+0xc 0006f7d4 7c91c880 ntdll!LdrpMapDll+0x1b8 0006fa34 7c9246f2 ntdll!LdrpLoadImportModule+0x174 0006fa78 7c92469b ntdll!LdrpHandleOneNewFormatImportDescriptor+0x53 0006fa98 7c9247d5 ntdll!LdrpHandleNewFormatImportDescriptors+0x20 0006fb14 7c920244 ntdll!LdrpWalkImportDescriptor+0x19e 0006fc94 7c91fad7 ntdll!LdrpInitializeProcess+0xe1c 0006fd1c 7c90e457 ntdll!_LdrpInitialize+0x183 00000000 00000000 ntdll!KiUserApcDispatcher+0x7
You get pretty much the same stack blabb got, without any kernel debugging. Amazing, even if I say so myself.
By the way, the second thread's stack is still uninteresting:
0:000> ~1 k ChildEBP RetAddr 0028fc0c 7c90df5a ntdll!KiFastSystemCallRet 0028fc10 7c919b23 ntdll!NtWaitForSingleObject+0xc 0028fc98 7c901046 ntdll!RtlpWaitForCriticalSection+0x132 0028fca0 7c924d2d ntdll!RtlEnterCriticalSection+0x46 0028fd18 7c90e457 ntdll!_LdrpInitialize+0xf0 00000000 00000000 ntdll!KiUserApcDispatcher+0x7
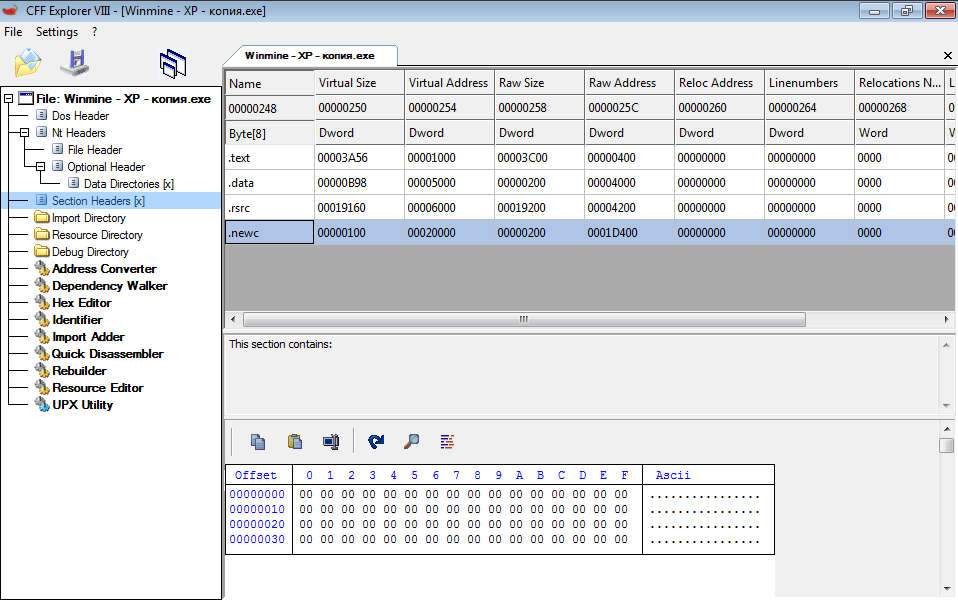
We can look at the parameters to these functions and see the problem in the bound import table:
0:000> kb ChildEBP RetAddr Args to Child 0006f6ec 7c90d9ca 7c9423a9 c0000135 00000002 ntdll!KiFastSystemCallRet 0006f6f0 7c9423a9 c0000135 00000002 00000003 ntdll!NtRaiseHardError+0xc 0006f7d4 7c91c880 00020498 7ffdfc00 00000000 ntdll!LdrpMapDll+0x1b8 0006fa34 7c9246f2 00020498 010002ab 01000000 ntdll!LdrpLoadImportModule+0x174 0006fa78 7c92469b 7ffd6000 00020498 00191ee0 ntdll!LdrpHandleOneNewFormatImportDescriptor+0x53 0006fa98 7c9247d5 7ffd6000 00020498 00191ee0 ntdll!LdrpHandleNewFormatImportDescriptors+0x20 0006fb14 7c920244 00020498 00191ee0 7ffdf000 ntdll!LdrpWalkImportDescriptor+0x19e 0006fc94 7c91fad7 0006fd30 7c900000 0006fce0 ntdll!LdrpInitializeProcess+0xe1c 0006fd1c 7c90e457 0006fd30 7c900000 00000000 ntdll!_LdrpInitialize+0x183 00000000 00000000 00000000 00000000 00000000 ntdll!KiUserApcDispatcher+0x7 0:000> du 7ffdfc00 7ffdfc00 "NEL32.dll" 0:000> db 010002ab 010002ab 4e 45 4c 33 32 2e 64 6c-6c 00 47 44 49 33 32 2e NEL32.dll.GDI32. 010002bb 64 6c 6c 00 55 53 45 52-33 32 2e 64 6c 6c 00 53 dll.USER32.dll.S 010002cb 48 45 4c 4c 33 32 2e 64-6c 6c 00 57 49 4e 4d 4d HELL32.dll.WINMM 010002db 2e 64 6c 6c 00 43 4f 4d-43 54 4c 33 32 2e 64 6c .dll.COMCTL32.dl 010002eb 6c 00 00 00 00 00 00 00-00 00 00 00 00 00 00 00 l............... 010002fb 00 00 00 00 00 00 00 00-00 00 00 00 00 00 00 00 ................ 0100030b 00 00 00 00 00 00 00 00-00 00 00 00 00 00 00 00 ................ 0100031b 00 00 00 00 00 00 00 00-00 00 00 00 00 00 00 00 ................
If you want to trace through the loading process rather than only see the stack after the fail you can do that too with the user mode debugger.
Let's dismiss the message box, and tell WinDbg to break at process creation instead of at the so-called initial breakpoint which happens only after the static imports have been resolved:
0:000> sxe cpr 0:000> .restart CommandLine: "C:\Documents and Settings\Administrator\My Documents\Downloads\Winmine - XP - копия.exe" Symbol search path is: srv* Executable search path is: eax=01003e21 ebx=7ffd4000 ecx=7c910060 edx=7c90e920 esi=0078c60c edi=00ecf554 eip=7c810735 esp=0006fffc ebp=7c91005d iopl=0 nv up ei pl nz na po nc cs=001b ss=0023 ds=0023 es=0023 fs=0038 gs=0000 efl=00000200 7c810735 ?? ??? 0:000> lm start end module name 01000000 01021000 winmine (deferred) 0:000> k ChildEBP RetAddr WARNING: Frame IP not in any known module. Following frames may be wrong. 0006fff8 00000000 0x7c810735
OMG what is this?! Only winmine loaded? But we know the ntdll is mapped into every Win32 process right from the start.
Well, ntdll is actually mapped, but the debugger still didn't get a debug event about it. That's how early we're in the process initialization process.
We can wait for this event by using sxe ld ntdll (or sxe ld), or we can force WinDbg to be made aware ntdll. Then we can put breakpoints on ntdll!LdrpHandleOneNewFormatImportDescriptor etc.:
0:000> sxe ld ntdll 0:000> g ModLoad: 7c900000 7c9b2000 ntdll.dll eax=01003e21 ebx=7ffd4000 ecx=7c910060 edx=7c90e920 esi=0078c60c edi=00ecf554 eip=7c810735 esp=0006fffc ebp=7c91005d iopl=0 nv up ei pl nz na po nc cs=001b ss=0023 ds=0023 es=0023 fs=0038 gs=0000 efl=00000200 7c810735 ?? ??? 0:000> lm start end module name 01000000 01021000 winmine (deferred) 7c900000 7c9b2000 ntdll (deferred) 0:000> .symfix+ 0:000> .reload /f Reloading current modules .. 0:000> bu ntdll!LdrpHandleOneNewFormatImportDescriptor 0:000> bl 0 e 7c9246ad 0001 (0001) 0:**** ntdll!LdrpHandleOneNewFormatImportDescriptor 0:000> g Breakpoint 0 hit eax=0006faac ebx=7ffd4000 ecx=000000b4 edx=0000415c esi=01000248 edi=00000001 eip=7c9246ad esp=0006fa7c ebp=0006fa98 iopl=0 nv up ei pl nz na pe nc cs=001b ss=0023 ds=0023 es=0023 fs=003b gs=0000 efl=00000206 ntdll!LdrpHandleOneNewFormatImportDescriptor: 7c9246ad 8bff mov edi,edi
There's absolutely no need for kernel debugging here.
Everything we need is available from user mode.