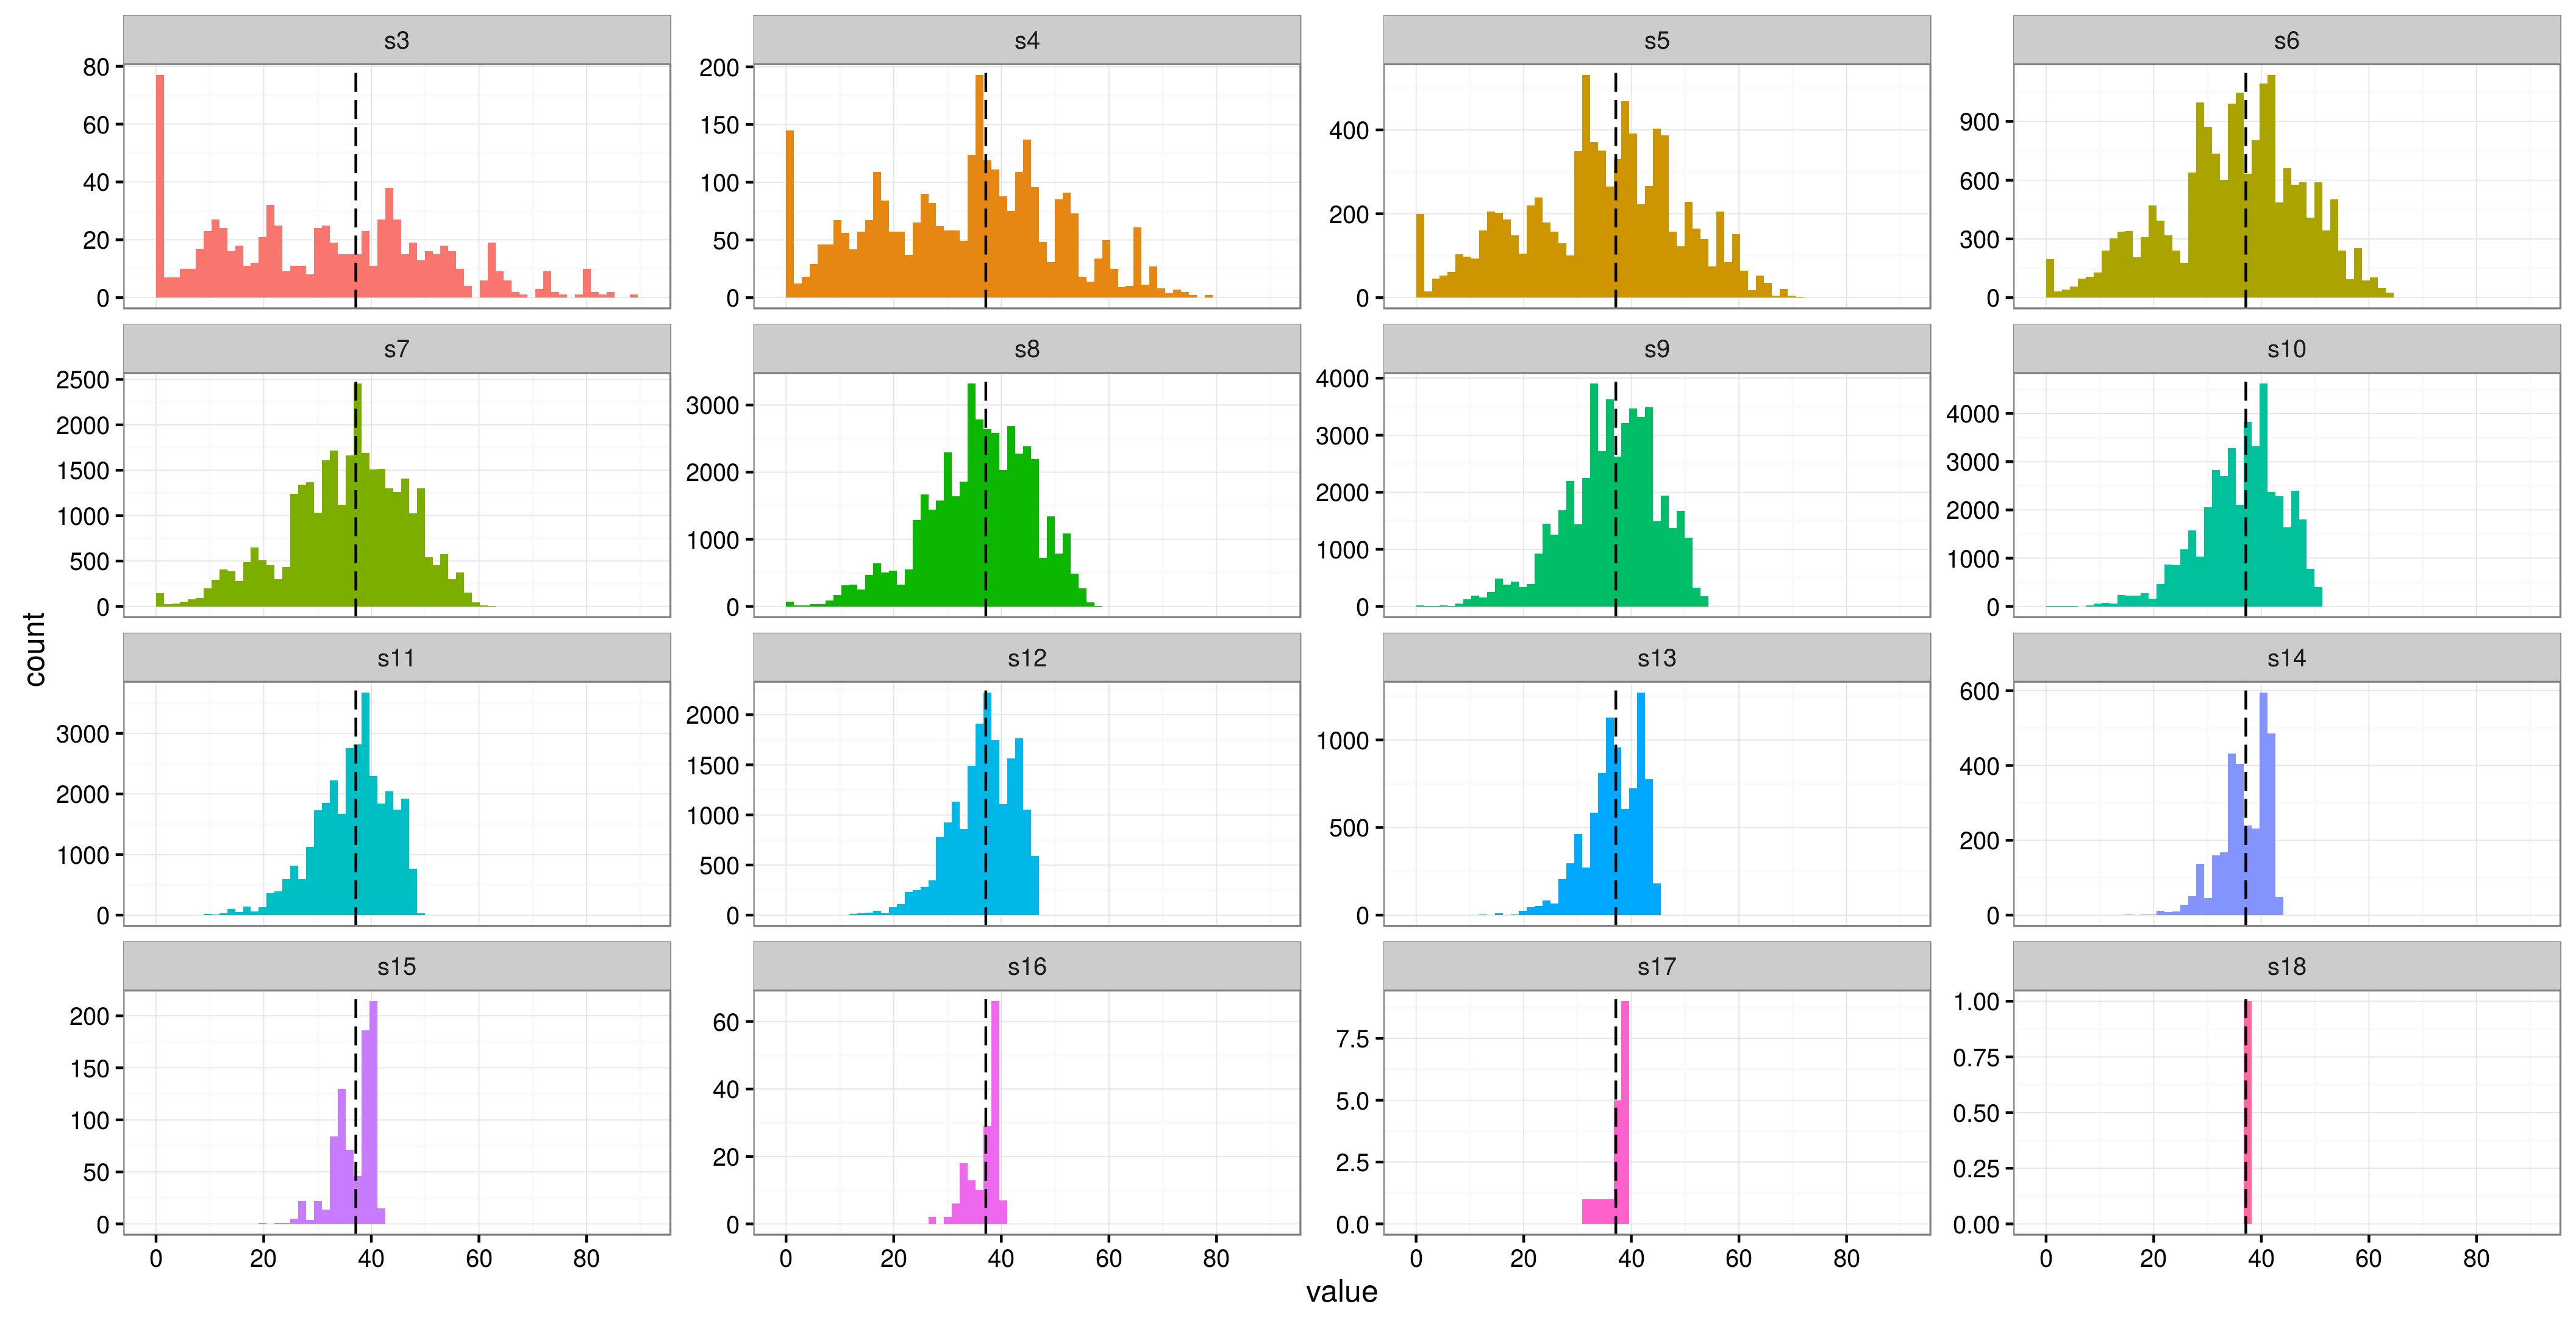
library(lme4) library(ggplot2) library(tidyr) m0 <- lmer(Reaction ~ Days + (1|Subject), data = sleepstudy, control = lmerControl(optimizer = "nloptwrap")) # set the number of factor levels ngroups <- 3:18 # generate all possible combinations combos <- lapply(X = ngroups, FUN = function(x) combn(unique(sleepstudy$Subject), x)) # allocate output (sorry, this code is entirely un-optimized) out <- list(matrix(NA, ncol(combos[[1]]), 1), matrix(NA, ncol(combos[[2]]), 1), matrix(NA, ncol(combos[[3]]), 1), matrix(NA, ncol(combos[[4]]), 1), matrix(NA, ncol(combos[[5]]), 1), matrix(NA, ncol(combos[[6]]), 1), matrix(NA, ncol(combos[[7]]), 1), matrix(NA, ncol(combos[[8]]), 1), matrix(NA, ncol(combos[[9]]), 1), matrix(NA, ncol(combos[[10]]), 1), matrix(NA, ncol(combos[[11]]), 1), matrix(NA, ncol(combos[[12]]), 1), matrix(NA, ncol(combos[[13]]), 1), matrix(NA, ncol(combos[[14]]), 1), matrix(NA, ncol(combos[[15]]), 1), matrix(NA, ncol(combos[[16]]), 1)) # took ~ 2.5 hrs on my laptop, commented out for safety #system.time(for(ii in 1:length(combos)) { # for(jj in 1:ncol(combos[[ii]])) { # sls <- sleepstudy[sleepstudy$Subject %in% combos[[ii]][,jj],] # out[[ii]][jj] <- attr(VarCorr(update(m0, data = sls))$Subject, 'stddev') # } # }) # pad with zeros, not all were equal # from http://stackoverflow.com/questions/11148429/r-convert-asymmetric-list-to-matrix-number-of-elements-in-each-sub-list-diffe max.len <- max(sapply(out, length)) corrected.list <- lapply(out, function(x) {c(x, rep(NA, max.len - length(x)))}) mat <- do.call(rbind, corrected.list) mat <- data.frame(t(mat)) names(mat) <- paste0('s',3:18) mat <- gather(mat, run, value) ggplot(mat, aes(x = value, fill = run)) + geom_histogram(bins = 60) + geom_vline(xintercept = 37.12, linetype = 'longdash', aes(colour = 'original')) + facet_wrap(~run, scales = 'free_y') + scale_x_continuous(breaks = seq(0, 100, by = 20)) + theme_bw() + guides(fill = FALSE)
library(lme4) library(ggplot2) library(tidyr) m0 <- lmer(Reaction ~ Days + (1|Subject), data = sleepstudy, control = lmerControl(optimizer = "nloptwrap")) # set the number of factor levels ngroups <- 3:18 # generate all possible combinations combos <- lapply(X = ngroups, FUN = function(x) combn(unique(sleepstudy$Subject), x)) # allocate output (sorry, this code is entirely un-optimized) out <- list(matrix(NA, ncol(combos[[1]]), 1), matrix(NA, ncol(combos[[2]]), 1), matrix(NA, ncol(combos[[3]]), 1), matrix(NA, ncol(combos[[4]]), 1), matrix(NA, ncol(combos[[5]]), 1), matrix(NA, ncol(combos[[6]]), 1), matrix(NA, ncol(combos[[7]]), 1), matrix(NA, ncol(combos[[8]]), 1), matrix(NA, ncol(combos[[9]]), 1), matrix(NA, ncol(combos[[10]]), 1), matrix(NA, ncol(combos[[11]]), 1), matrix(NA, ncol(combos[[12]]), 1), matrix(NA, ncol(combos[[13]]), 1), matrix(NA, ncol(combos[[14]]), 1), matrix(NA, ncol(combos[[15]]), 1), matrix(NA, ncol(combos[[16]]), 1)) # took ~ 2.5 hrs on my laptop, commented out for safety #system.time(for(ii in 1:length(combos)) { # for(jj in 1:ncol(combos[[ii]])) { # sls <- sleepstudy[sleepstudy$Subject %in% combos[[ii]][,jj],] # out[[ii]][jj] <- attr(VarCorr(update(m0, data = sls))$Subject, 'stddev') # } # }) # pad with zeros, not all were equal # from http://stackoverflow.com/questions/11148429/r-convert-asymmetric-list-to-matrix-number-of-elements-in-each-sub-list-diffe max.len <- max(sapply(out, length)) corrected.list <- lapply(out, function(x) {c(x, rep(NA, max.len - length(x)))}) mat <- do.call(rbind, corrected.list) mat <- data.frame(t(mat)) names(mat) <- paste0('s',3:18) mat <- gather(mat, run, value) ggplot(mat, aes(x = value, fill = run)) + geom_histogram(bins = 60) + geom_vline(xintercept = 37.12, linetype = 'longdash', aes(colour = 'original')) + facet_wrap(~run, scales = 'free_y') + scale_x_continuous(breaks = seq(0, 100, by = 20)) + theme_bw() + guides(fill = FALSE)
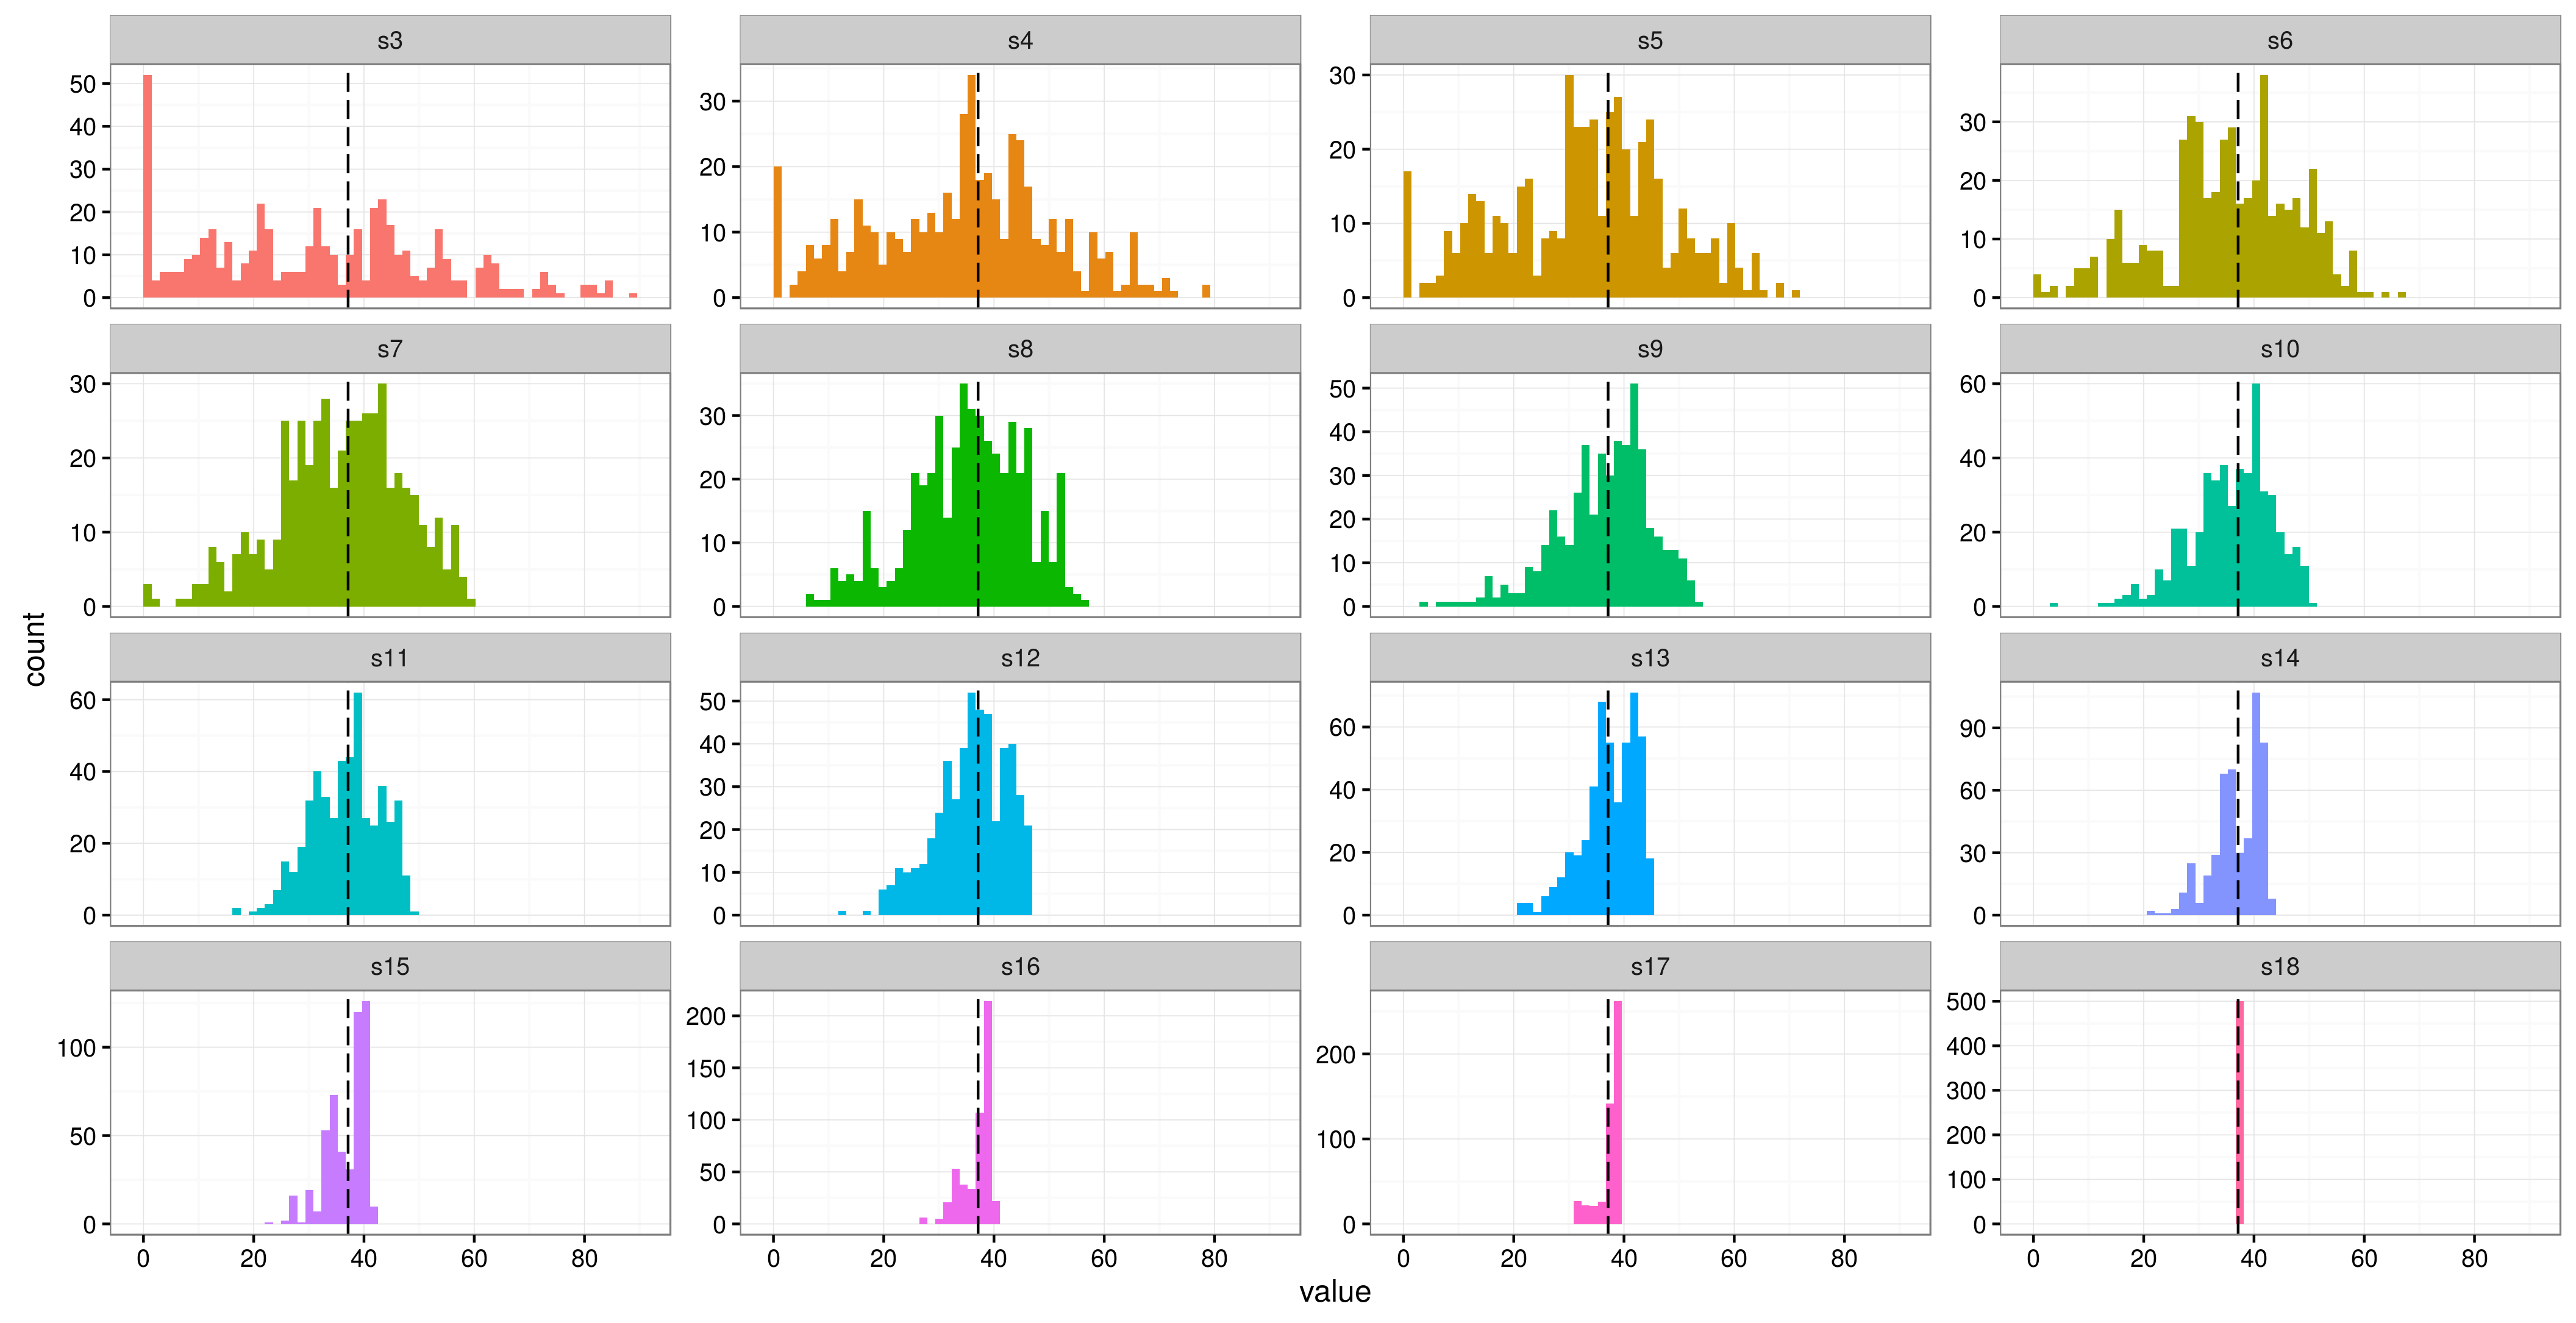
ngroups <- 3:18 reps <- 500 out2<- matrix(NA, length(ngroups), reps) for (ii in 1:length(ngroups)) { for(j in 1:reps) { sls <- sleepstudy[sleepstudy$Subject %in% sample(unique(sleepstudy$Subject), ngroups[i], replace = FALSE),] out2[i,j] <- attr(VarCorr(update(m0, data = sls))$Subject, 'stddev') } } out2 <- data.frame(t(out2)) names(out2) <- paste0('s',3:18) out2 <- gather(out2, run, value) ggplot(out2, aes(x = value, fill = run)) + geom_histogram(bins = 60) + geom_vline(xintercept = 37.12, linetype = 'longdash', aes(colour = 'original')) + facet_wrap(~run, scales = 'free_y') + scale_x_continuous(breaks = seq(0, 100, by = 20)) + theme_bw() + guides(fill = FALSE)
ngroups <- 3:18 reps <- 500 out2<- matrix(NA, length(ngroups), reps) for (ii in 1:length(ngroups)) { for(j in 1:reps) { sls <- sleepstudy[sleepstudy$Subject %in% sample(unique(sleepstudy$Subject), ngroups[i], replace = FALSE),] out2[i,j] <- attr(VarCorr(update(m0, data = sls))$Subject, 'stddev') } } out2 <- data.frame(t(out2)) names(out2) <- paste0('s',3:18) out2 <- gather(out2, run, value) ggplot(out2, aes(x = value, fill = run)) + geom_histogram(bins = 60) + geom_vline(xintercept = 37.12, linetype = 'longdash', aes(colour = 'original')) + facet_wrap(~run, scales = 'free_y') + scale_x_continuous(breaks = seq(0, 100, by = 20)) + theme_bw() + guides(fill = FALSE)