Gold Price Action Analysis – Key Resistance and Support Zones This chart provides an in-depth analysis of Gold (XAU/USD), highlighting critical support and resistance levels. The Key Resistance at 5,581.992 USD is a major hurdle where the price could face rejection. The Intermediate Resistance at 5,371.235 USD marks a potential point for price reversal or continuation. The Current Market Price at 5,092.321 USD is an active level to watch for any breakout or reversal On the downside, Critical Support at 4,853.462 USD is a key level where the price might find support and reverse, while Major Support at 4,565.089 USD is a strong level to keep an eye on for potential bullish reactions. The Upward Trend Channel indicates overall bullish market momentum, suggesting the possibility of continued upward movement. Traders should monitor these levels for potential price action and adjust their strategies accordingly
Community ideas

BTCUSDT Ascending Channel Holds - Bulls in ControlHello traders! Here’s my technical outlook based on the current BTCUSDT (3H) chart structure. BTC previously traded inside a range before breaking above it, confirming a shift to bullish momentum. After the breakout, price formed an ascending channel with higher highs and higher lows, respecting both the support and resistance boundaries. Currently, BTC faced rejection from the 73,000 resistance (seller zone) and pulled back toward the 68,800 support (buyer zone), where price already showed a bounce, aligning with the ascending trend line. As long as price holds above 68,800 and stays within the ascending structure, the bullish bias remains valid. A continuation from this support could push BTC back toward the 73,000 resistance (TP1). However, if price breaks below 68,800, the bullish scenario would weaken and a deeper correction could follow. Please share this idea with your friends and click Boost 🚀

EURUSD Analysis | Risk-Off + Hawkish Fed Boosts USD!Hey Traders, In today’s trading session, we are monitoring EURUSD for a selling opportunity around the 1.15250 zone. EURUSD is currently trading in a downtrend and is undergoing a corrective phase, approaching a key trendline confluence and the 1.15250 support–resistance area. This level could act as a strong reaction zone where sellers may step back in and continue the broader bearish structure. From a fundamental perspective, the US Dollar remains supported following the recent FOMC, where the Federal Reserve maintained a hawkish stance and reduced expectations for near-term rate cuts. In addition, rising geopolitical tensions and elevated oil prices are reinforcing a risk-off environment, increasing demand for the USD as a safe-haven asset. This combination of fewer expected rate cuts, strong USD demand, and global uncertainty could continue to apply downward pressure on EURUSD in the near term. If price shows rejection around this level, we may see continuation toward lower levels in line with the prevailing bearish momentum. As always, wait for confirmation and manage risk carefully. Trade safe, Joe.

BITCOIN - A hunt for liquidity ahead of a drop to $69000BINANCE:BTCUSDT.P was unable to sustain the previous week’s gains and, following weak economic data, entered a distribution phase from 74,000, testing an intermediate low of 69K. A correction is taking shape... The global trend is bearish, with pressure on the market coming from weak U.S. indices and the Fed’s hawkish stance. Bitcoin has failed to confirm its status as a safe-haven asset amid the current tense geopolitical situation. After the sell-off, the price is finding support in the 69,100 zone, confirming the local trend line and forming an additional area of liquidity to which the market may still return A local rebound and correction toward the 72,400 zone are forming. A short squeeze and bears holding the key zone could trigger a move toward the 69,100 support level. Resistance levels: 71,750, 72,400 Support levels: 70,220, 69,100 As part of the correction, the price may test the 71,750–72,400 imbalance zone, while a liquidity squeeze and a false breakout could trigger another sell-off and a drop toward the key support level of 69,100 Sincerely, R. Linda!

USDCHF Weekly / Daily CLS Model 1 New CLS range created and Im looking for Short Model 1 trade setup. As always after the manipulation above the CLS range and reaction from the key level. We need to see confirmation switch from the manipulation phase - CIOD (change in order flow). ⏳ Stay patient and enter only after candle close. 🎯 Target: 50% of the CLS range. 🎥 CLS Model 1 Video Explanation 📚 Bearish CLS Strategy Structure 📈 Don't just follow the idea blindly, Study past Examples • 📈 EURUSD — Daily CLS Model 1 Short • 📈 GBPUSD — Daily CLS Model 1 Short • 📈 USDCHF — Daily CLS Model 1 Long • 📈 BTCUSD — Daily CLS Model 1 Long ⚠️ Note: The strategy is solid, but I’m not perfect. I may miss something or make a mistake that I don’t see at the moment of posting.That’s why proper risk management is always part of the game. 🟣 I promised myself I’d become the person I once needed the most as a beginner. Below are links to a lessons I shared on Tradingview. Hope it can help you avoid years of mistakes, trial and errors I went thru. 📊 Sharpen your trading Strategy ⚙️ 100% Mechanical System - Complete Strategy 🔁 Daily Bias – Continuation 🔄 Daily Bias – Reversal 🧱 Key Level – Order Block 📉 How to Buy Lows and Sell Highs 1️⃣ CLS Model 1 Explanation 2️⃣ CLS Model 2 Explanation ⚡ Order Block Master 🔮 FVG Mastery 💯 Institutional Levels ⏰ 9:30 Strategy 🎯 Dealing Range – Enter on pullbacks 💧 Liquidity – Basics to understand 🕒 Timeframe Alignments 🚫 Market Narratives – Avoid traps 🐢 Turtle Soup Master – High reward method 🧘 How to stop overcomplicating trading 🕰️ Day Trading Cheat Code – Sessions 🇬🇧 London Session Trading 🔍 SMT Divergence – Secret Smart Money signal 📐 Standard Deviations – Predict future targets 🎣 Stop Hunt Trading 💧 Liquidity Sweep Mastery 🔪 Asia Session Setups 📀 Gold Strategy 🧠 Level Up & Mindset 🛕 Monk Mode – Transition from 9–5 to full-time trading ⚠️ Trading Enemies – Habits that destroy success 🔄 Trader’s Routine – Build discipline daily 💪 Get Funded - $20 000 Monthly Plan 🧪 Winning Trading Plan ⭕ Backtesting vs Reality ❌ Don't Fear Being Wrong ✅ Advice For Beginners 🛡️ Risk Management 🏦 Risk Management for Prop Trading 📏 Risk in % or Fixed Position Size 🔐 Risk Per Trade – Keep consistency 🧪 Risk Reward vs Win Ratio 💎 Catch High Risk Reward Setups ☯️ Smart Money - Who control Markets 🔱 Risk Reward vs Win rate ⚠️ CLS Risk Management 💊 Survive Loosing Streak Adapt useful, Reject useless and add what is specifically yours. David Perk

Hellena | GOLD (4H): SHORT to 4600 area.It’s a rather complex situation, but it appears that the price is forming an “ABCDE” triangle. In any case, it seems that the downward movement isn’t quite over yet within the context of the intermediate “C” wave and the higher-order “IV” wave. I think we will soon see the price reach the 4600–4640 range, completing wave “C”. A retest of the 4900 range is possible beforehand. In any case, after such strong movements as those seen in late February, it takes quite a long time for the price to stabilize. Manage your capital correctly and competently! Only enter trades based on reliable patterns!

XAUUSDHello Traders! 👋 What are your thoughts on Gold? Gold has recently confirmed a shift in market structure after breaking below its short-term consolidation and failing to hold above the key resistance zone around 5,200 – 5,300, which aligns with the 0.618 Fibonacci retracement. Price action is now trading below this supply zone, indicating increased bearish pressure. The rejection from this area suggests that sellers remain in control, especially as the market continues to respect a descending channel structure. Currently, price is approaching the 4700i level , which may act as a temporary support. 1- Bearish Scenario If price sustains below the 4700 level, we can expect further downside continuation toward the 4100 level , which also aligns with the lower boundary of the descending channel. This zone becomes the next major target for sellers. 2-Bullish Correction Scenario: A short-term pullback toward the broken support (now resistance) could occur. Any rejection from the 5,000 – 5,100 zone may provide fresh selling opportunities in line with the prevailing trend. A decisive breakdown below 4,700 would likely accelerate bearish momentum toward deeper levels. Please don’t forget to like and share your thoughts in the comments! ❤️

USD/CAD - M30 - Wedge Breakout (20.03.2026)📊 USD/CAD –🔍 Setup Overview, Pattern: Wedg e (ascending / rising wedge), Price is compressing between two trendlines OANDA:USDCAD 📉 Key Zones 🟢 Resistance Zone: ~1.3740 – 1.3750 🔵 Current Price Area: ~1.3720 🔴 1st Support: ~1.3690 🔴 2nd Support: ~1.3670 📊 Market Structure Insight Price making higher highs but tightening range Momentum slowing near resistance Typical rising wedge = bearish bias (possible drop) ⚠️Disclaimer : This analysis is shared for educational and informational purposes only. 👍 If you found this analysis useful, support the idea with a Like and shar e your thoughts in the comments. Charts Don’t Lie — Traders Don’t Quit. 📉

Ethereum | Breakout And Then Long!ETH is cooking up a potential breakout here, which would open for us a good R:R setup. Momentum from buyers seems strong where they are pressuring for proper reversal so that's what we are looking for here! Swallow Academy

Gold Goes Full Niagara in $400 Wipeout. Is It Over & What Next?Gold, you had one job. When the world gets scary, gold OANDA:XAUUSD typically goes up. Wars, inflation, geopolitical mess: gold is supposed to be the adult in the room, the asset that holds its nerve while everything else panics. On Wednesday and Thursday, gold forgot its job entirely, shed nearly $400 in less than 24 hours, and left a lot of traders wondering what just happened. 🌊 The Niagara Drop, Explained The fall did not come from nowhere, even if it felt that way. Gold had been testing a key support zone at $4,970 to $5,000 for several days. Support, for the uninitiated, is a price level where buyers have historically stepped in to stop further declines. Think of it as a floor. When a floor gets tested repeatedly, it eventually either holds or gives way. This one gave way. Once the $4,970 floor cracked, the selling accelerated fast. By early Thursday, gold was printing new lows with nearly every tick, eventually landing at about $4,600 per ounce. A $600-plus move in total from recent highs. 📐 The Chart Was Sending Signals Here is the part that stings a little. The setup was readable, at least in hindsight, and arguably in real time for anyone watching closely. Gold had been travelling inside an ascending channel, a pattern where price moves upward between two parallel rising lines, one acting as support below and one as resistance above. The upper resistance line proved stubborn throughout: it held at $5,096 on February 4, $5,205 on March 4, and $5,238 on March 10. Three rejections at the ceiling, each one a quiet warning that buyers were running out of conviction at the top. When resistance holds that firmly and support starts getting tested at the bottom, the channel is telling you something. If you missed the full 6400 move, the support break alone offered a tradeable $400 leg lower once $4,970 gave in. ☮️ Gold's Identity Crisis Let’s see what the fundamentals are saying. The Iran war escalating further , with oil reserves now taking direct hits, should theoretically have sent gold soaring. Geopolitical shock, supply disruption, market fear: that is the exact environment where gold historically shines as a safe haven asset, meaning a place investors park money when they want safety over returns. Instead, the opposite happened. Traders appear to be selling gold as a highly liquid asset, meaning it is easy to sell quickly at a fair price, to raise cash. The US dollar strengthened as a result, and a stronger dollar typically pushes gold lower since gold is priced in dollars globally. Gold is having something of an identity crisis. The safe haven playbook is not running the way it usually does. 🏦 Powell Pours Cold Water Federal Reserve Chair Jay Powell added another layer on Wednesday, telling reporters that inflation remains a very real threat to the US economy. The Fed kept interest rates unchanged, in one of the higher-impact events on the economic calendar , but the tone was cautious enough to send the dollar higher and gold even lower. The mechanism here is worth understanding. When interest rates stay elevated, fixed-income assets like bonds become attractive because they pay a guaranteed yield. Gold pays nothing. It just sits there looking shiny. So when rates are high, the opportunity cost of holding gold, meaning what you give up by owning it instead of something that pays interest, rises. Higher rates technically equal a stronger dollar and that usually means a less compelling case for gold. Powell just confirmed rates aren’t going anywhere soon. With energy prices surging on the Iran conflict and threatening to keep inflation elevated, analysts are now asking not when the Fed might cut rates, but whether rate cuts are on the table at all. Powell himself flagged the concern: an energy shock layered on top of the tariff shock and the pandemic legacy is precisely the kind of sequence that makes inflation expectations difficult to manage. 🧭 What Comes Next Gold is now trading well below its former support zone, which often becomes resistance on any bounce back up. Watch the $4,970 to $5,000 area closely. On the flip side, the $4,600 to $4,570 range is a nice chance for some much-needed support. If gold tries to recover and stalls there, sellers are back in control. A clean reclaim of that zone would be the first sign that buyers are regrouping. The fundamental picture, rates staying put, dollar staying firm, energy prices staying hot, keeps the pressure on gold for now. The trade that worked for months has shifted. Until the rate narrative changes or the dollar softens, gold's next move is far from the straightforward climb it looked like just a month ago. Off to you : Did you catch the falling prices? Just make sure not to YOLO-FOMO now.

EURUSD Under Pressure Below Key Resistance, Target 1.1390Hello traders! Here’s my technical outlook based on the current EURUSD (4H) chart structure. Price previously moved within an ascending structure before reversing at a key resistance trend line, signaling a shift to bearish momentum. After the drop, the market formed a consolidation range and later broke below it, confirming continued downside pressure. Currently, EURUSD is trading below the descending trend line and inside the seller zone around 1.1540, where price recently showed rejection and weak bullish attempts. As long as price remains below 1.1540 and under the trend line, the bearish bias remains valid. A rejection from this area could push EURUSD toward the 1.1390 support zone (TP1). Please share this idea with your friends and click Boost 🚀

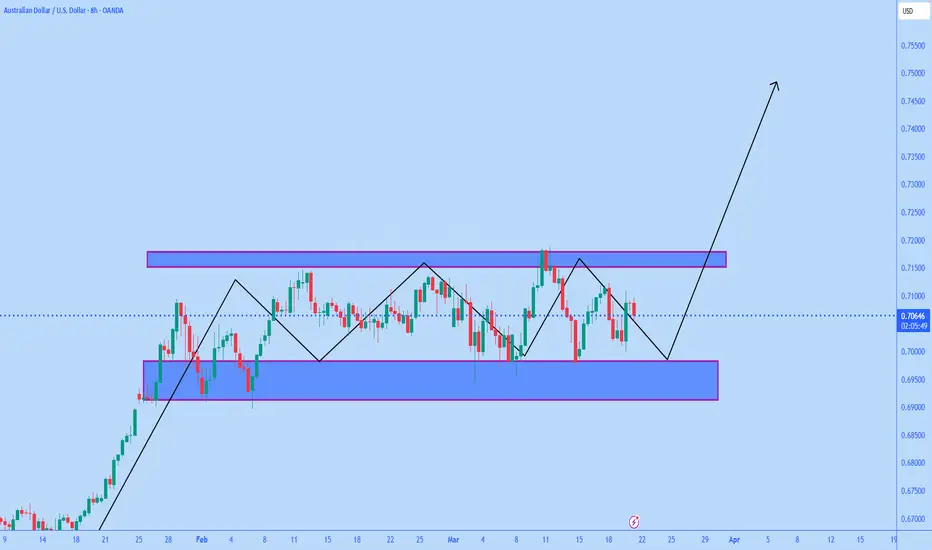
AUDUSD is looking for BreakoutAUDUSD is clearly ranging between strong demand near 0.6950 and supply around 0.7180, with price compressing and forming a liquidity buildup before a potential breakout, and current structure suggests accumulation with higher probability of upside expansion toward 0.7400+ if resistance breaks cleanly. Fundamentally, AUD remains supported by RBA’s hawkish tone and elevated inflation, while the Fed is holding rates steady with concerns over persistent inflation and rising energy prices, keeping USD mixed and allowing AUD strength to build gradually. At the same time, global risk sentiment is unstable due to geopolitical tensions and Middle East developments, which is creating short-term volatility but not invalidating the bullish bias unless price loses the 0.7000 support zone decisively. Overall, I am watching for a clean breakout above the range high to confirm bullish continuation, as liquidity sweep and consolidation indicate a strong expansion move is approaching with smart money positioning for upside.
Silver Analysis Key Support Resistance and Potential Upside Price is currently testing a strong support zone at 1.32579, indicating a potential bounce. The market is breaking out of a falling channel, signaling bullish continuation. Key levels to monitor: 1.34828 (minor resistance/pullback), 1.35706 (resistance zone), 1.36934 (critical resistance for continuation or reversal), and 1.38389 as the top target for potential profit booking. Watch for trendline breakout confirmation and price action within the channel to validate further upside momentum.

XAUUSD: Holding 4,660 Support - Rebound Scenario in FocusHello everyone, here is my breakdown of the current XAUUSD setup. Market Analysis Gold is trading near the 4,660 support zone after a strong move down inside a descending channel. This area previously acted as a demand zone and shows signs of buyer interest, especially after the recent sharp reaction from the lows. Currently, price is attempting to stabilize above support while approaching the 4,810 resistance zone, which aligns with a previous breakout level. My Scenario & Strategy As long as price holds above the 4,660 support, a bullish reversal remains possible. A confirmed bounce from this zone could push gold toward the 4,810 resistance, which is the first upside target. However, if price breaks below 4,660, the bullish scenario would fail and further downside could follow. That’s the setup I’m tracking. Thank you for your attention, and always manage your risk.

NQ Targets (03-20-26)NAZ under KL 520 & 410, unless we get above those two and stay, look Short below.

If a Monk Traded the Markets...I had this thought… What would trading look like if the person behind the screen was a monk? 1️⃣ He wouldn’t feel the need to trade That’s the first thing. He’d just watch the market… and wait. And if nothing is clear? He does nothing. 2️⃣ He wouldn’t take losses personally A losing trade wouldn’t shake him. Not because he’s perfect… but because he’s not attached. He took the trade. He accepted the risk. That’s it. 3️⃣No chasing, no forcing No FOMO. No revenge trades. Just one trade at a time. Clean decision… then reset. 4️⃣Waiting wouldn’t feel hard This is the biggest difference. Most traders wait… but they’re uncomfortable. They’re thinking: “Should I enter?” “Am I missing something?” A monk? He’s just… fine. 5️⃣The edge isn’t the setup It’s how you handle it. Same chart. Same levels. Different mindset. One trader reacts. The other stays calm. If a monk traded… He wouldn’t try to beat the market. He’d just stay in control of himself. Your turn If you removed stress and emotions from your trading… How different would your decisions look? ⚠️ Disclaimer: This is not financial advice. Always do your own research and manage risk properly. 📚 Stick to your trading plan regarding entries, risk, and management. Good luck! 🍀 All Strategies Are Good; If Managed Properly! ~Richard Nasr

Bitcoin: Crash toward $58,000?A support level sits exactly at $68,950. Bitcoin wicked below this level, just briefly, but closed above-it on the same session. This is a failure to break support. Staying above and quickly recovering $70,000; this is an easy one. It shows that buyers were ready, present and more than willing to buy Bitcoin fast below 70K. The proof is in the numbers and the charts. What happens when Bitcoin moves to $76,000 in a flash, retraces just to recover after a few days? You have a full-blown bullish confirmation that reveals additional growth. Naturally, a local bullish trend has already been established based on higher highs and higher lows since $60,000, the 6-February bottom. So many indicators pointed to $60,000 being the low, that it is still pretty hard for me to accept the fact that people think I am crazy just because I've been saying over and over that Bitcoin is going up. "It is unwise to buy/LONG during a bear market." But, what if the bear market reached its end? It is no longer a bear market. The bearish cycle is over. Bitcoin is going up... It is already happening. Look at the price, look at the market, look at the charts. Namaste.

Gold Below 5,000: Macro Pressure or Deeper Downtrend?Hello everyone, Looking at the H4 chart, gold is showing a clear structural shift after decisively breaking below the key psychological level of 5,000 USD and extending its decline toward the 4,650–4,700 zone. This move is accompanied by a sharp increase in volume, suggesting that selling pressure is no longer just a technical pullback but has transitioned into a more aggressive distribution phase. The moving averages have also crossed to the downside and are widening, reinforcing the view that short-term momentum has turned bearish, while recent rebounds appear to be simple retests of nearby resistance. From a macro perspective, the broader backdrop is aligning against gold. The US dollar continues to strengthen, while Treasury yields are pushing higher following more hawkish remarks from the Federal Reserve, particularly from Jerome Powell. This reinforces expectations that interest rates may stay elevated for longer, which directly reduces the appeal of non-yielding assets like gold. What stands out this time is that even with ongoing geopolitical tensions in the Middle East and rising oil prices—factors that would عادة support gold—the market is not responding in the usual way. Instead, it is prioritizing the interest rate narrative and dollar strength, which are currently dominating price action. Another key point is the scale of the recent decline. Gold has dropped more than 900 USD from its recent peak, indicating a broad-based profit-taking phase after an extended rally. When a major uptrend breaks down in this manner, the market typically requires time to rebalance rather than immediately reversing higher. At this stage, the question is no longer whether gold is correcting, but whether the market is transitioning into a deeper, more sustained downtrend—or simply undergoing a necessary reset before the next major move.

GOLD Price Update – Clean & Clear ExplanationGold is currently in a short-term bearish structure after a strong sell-off. Price recently attempted a recovery but is now facing rejection near a key resistance zone, suggesting sellers are still in control. Gold market formed a clear lower highs and lower lows pattern, confirming bearish momentum after the sharp drop, price made a temporary bullish correction, but this move is weak compared to the previous selling pressure. Resistance Zone (Supply Area): Price is reacting from a major resistance around 4720 / 4,740 where sellers previously entered strongly a descending trendline is acting as dynamic resistance, adding extra confirmation for potential downside if price fails to break and hold above resistance, expect continuation downward. “If you come across this post, please like, comment, and share. Thanks!” Sellers may push price toward the marked targets: 🎯 Target 1: ~4,650 🎯 Target 2: ~4,550

Gold After the Crash: Bounce, Not ReversalYesterday was one of those sessions that remind you why Gold is not a market to underestimate. The move was not just bearish — it was aggressively one-sided, designed to do what markets often do best: liquidate positioning and trigger stops. Even from a bearish perspective, which I held , the intensity of the sell-off was beyond what most would reasonably expect. From Recovery to Collapse The session did not start that way. After bouncing from the 4800 zone overnight, Gold pushed higher and reached an intraday high around 4870. At that point, the market looked like it was attempting a normal corrective recovery. But what followed was something entirely different. Over the next several hours, Gold collapsed in a near-continuous move, dropping more than 3500 pips and reaching the 4500 zone. This type of move is rarely about direction alone — it is also about positioning imbalance and forced liquidation. The Reaction From 4500 After such an extreme move, the market did what it often does: It paused… and then recovered sharply. At the time of writing, Gold has already retraced a significant portion of the drop, trading near the 4700 area, almost 2000 pips above the lows. This kind of rebound is not unusual. After aggressive sell-offs, markets tend to mean-revert, at least partially, as volatility resets. The Key Question: Reversal or Stabilization? Naturally, the question now is: Was 4500 the bottom… and are we about to resume the bullish trend? The answer, in my view, requires nuance. On one hand, 4500 could very well act as a temporary bottom. The reaction from that level was strong, and such moves often leave behind a meaningful support zone. But on the other hand, I do not see this as the beginning of a clean bullish continuation toward new highs. At least not in the way many traders might expect. A Shift in Behavior What seems more likely at this stage is a shift from trend into balance. After such a violent move, markets often enter a phase where they oscillate between defined support and resistance, rather than immediately choosing a new direction. In this context: - 4500 becomes a potential support base - The market now starts searching for a ceiling M apping the Resistance The most obvious upper boundary at this point is the 4800 zone, which aligns with prior structure and recent price action. Before reaching 4800 ( if it will ), the market is likely to encounter intermediate resistance levels, particularly: - Just above 4700 - Around the 4750 area These levels may act as temporary barriers, where price can slow down or react before deciding whether to continue higher. Support to Watch On the downside, the most relevant short-term level sits around 4630. As long as the price remains above this area, the current recovery phase can continue. A break below it, however, would suggest that the market is not ready to stabilize yet. Conclusion What we are seeing now is a bounce — not a confirmed trend reversal. - The broader structure remains bearish - The move from 4500 suggests temporary stabilization - The market is entering a range-building phase In other words, the market is no longer trending cleanly. It is searching for balance after a shock — and in such environments, clarity comes not from prediction, but from observing how price reacts at the edges of the range. 🚀

Gold in Times of Global Turmoil I How the Crisis Shaped GoldGold has always been the world's instinctive response to fear. When people lose trust in governments, currencies, or financial systems, they buy gold. The years from 2020 to 2026 gave the world more reasons to be fearful than any period in recent memory — a pandemic, a land war, a global trade war, and an active military conflict in the Middle East. Through all of it, gold responded in a consistent and predictable way. This article traces that journey in plain terms. 1. The COVID-19 Pandemic (2020) When COVID-19 brought the world to a standstill in early 2020. Financial markets panicked, stocks crashed, then gold- despite its safe haven reputation- also dipped initially, falling to $1,451 in March 2020, as investors sold everything just to raise cash. But the real story came after. Governments worldwide unleashed trillions in emergency spending. Central banks slashed interest rates to bare minimum. With much new money flooding the system, every dollar in existence became worth a little less- and gold, which cannot be printed, became worth more. By August 2020, gold had surged to a new all-time high of $2,075. A 43% gain from the panic low in just five months. Gold ended 2020 up 25% for the year- one of its best annual performances in over a decade. ➡ Gold dips in the initial panic. The real surge comes afterwards. 2. The Russia-Ukraine War (2022–2024) Russia's invasion of Ukraine in February 2022 sent gold sharply higher- it briefly touched $2,070 on fear alone. But then something unexpected slowed it down- the US Federal Reserve raised interest rates aggressively to fight post-COVID inflation. Higher rates make bonds attractive, which reduces demand for gold. Despite an active war in Europe, gold fell back to $1,614 by September 2022. What supercharged Gold was de-dollarization because eventually the countries like China, India, Turkey, Poland, and Saudi Arabia began buying gold at record levels to reduce their dependence on the US dollar. This was a structural shift- not short-term fear, but long-term strategy. Gold responded sharply and by October 2024, it had climbed to a new all-time high of $2,790. The year 2024 closed with a 28% annual gain. ➡ Rising interest rates can slow gold even during a war. But when sovereign nations start replacing dollar reserves with gold, it creates a long-term floor under prices. 3. The US-China Trade War (2025) Entering 2025, the US imposed sweeping tariffs on China and other major trading partners- in some cases over 100%. Retaliation followed and Global supply chains, still fragile from COVID, further fractured. Inflation fears returned. Growth forecasts were cut. The US dollar weakened as investors began questioning the stability of the dollar-centric global trading system. For gold, this was a near-perfect environment. Economic uncertainty, a weaker dollar, rising inflation fears, and waning confidence in the existing financial order- all at once. Gold crossed $3,000 in March 2025 for the first time ever and reached $3,500 by April 2025. The trade war added a powerful new leg to an already strong bull market. ➡ Trade wars weaken the dollar and raise inflation fears simultaneously — both are directly positive for gold. 4. The Israel-Iran War (February 2025 – Present) Recently, the Israel-Iran turmoil entered into a direct armed conflict. The impact was immediate and severe. Oil prices surged, adding an energy shock on top of already elevated inflation from the trade war. Middle East instability and concerns about a wider regional conflict added a significant fear premium to gold. Gold entered overdrive. Already at elevated levels from the trade war, it climbed through $4,000, $5,000, and peaked at $5,602 in January 2026- the highest price gold has ever traded at in nominal terms. In roughly one year, gold had risen 113% from the start of 2025. As of mid-March 2026, gold has pulled back to approximately $4,502. A hotter inflationary environment is pushing back expectations for interest rate cuts, causing a short-term correction. This may be entirely normal. Every major gold rally in the discussed time period has included pullbacks along the way- before eventually moving higher. ➡ Wars in oil-producing regions has brought uncertainty in gold too. Higher chances that the current pullback is potentially a correction, not a reversal. What Happens Next? Possible Scenarios The Israel-Iran war is still active. The trade war has not been resolved. Central banks are still buying gold. Interest rates are still expected to fall. Based on how gold has behaved through every crisis in this period, here are the three realistic paths from here: Key Takeaways Six years, four crises, one consistent story. Every time the world has been shaken- by a pandemic, by war, by trade conflict- gold has ultimately moved higher. The current pullback from $5,602 to around $4,502 could be noise, not a long-term trend change. History from this very period shows that gold corrects and then resumes. As long as the underlying conditions remain in place, so does the gold bull market. Disclaimer: This writeup is for informational/educational purposes only- neither from a gold expert nor from a global economist. It does not constitute any financial or investment advice. Always consult a qualified professional before making investment decisions.

Eliana | XAUUSD · 2H – Trendline Breakdown & Bearish ContinuatioPEPPERSTONE:XAUUSD Structure | Trend | Key Reaction Zones Gold has shifted from a bullish structure into a bearish market after breaking key trendline support. Price is now forming lower highs and lower lows, confirming downside continuation. Market Overview The market initially respected an ascending trendline, maintaining bullish structure. However, after reaching the 5400 liquidity zone, price failed to continue higher and started forming weakness. A clear breakdown below the trendline confirmed a change of character (CHoCH), followed by a strong bearish impulse. The previous support zone around 4850–4900 has now flipped into resistance, reinforcing bearish bias. Currently, price is continuing downward momentum, targeting deeper liquidity zones below. This type of structure typically indicates strong institutional selling pressure and continuation toward lower demand zones. Key Scenarios ❌ Bearish Case 📉 Continuation after breakdown. 🎯 Target 1: 4500 🎯 Target 2: 4450 🎯 Target 3: 4400 ✅ Bullish Case 🚀 Reclaim above resistance. 🎯 Target 1: 4900 🎯 Target 2: 5050 Current Levels to Watch Resistance 🔴: 4850 – 4900 Support 🟢: 4450 – 4500 ⚠️ Disclaimer: This analysis is for educational purposes only. Not financial advice.

BTCUSDT Long: Pullback to Support Before Next Move Up To 72,500Hello traders! Here’s my technical outlook based on the current BTCUSDT (4H) chart structure. BTC previously traded inside a descending channel before breaking out and forming a wide consolidation range. After establishing a pivot low, price reversed and started building a bullish structure with higher lows along an ascending trend line, supported by multiple fake breakouts that confirmed buyer strength. Currently, BTC tested the 72,500 resistance (supply zone) and faced rejection, followed by a pullback toward the 69,500 demand zone, which aligns with the rising trend line and previous breakout area. As long as price holds above 69,500 and respects the ascending trend line, the bullish bias remains valid. A bounce from this confluence could push BTC back toward the 72,500 resistance, which is the main upside target. However, if price breaks below 69,500, the bullish structure would weaken and a deeper correction could follow. Manage your risk!
