
Environmental sensing plays a key role in managing air quality, controlling pollution, ensuring factory safety, detecting hazardous gases, and supporting laboratory monitoring. To be effective, such systems must be battery-efficient, lightweight, compact, versatile, and capable of real-time wireless data transmission. While most existing solutions are bulky, this design offers the same functions in a compact multi-gas sensor module.
POC Video Tutorial:
The environmental sensor is designed to record gas data, humidity, and temperature alongside each gas measurement and export it as a CSV file. It includes a sleep mode option, allowing users to set intervals for the device to sleep and wake to collect data, enhancing battery efficiency.
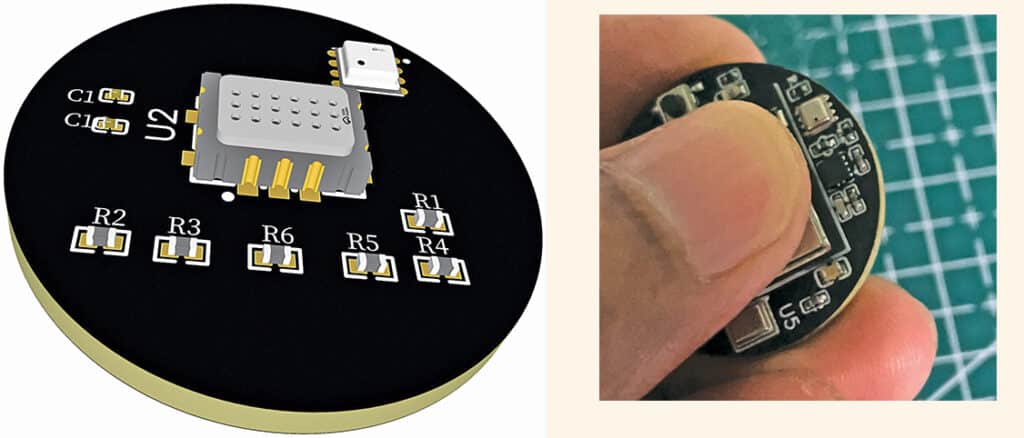
The design incorporates the BME690 (U2) sensor, which provides real-time data on humidity, air pressure, temperature, VOC (volatile organic compound) gas resistance, and an estimated indoor air quality (IAQ) index. While the IAQ is not highly accurate, it meets most environmental monitoring requirements.

Additionally, the MICS-6814 sensor is integrated to measure gases such as CO, NO2, NH3, C3H8, C4H10, CH4, H2, and C2H5OH.

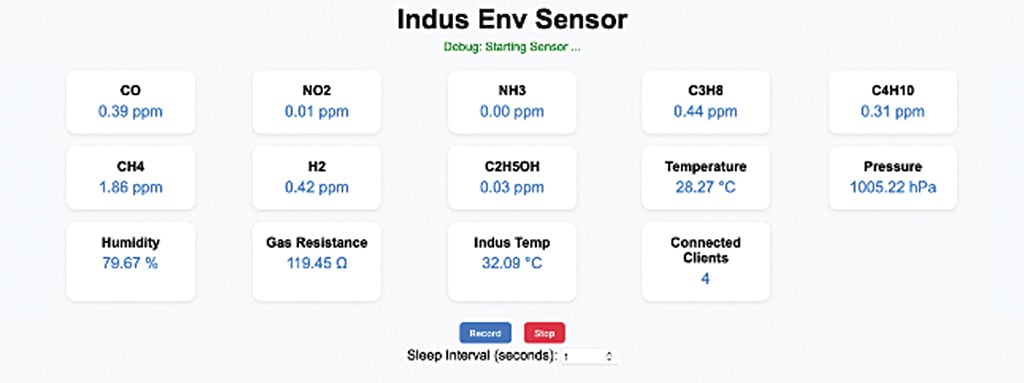
For IoT functionality and data processing, a small but powerful development board, the IndusBoard Coin, is used. An OLED display can be added to display basic environmental data in real time. The FPC (flexible printed circuit) sensor module is designed for seamless integration with the IndusBoard Coin ecosystem, making it compact, reliable, and easy to use. Fig. 1 shows the IoT dashboard of sensor data on the prototype. To build this device, the required components are listed in the Bill of Materials table.

| Bill Of Materials | ||
| Components | Name | Quantity |
| IndusBoard Coin V2 | U1 | 1 |
| BME 690 | U2 | 1 |
| MICS 6814 | U3 | 1 |
| GC9A01/LCD | LCD1 | 1 |
| 24-pin 0.5mm FPC ribbon cable | 1 | |
| Battery 3.3V-3.7V | 1 | |
Code
To begin, install the necessary libraries for the sensors and display. All library files and code can be downloaded by scanning the QR code at the bottom of this article. Copy the libraries to the Arduino library folder. In the code, configure the Wi-Fi SSID and password as required. By default, the Wi-Fi is set to access point (AP) mode, but it can be configured to station (STA) mode to connect to a home or office router, or both modes can be enabled by adjusting the code accordingly. Sensor data is captured and updated on the attached display every second in real time.
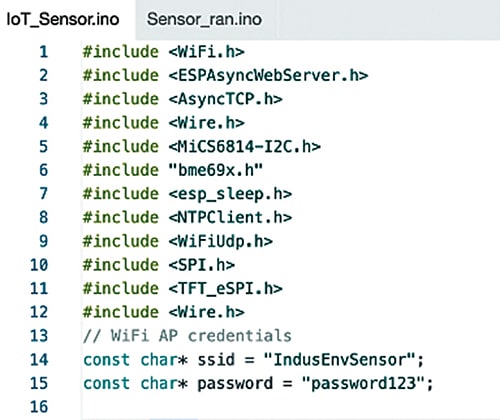
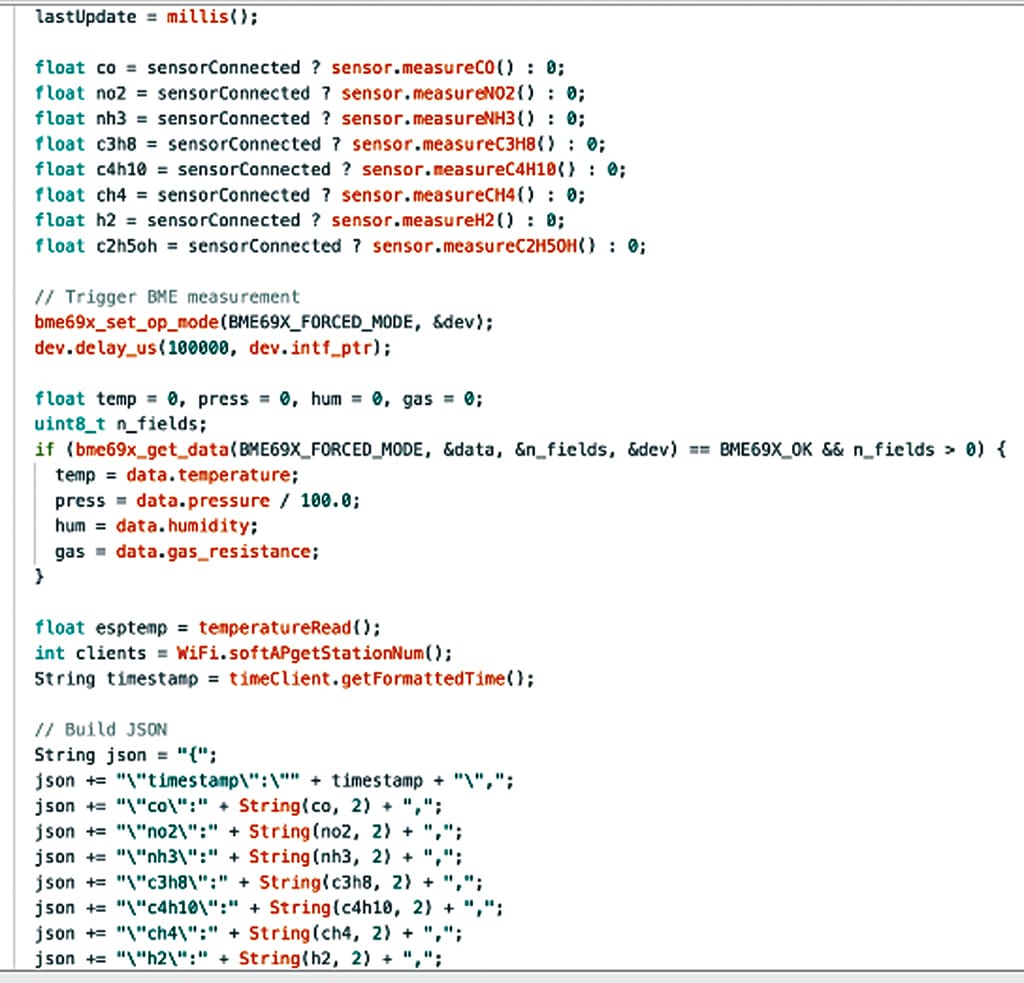
A webpage UI dashboard displays real-time data and allows CSV recording and download. Fig. 2 shows the code snippet that configures the Wi-Fi SSID and password, while Fig. 3 shows the function for updating sensor data in real time. Fig. 4 shows the webpage UI of the monitor sensor.
Circuit Diagram
Fig. 5 shows the circuit diagram of the IoT monitor sensor. It is built around an IndusBoard Coin V2 (U1), BME690 (U2), MICS6814 (U3), GC9A01 LCD (LCD1), and a few other components. A 3.3V or 3.7V battery powers the device. A 24-pin, 0.5mm FPC ribbon cable interconnects the components.
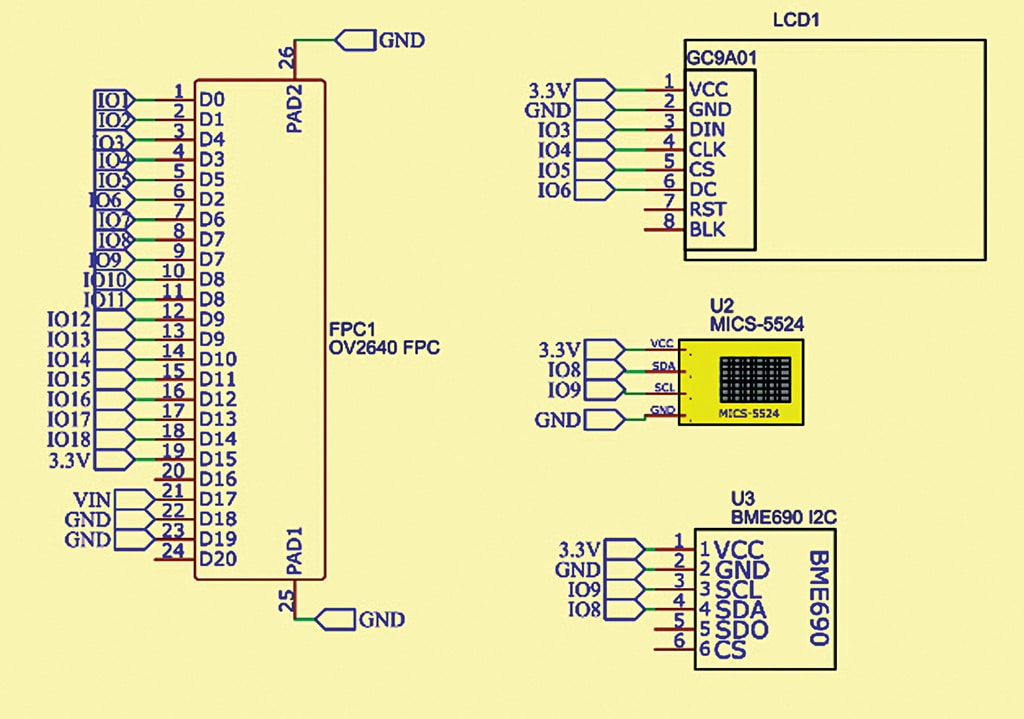
This customised sensor module is designed for easy integration with the IndusBoard Coin but is also compatible with other ESP or similar development boards. The gas and environmental sensors are connected to the I²C pins (default IndusBoard pins 8 and 9), with power supplied via the IndusBoard’s 3.3V pin. The LCD connects via SPI, using pins 3, 4, 5, and 6. The detailed customised sensor module design will be covered in the next part of this series.
PCB Design
The FPC gas and environmental sensor PCB is designed with solder pads on the bottom for connecting the display. All components connect to the IndusBoard Coin V2 via an FPC connector. The sensors and main components are placed on the top layer, while the bottom layer houses the FPC connector and SMD solder pads for the display, as shown in Fig. 6.
Construction and Testing
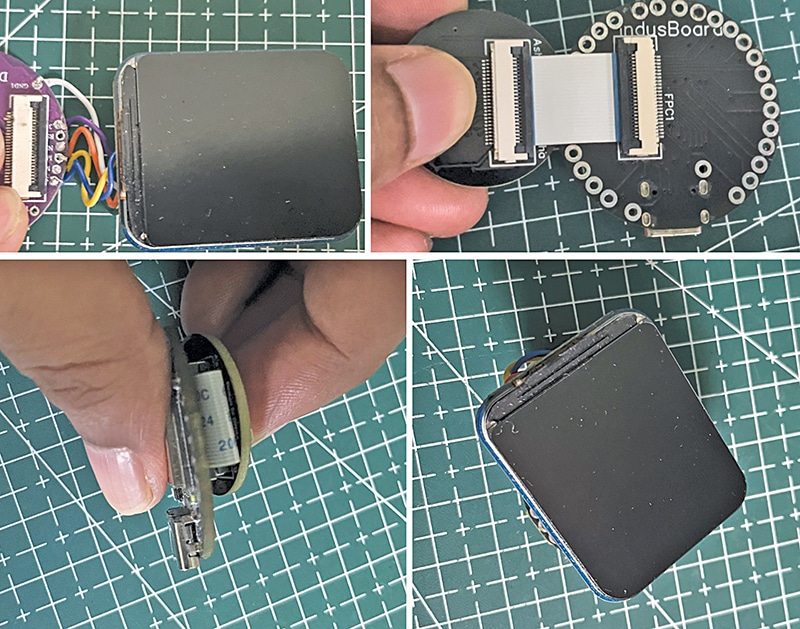
First, upload the source code to the IndusBoard. Next, connect the small-sized 24-pin, 0.5mm FPC ribbon cable to the sensor module. The FPC connector is located on the back of the module, as shown in Fig. 7. Attach the FPC connector to the IndusBoard Coin V2. Solder the display wires to the SMD solder pads on the bottom of the sensor module. Then, connect the FPC connector to both the IndusBoard Coin and the sensor module. Finally, place the sensor module behind the IndusBoard Coin and the display on top of the Coin (see Fig. 8).

For testing, connect a 3.3V or 3.7V battery to the device. The device will begin displaying gas readings on the OLED display. Using the SSID and password set in the code earlier, connect a laptop, smart TV, or smartphone to the device’s Wi-Fi access point (AP). Open a web browser and navigate to 192.168.4.1 to access the wireless IoT dashboard, which displays all gas and environmental sensor data in real time. The dashboard also provides buttons to record the data and save it as a CSV file.