Find the Difference Between Two Rows in Pandas
Last Updated : 23 Jul, 2025
Finding the difference between two rows in Pandas typically involves calculating how values in columns change from one row to the next i.e the difference in sales data from past month to current month. This task is especially important in time-series data or datasets where temporal progression, rankings, or consecutive comparisons matter. It is done using pandas.DataFrame.diff() in pandas, helps to calculate the difference between two consecutive dataframe elements.
Method 1: Using the diff() Method
Syntax:
pandas.DataFrame.diff(periods=1, axis=0)
- periods: Represents periods to shift for computing difference, Integer type value. Default value is 1
- axis: Represents difference to be taken over rown or columns. Can take two values {0: rows, 1: columns}. Default value is 0
Example 1: Finding Difference Between Each Previous Row
Python import pandas as pd data = {'Date': ['2024-11-25', '2024-11-26', '2024-11-27'],'Sales': [200, 250, 300]} df = pd.DataFrame(data) # Calculate difference between rows df['Sales_Diff'] = df['Sales'].diff() print(df) Output:
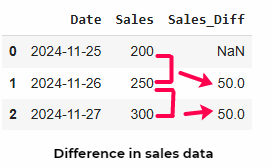 Using pandas.DataFrame.diff()
 This shows how the diff() function calculates the difference between each row and the one preceding it. The ability to calculate differences between rows in a dataset is essential for identifying trends and patterns.
Example 2: Calculating Difference Over Multiple Periods
You can also calculate the difference over multiple periods by adjusting the periods parameter. Useful when you need to compare data points that are not immediately consecutive, such as comparing sales figures over quarterly or yearly intervals.
Python import pandas as pd data = { 'Date': ['2024-11-23', '2024-11-24', '2024-11-25', '2024-11-26', '2024-11-27', '2024-11-28', '2024-11-29'], 'Sales': [180, 190, 200, 250, 300, 350, 400] } df = pd.DataFrame(data) # Calculate the difference with a period of 3 df['sales_diff_3_periods'] = df['Sales'].diff(periods=3) print(df) Output Date Sales sales_diff_3_periods 0 2024-11-23 180 NaN 1 2024-11-24 190 NaN 2 2024-11-25 200 NaN 3 2024-11-26 250 ...
Example 3: Calculating Difference Along Columns in Pandas
The diff() function can also be used to calculate differences along columns by changing the axis parameter. This can be significant in several real-world scenarios, especially in datasets with temporal or categorical columns that represent related measurements. Let's discuss practical use cases with quick examples:
Example : In cases where each column represents a specific time period (e.g., days, months, years), calculating differences along columns helps track changes over time within the same entity. For instance: Comparing sales, revenue, or costs across days, quarters, or years to identify trends.
Python import pandas as pd data = {'Region': ['North', 'South', 'East', 'West'],'Q1_Sales': [20000, 15000, 18000, 22000],'Q2_Sales': [25000, 18000, 20000, 24000], 'Q3_Sales': [30000, 22000, 25000, 26000], 'Q4_Sales': [35000, 25000, 30000, 30000] } df = pd.DataFrame(data) # Calculate the difference in sales across quarters for each region sales_diff = df.loc[:, 'Q1_Sales':].diff(axis=1) df = pd.concat([df, sales_diff.add_prefix('Diff_')], axis=1) print(df) Output Region Q1_Sales Q2_Sales ... Diff_Q2_Sales Diff_Q3_Sales Diff_Q4_Sales 0 North 20000 25000 ... 5000.0 5000.0 5000.0 1 South 15000 18000 ... ...
- Regions like "North" show consistent quarterly growth (+5000 per quarter).
- "West" shows smaller growth between Q1 and Q3 but a larger jump in Q4, suggesting an improvement.
Method 2: Using shift() Method
The shift() method shifts data by a specified number of periods, which can then be used to calculate differences manually. Unlike diff(), shift() provides more control over how data is aligned before calculating differences. This is useful for custom calculations like percentage changes.
Python import pandas as pd data = {'Date': ['2024-11-25', '2024-11-26', '2024-11-27'], 'Sales': [200, 250, 300]} df = pd.DataFrame(data) # Use shift() to calculate differences manually df['Previous_Sales'] = df['Sales'].shift(1) # Shift sales data by 1 period df['Sales_Diff'] = df['Sales'] - df['Previous_Sales'] # Calculate difference print(df) Output Date Sales Previous_Sales Sales_Diff 0 2024-11-25 200 NaN NaN 1 2024-11-26 250 200.0 50.0 2 2024-11-27 300 250.0 50.0
shift() gives you control to align data before performing calculations, allowing custom operations like percentage changes or comparisons across non-adjacent rows. Ideal for scenarios where custom conditions are applied during data manipulation.
Explore
Introduction
Creating Objects
Viewing Data
Selection & Slicing
Operations
Manipulating Data
Grouping Data
Merging, Joining, Concatenating and Comparing
Working with Date and Time
Working With Text Data