Time to Complete: 5 minutes
By visualizing which items are sold most commonly at each store, you can help ensure each store is properly stocked with the items they are most likely to sell out of. A grouped column chart creates a group within the chart for each store location and display columns within each group reflecting the relative sales of each item.
Construct the Chart
Select the dashboard.
From the Dashboards page, select the dashboard where you want to add a new chart. For instructions on setting up a dashboard, see Dashboards.
Add the desired fields to the proper encoding channels.
Drag the
storeLocationfield to the X Axis encoding channel. The X Axis encoding channel dictates which field to use when creating the column groups.Example
X Axis Encoding Channel
Using
storeLocationfor this encoding channel allows us to visualize a group of items per store location.In the Fields section click the
itemsfield to expand theitemsobject and view its properties.Drag the
items.namefield to the Y Axis encoding channel. The Y Axis encoding channel determines which field to use for the chart's aggregation.Example
Y Axis Encoding Channel
Using
items.namefor this encoding channel allows us to aggregate and count the items sold in each location.In the Array Reductions dropdown, select Unwind array.
In the Aggregate dropdown, select count.
Example
Count
The count option counts the occurrences of each item name after unwinding the
itemsarray and displays them in the chart grouped by store location.For more information on the
$countaggregation command, refer to the count aggregation documentation.Drag the
items.namefield to the Series encoding channel.Example
Series Encoding Channel
The Series encoding channel dictates how to split each group of the chart. Each member of the series becomes a column within the group, so each item name becomes a column within the store location group.
In the Series Array Reductions dropdown, select Unwind array.
Your chart should now look something like this:
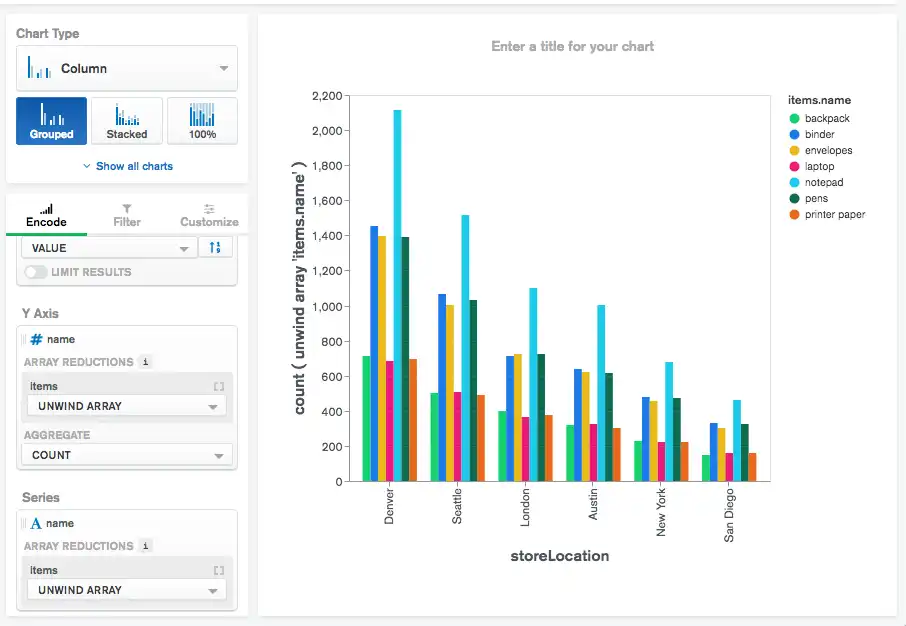
The item sales look to be fairly evenly distributed by store location. Notice based on this chart that notepads are the most common item sold at all store locations, which is useful information when stocking each store with its inventory.
Next Steps
Now that we have a few charts the dashboard is starting to get a bit crowded. Follow along to the next section of the tutorial to see how we can rearrange and resize the charts to make the dashboard easier to digest.