Download to read offline

![International Research Journal of Engineering and Technology (IRJET) e-ISSN: 2395-0056 Volume: 10 Issue: 04 | Apr 2023 www.irjet.net p-ISSN: 2395-0072 © 2023, IRJET | Impact Factor value: 8.226 | ISO 9001:2008 Certified Journal | Page 328 In this case study, we have demonstrated the fundamental procedures needed to use KNN on the Iris dataset, including loading the data, dividing it into training and testing sets, normalizing the data, and finally training and assessing the KNN model. The model performed well on the test set, demonstrating its efficacy in identifying the various kinds of iris blooms. This case study shows the value of data pretreatment and assessment in obtaining accurate and trustworthy results, and it may be used as a valuable reference for people interested in using KNN to solve classification challenges. REFERENCES [1] Fisher, R. A. (1936). The use of multiple measurements in taxonomic problems. Annals of Eugenics, 7(2), 179-188. [2] Anderson, E. (1935). The irises of the Gaspe peninsula. Bulletin of the American Iris Society, 59, 2-5. [3] Scikit-learn documentation: https://scikit- learn.org/stable/modules/generated/sklearn.neighbo rs.KNeighborsClassifier.html [4] Hastie, T., Tibshirani, R., & Friedman, J. (2009). The elements of statistical learning: data mining, inference, and prediction. Springer. [5] Alpaydin, E. (2010). Introduction to machine learning (2nd ed.). MIT Press. [6] Geron, A. (2019). Hands-on machine learning with Scikit-Learn, Keras, and TensorFlow (2nd ed.). O'Reilly Media. [7] Kaggle: https://www.kaggle.com/uciml/iris](https://image.slidesharecdn.com/irjet-v10i447-230610121525-30939343/75/Case-Study-Prediction-on-Iris-Dataset-Using-KNN-Algorithm-4-2048.jpg)

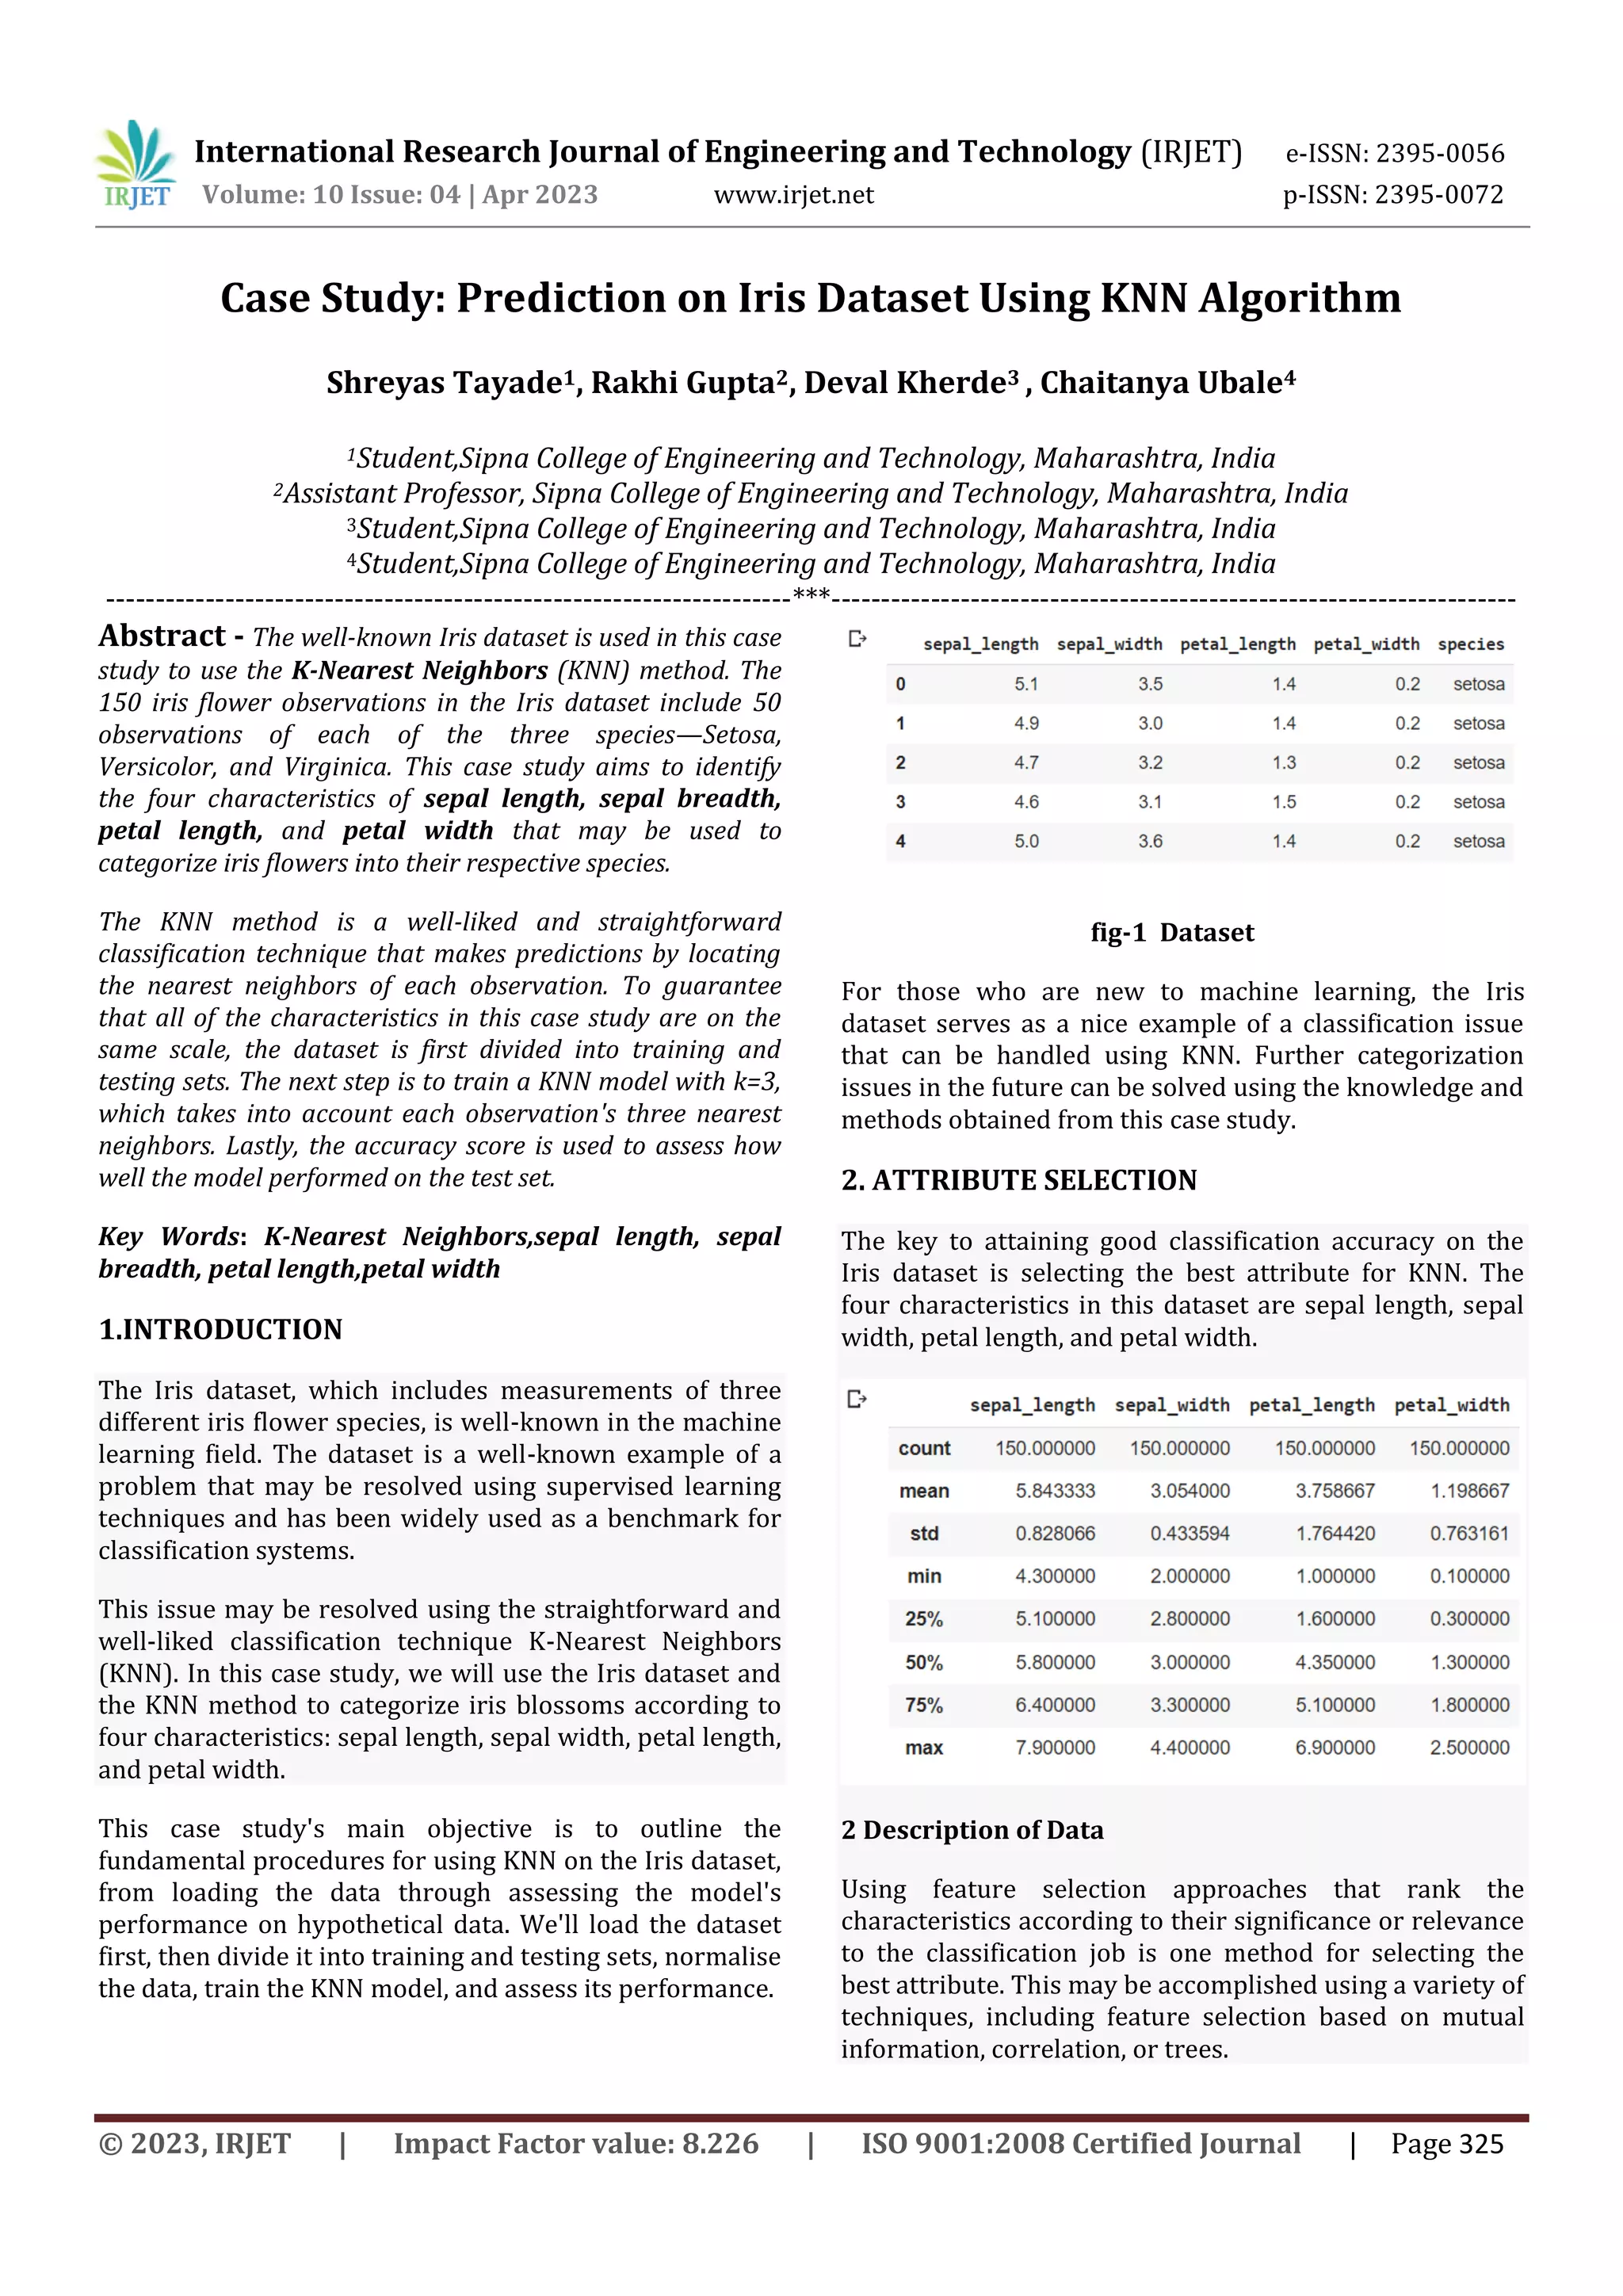
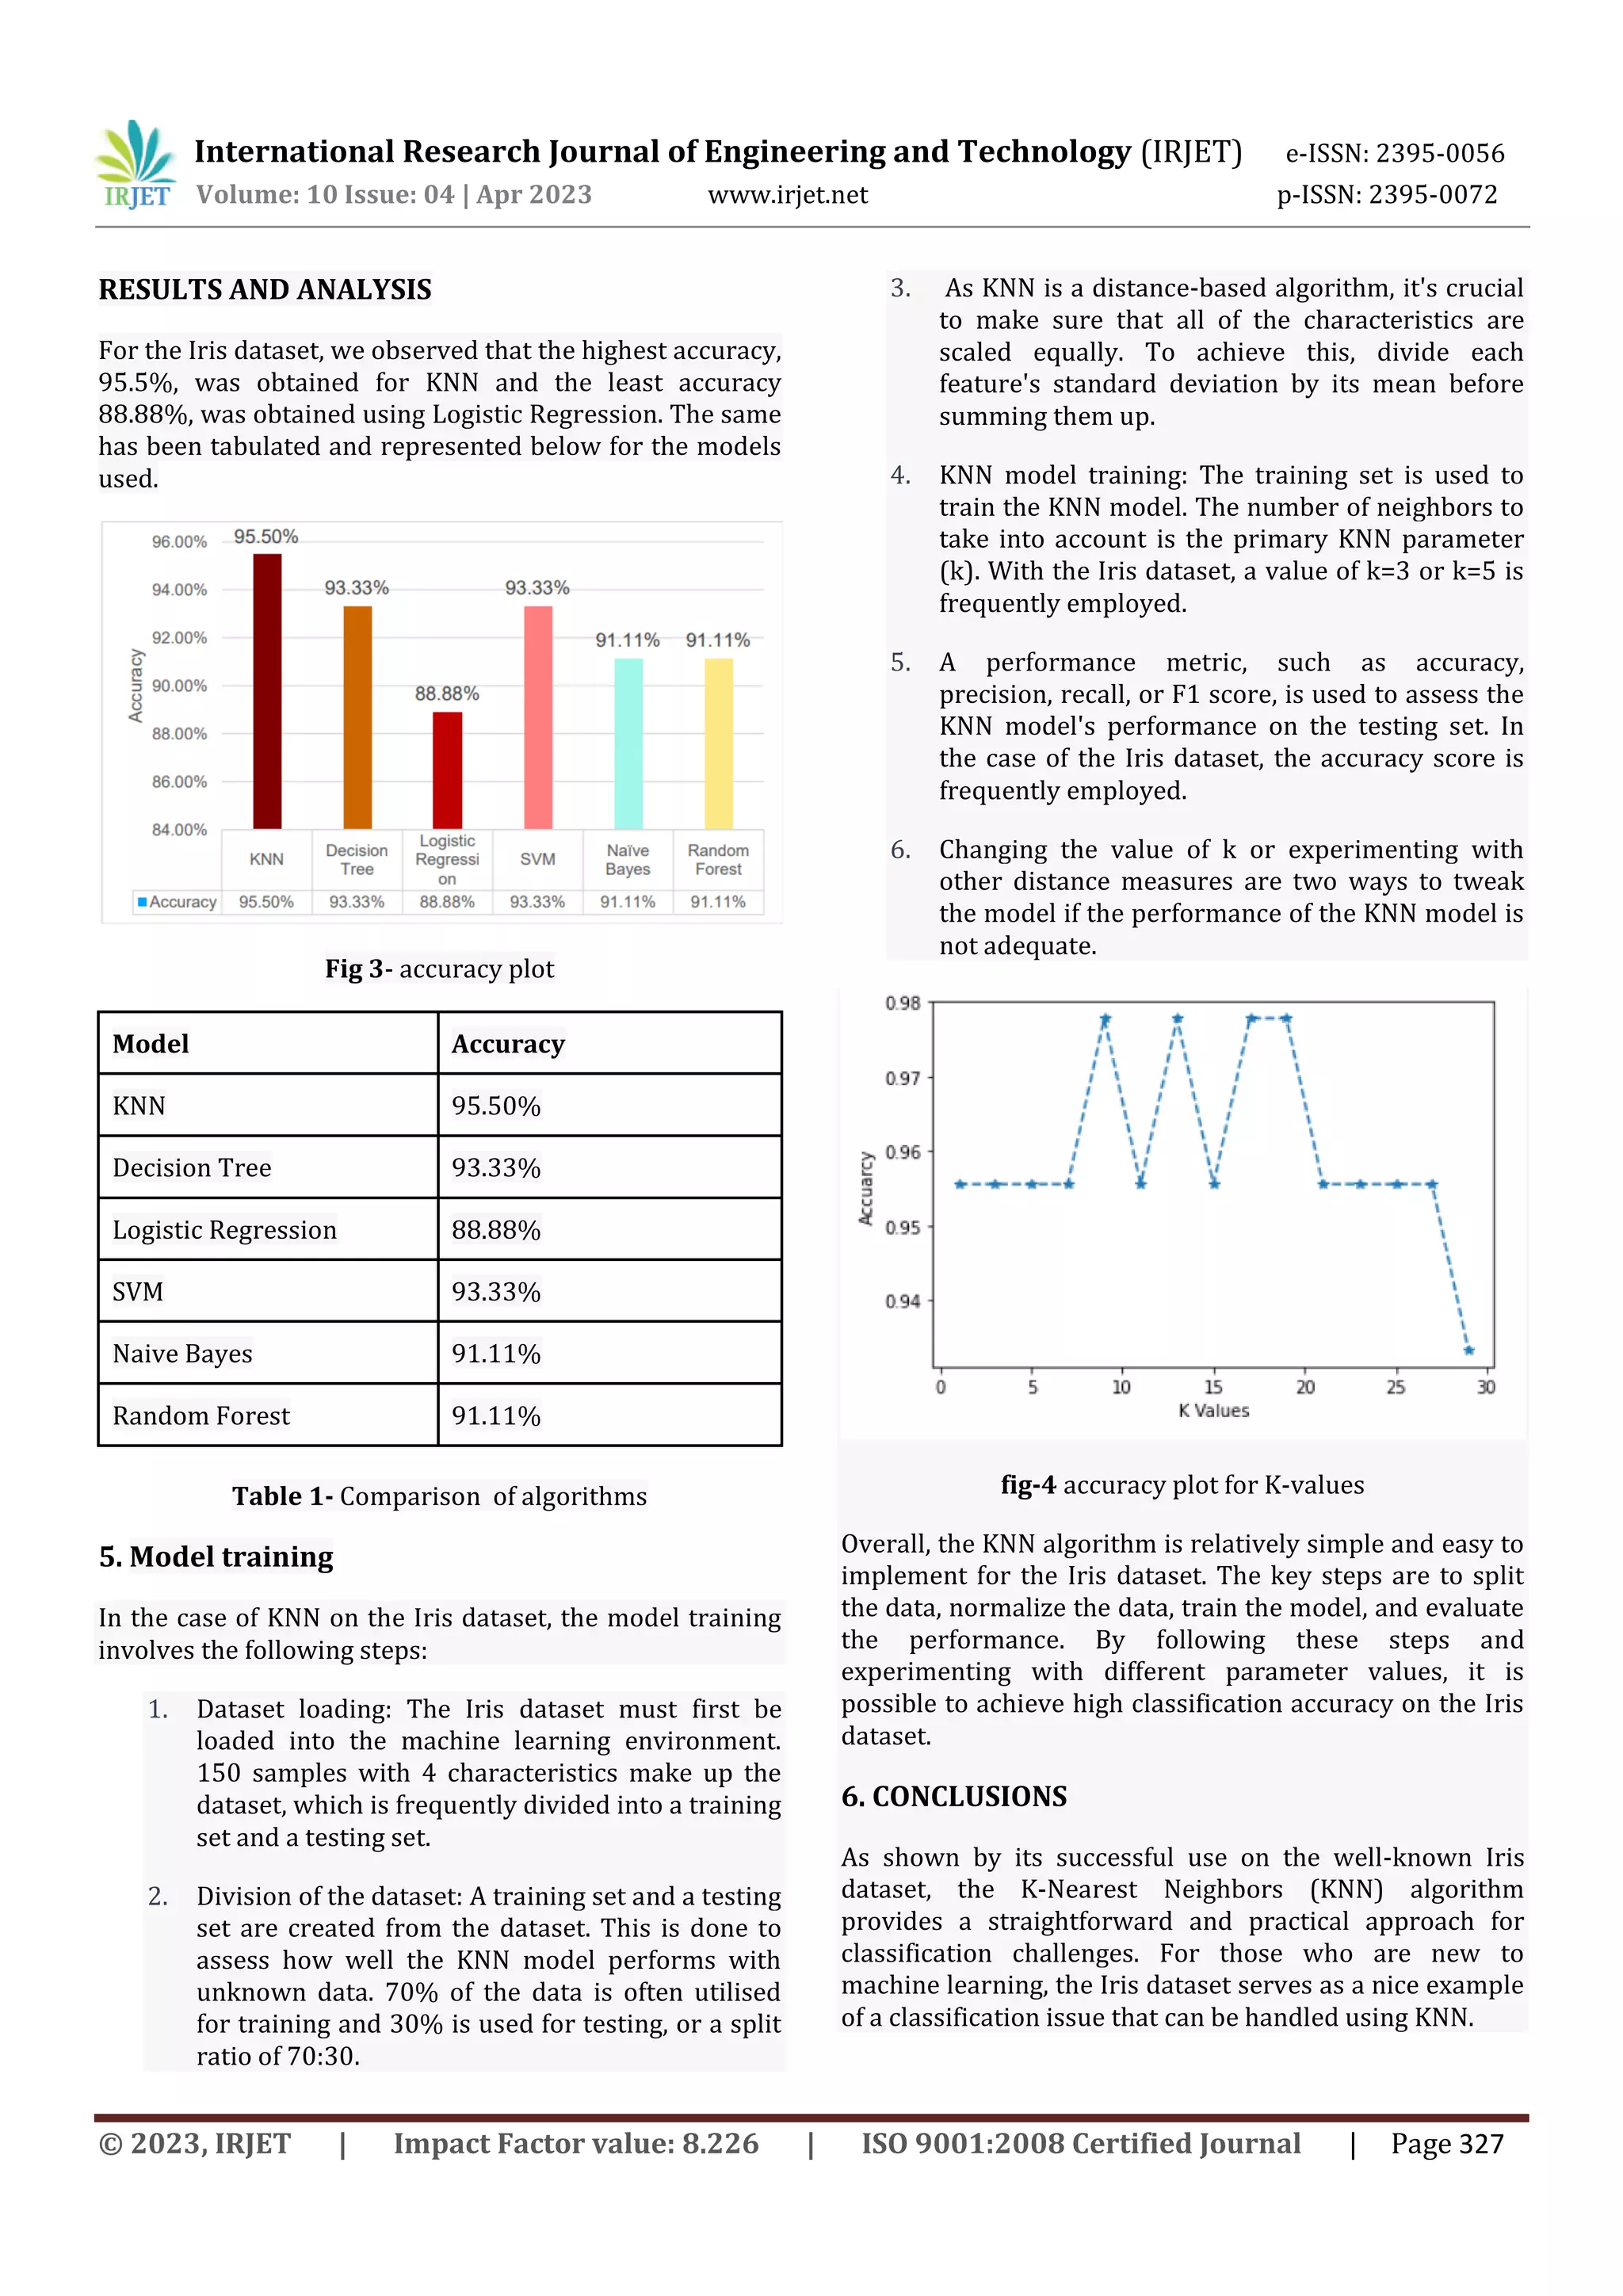
This document summarizes a case study that uses the K-Nearest Neighbors (KNN) machine learning algorithm to classify iris flowers into species using measurements from the well-known Iris dataset. The case study loads the Iris dataset, splits it into training and test sets, trains a KNN model with k=3 neighbors to classify the iris flowers based on their sepal length, sepal width, petal length, and petal width measurements, and evaluates the model's accuracy on the test set. The KNN model achieved an accuracy of 95.5% on this classification task using the Iris dataset.