This document presents a new algorithm for edge detection in images, improving upon traditional RGB methods by transforming images into different color models, specifically YUV, YCbCr, and XYZ. The algorithm measures image quality using Structural Similarity Index (SSIM) and Visual Information Fidelity (VIF), with results indicating that the XYZ color model offers superior edge detection quality compared to others. The findings highlight that converting images into alternate color spaces can significantly enhance the detection and localization of edges for various applications in image processing.
![Abhishek Gudipalli & Ramashri Tirumala International Journal of Image Processing (IJIP), Volume (6) : Issue (5) : 2012 298 2. DIFFERENT COLOR SPACES 2.1 RGB color model In the RGB model, each color appears as a combination of red, green, and blue. This model is called additive, and the colors are called primary colors. The primary colors can be added to produce the secondary colors of light (see Figure "Primary and Secondary Colors for RGB ") - magenta (red plus blue), cyan (green plus blue), and yellow (red plus green). The combination of red, green, and blue at full intensities makes white. The color subspace of interest is a cube shown in Figure "RGB Color Model" (RGB values are normalized to 0..1)[1], in which RGB values are at three corners; cyan, magenta, and yellow are the three other corners, black is at their origin; and white is at the corner farthest from the origin. The gray scale extends from black to white along the diagonal joining these two points. The colors are the points on or inside the cube, defined by vectors extending from the origin. Thus, images in the RGB color model consist of three independent image planes, one for each primary color. The importance of the RGB color model is that it relates very closely to the way that the human eye perceives color. RGB is a basic color model for computer graphics because color displays use red, green, and blue to create the desired color. Therefore, the choice of the RGB color space simplifies the architecture and design of the system. Besides, a system that is designed using the RGB color space can take advantage of a large number of existing software routines, because this color space has been around for a number of years. However, RGB is not very efficient when dealing with real-world images. To generate any color within the RGB color cube, all three RGB components need to be of equal pixel depth and display resolution. Also, any modification of the image requires modification of all three planes[1]. FIGURE 1: RGB Colour model. 2.2 YCbCr and YUV color model In the YCbCr color space is used for component digital video is a scaled and offset version of the YUV color space. The YUV color model is the basic color model used in analogue color TV broadcasting. Initially YUV is the re-coding of RGB for transmission efficiency (minimizing bandwidth) and for downward compatibility with black-and white television. The YUV color space is “derived” from the RGB space. It comprises the luminance (Y) and two color difference (U, V) components. The luminance can be computed as a weighted sum of red, green and blue components; the color difference, or chrominance, components are formed by subtracting luminance from blue and from red. The principal advantage of the YUV model in image processing is decoupling of luminance and color information. The importance of this decoupling is that the luminance component of an image can be processed without affecting its color component. For example, the histogram equalization of the color image in the YUV format may be performed simply by applying histogram equalization to its Y component. There are many combinations of YUV values from nominal ranges that result in invalid RGB values, because the possible RGB colors occupy only part of the YUV space limited by these ranges. For example,](https://image.slidesharecdn.com/ijip-651-160101133856/75/Comprehensive-Infrared-Image-Edge-detection-Algorithm-2-2048.jpg)
![Abhishek Gudipalli & Ramashri Tirumala International Journal of Image Processing (IJIP), Volume (6) : Issue (5) : 2012 299 the histogram equalization of the color image in the YUV format may be performed simply by applying histogram equalization to its Y component. There are many combinations of YUV values from nominal ranges that result in invalid RGB values, because the possible RGB colors occupy only part of the YUV space limited by these ranges. Figure " YUV Color Model" shows the valid color block in the YUV space that corresponds to the RGB color cube RGB values are normalized to [0..1])[1]. The Y’U’V’ notation means that the components are derived from gamma-corrected R’G’B’. Weighted sum of these non-linear components forms a signal representative of luminance that is called luma Y’. (Luma is often loosely referred to as luminance, so you need to be careful to determine whether a particular author assigns a linear or non-linear interpretation to the term luminance)[1].The YCbCr color space is used for component digital video is a scaled and offset version of the YUV color space. The position of the block of RGB-representable colors in the YCbCr space is shown in Figure2.1 RGB Colors Cube in the YCbCr Color Model [1]. Conversion between RGB and YCbCr models: Y’ = 0.257*R' + 0.504*G' + 0.098*B' + 16 Cb' = -0.148*R' - 0.291*G' + 0.439*B' + 128 Cr' = 0.439*R' - 0.368*G' - 0.071*B' + 128 Conversion between RGB and YUV models: Y'= 0.299*R' + 0.587*G' + 0.114*B' U'= -0.147*R' - 0.289*G' + 0.436*B' = 0.492*(B'- Y') V'= 0.615*R' - 0.515*G' - 0.100*B' = 0.877*(R'- Y') FIGURE 2: YCbCr and YUV color models. 2.3 XYZ color model The XYZ color space is an international standard developed by the CIE (Commission Internationale de l’Eclairage). This model is based on three hypothetical primaries, XYZ, and all visible colors can be represented by using only positive values of X, Y, and Z. The CIE XYZ primaries are hypothetical because they do not correspond to any real light wavelengths. The Y primary is intentionally defined to match closely to luminance, while X and Z primaries give color information. The main advantage of the CIE XYZ space (and any color space based on it) is that this space is completely device-independent. The position of the block of RGB-representable colors in the XYZ space is shown in Figure 3 XYZ Color model [1]. Conversion between RGB and XYZ models: X = 0.412453*R’ + 0.35758 *G’ + 0.180423*B’](https://image.slidesharecdn.com/ijip-651-160101133856/75/Comprehensive-Infrared-Image-Edge-detection-Algorithm-3-2048.jpg)
![Abhishek Gudipalli & Ramashri Tirumala International Journal of Image Processing (IJIP), Volume (6) : Issue (5) : 2012 300 Y = 0.212671*R’ + 0.71516 *G’ + 0.072169*B’ Z = 0.019334*R’ + 0.119193*G’ + 0.950227*B’ FIGURE 3: XYZ color model. 2.4 Infrared Imaging Infrared (IR) light is electromagnetic radiation with a wavelength longer than that of visible light, measured from the nominal edge of visible red light at 0.74µm, and extending conventionally to 300µm. These wavelengths correspond to a frequency range of approximately 1 to 400 THz and include most of the thermal radiation emitted by objects near room temperature. Microscopically, IR light is typically emitted or absorbed by molecules when they change their rotational and vibration movements. Infrared imaging is used extensively for military and civilian purposes. Military applications include target acquisition, surveillance, night vision, homing and tracking. Non-military uses include thermal efficiency analysis, environmental monitoring, industrial facility inspections, remote temperature sensing, short-ranged wireless communication, spectroscopy, and weather forecasting[2]. Infrared astronomy uses sensor-equipped telescopes to penetrate dusty regions of space, such as molecular clouds; detect objects such as planets, and to view highly red-shifted objects from the early days of the universe. Humans at normal body temperature radiate chiefly at wavelengths around 12 µm, at the atomic level infrared energy elicits vibration modes in a molecule through a change in the dipole moment, making it a useful frequency range for study of these energy states for molecules of the proper symmetry. Infrared spectroscopy examines absorption and transmission of photons in the infrared energy range, based on their frequency and intensity [2]. 3. EVALUATION METRICS In image processing applications, the measurement of image quality plays main role. Image quality assessment algorithms are classified into three categories: FullReference (FR), Reduced- Reference (RR), and No-Reference (NR) algorithms. True No Reference algorithms are difficult to design and little progress has been made [3]. Full Reference algorithms are easier to design and The SSIM index is a full reference metric. In this, the measurement of image quality is based on reference image of perfect quality. SSIM is designed to improve Peak Signal-to-Noise Ratio (PSNR) and Mean Squared Error (MSE), which is proved to be inconsistent with human eye perception[4]. However, in RR or NR quality assessment, partial or no reference information is available. The SSIM index is defined as[4]: SSIMሺx,yሻ= σxy+C1 σxσy+C1 . 2µx µy + C2 µx 2+µy 2+ C2 . 2σxσy+ C3 σx 2 +σy 2 + C3 Let x an y be the two discrete non-negative signals extracted from the same spatial location from two images being compared, respectivelyߤ௫, ߪ௫ ଶ and ߪ௫௬ be the mean of x ,the variance of x and the covariance of x and y, respectively. ߤ௫ and ߪ௫ gives the information on luminance and contrast of x. ߪ௫௬ measures the structural similarity.where C1, C2 and C3 are small constants given by C1 = (K1 L) 2 ; C2 = (K2 L) 2 and C3 = C2 / 2; respectively. L is the dynamic range of the pixel](https://image.slidesharecdn.com/ijip-651-160101133856/75/Comprehensive-Infrared-Image-Edge-detection-Algorithm-4-2048.jpg)
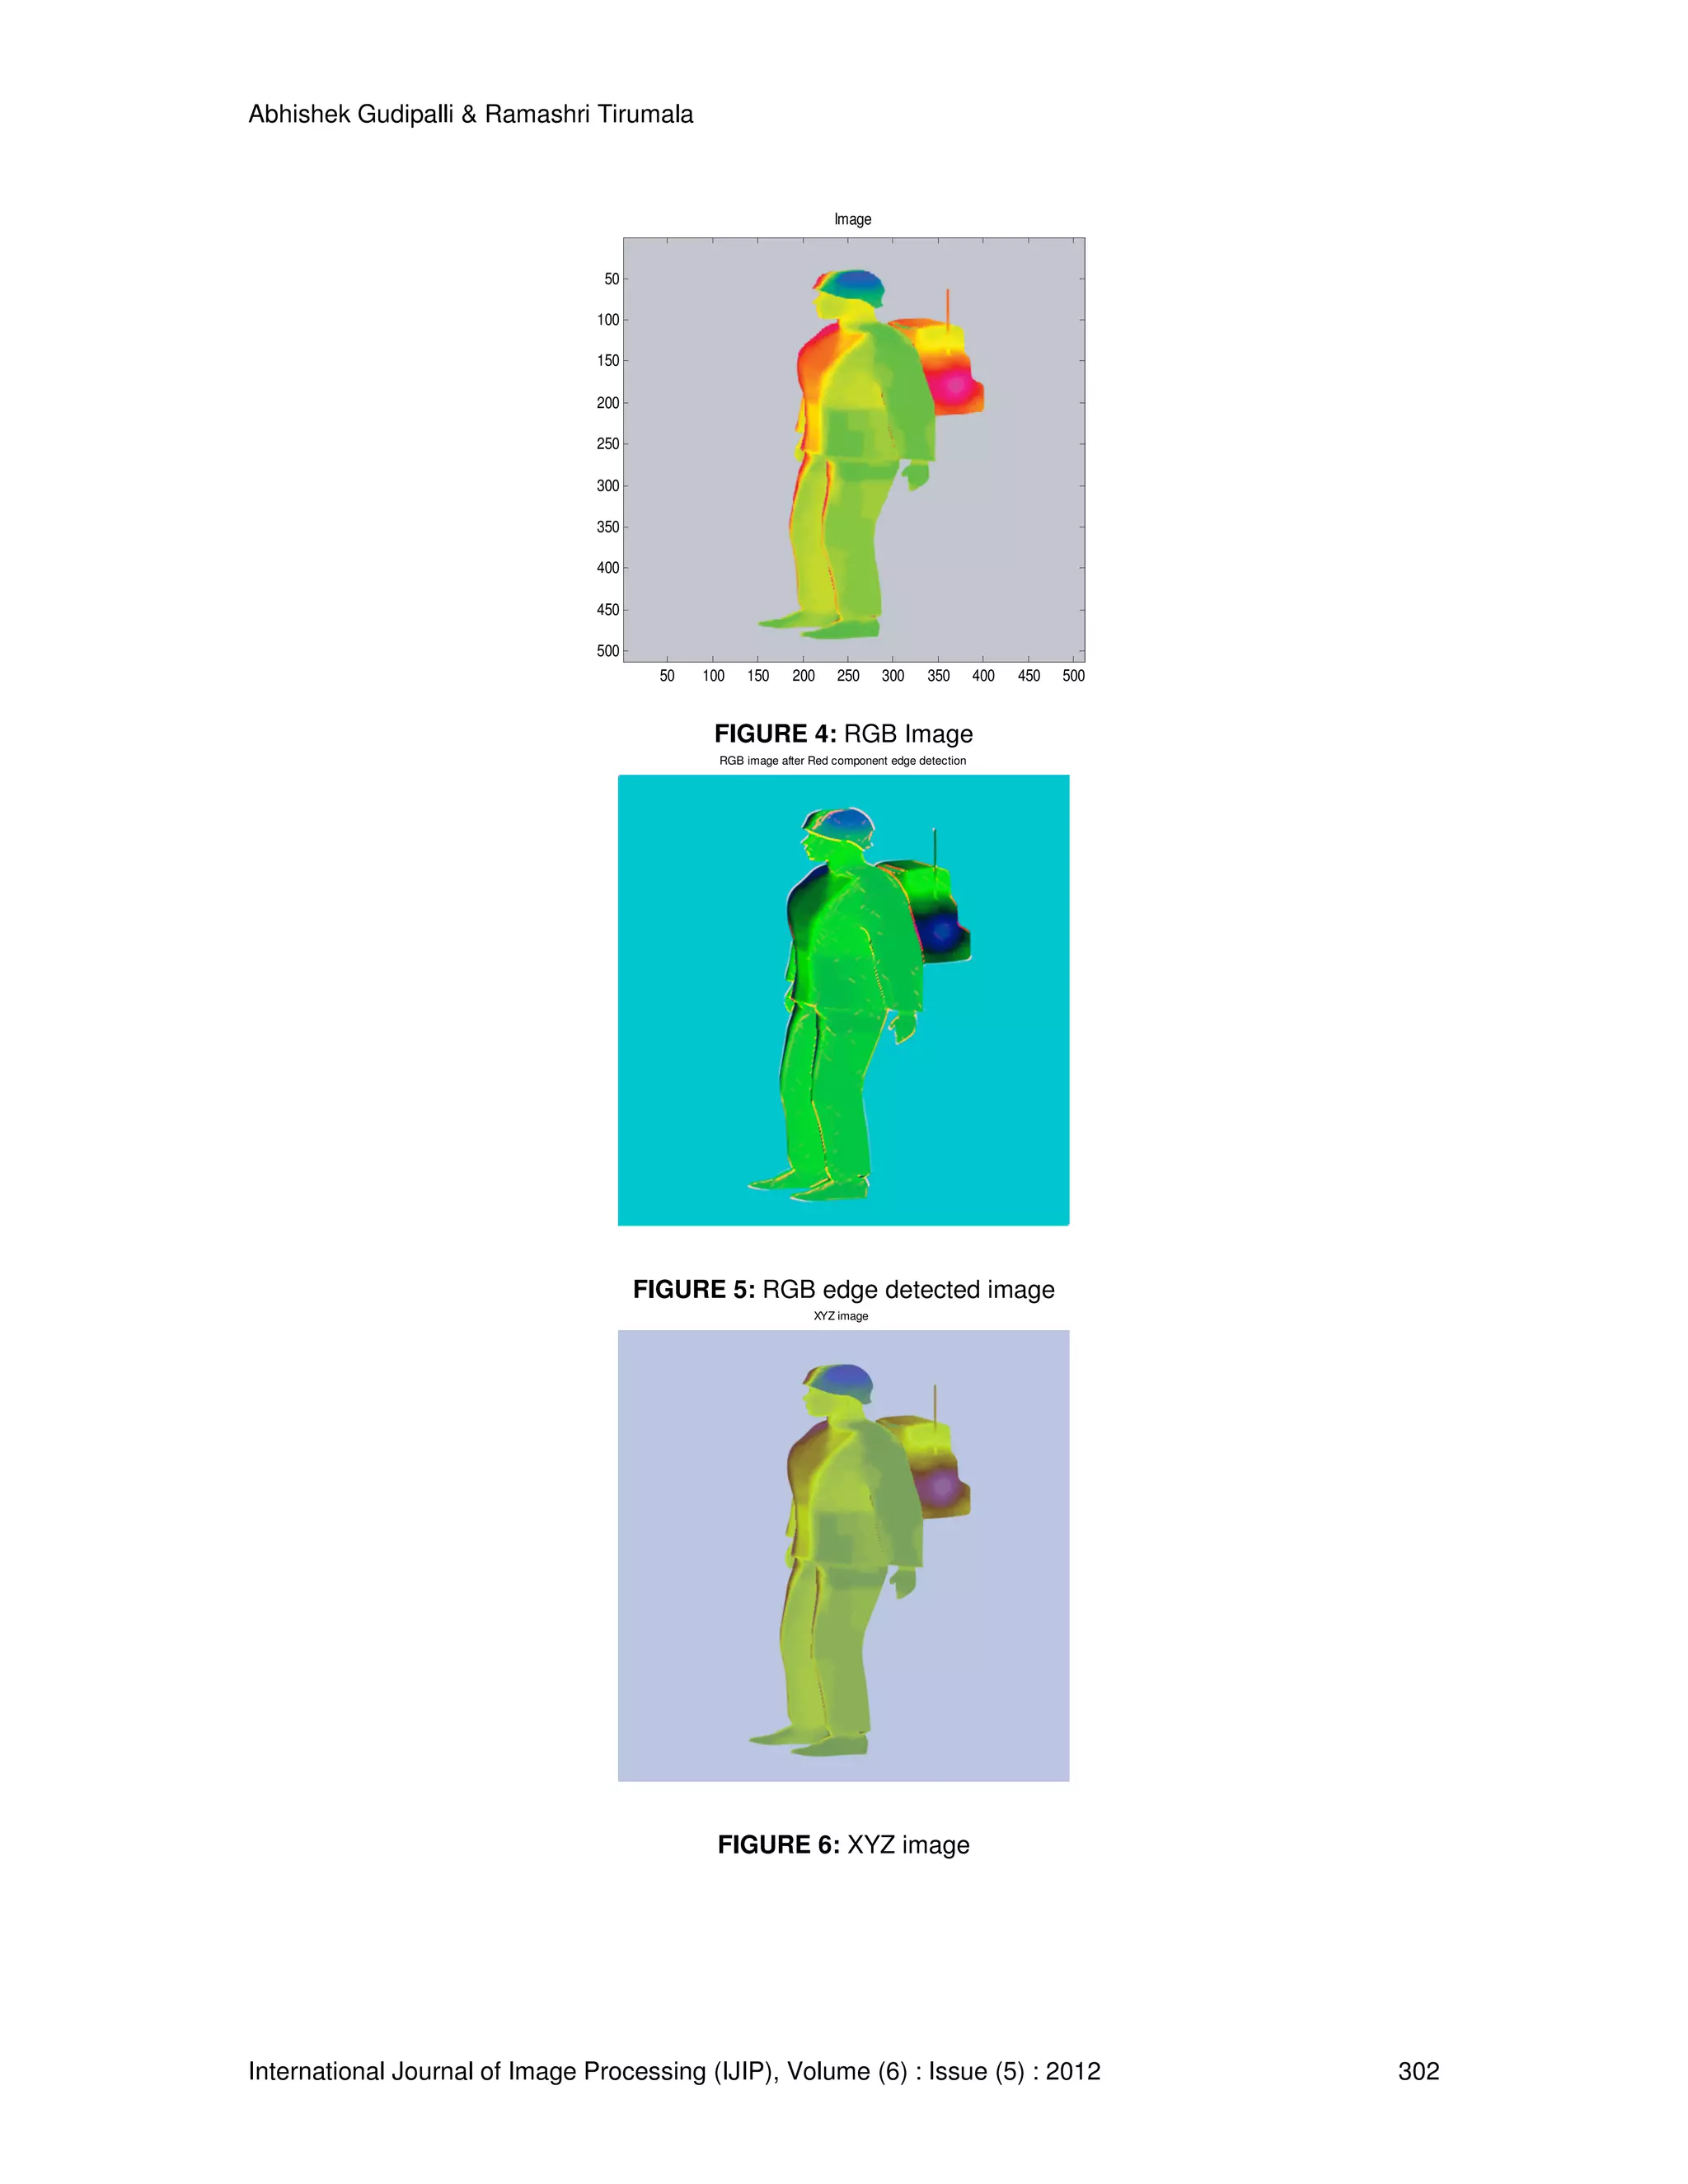
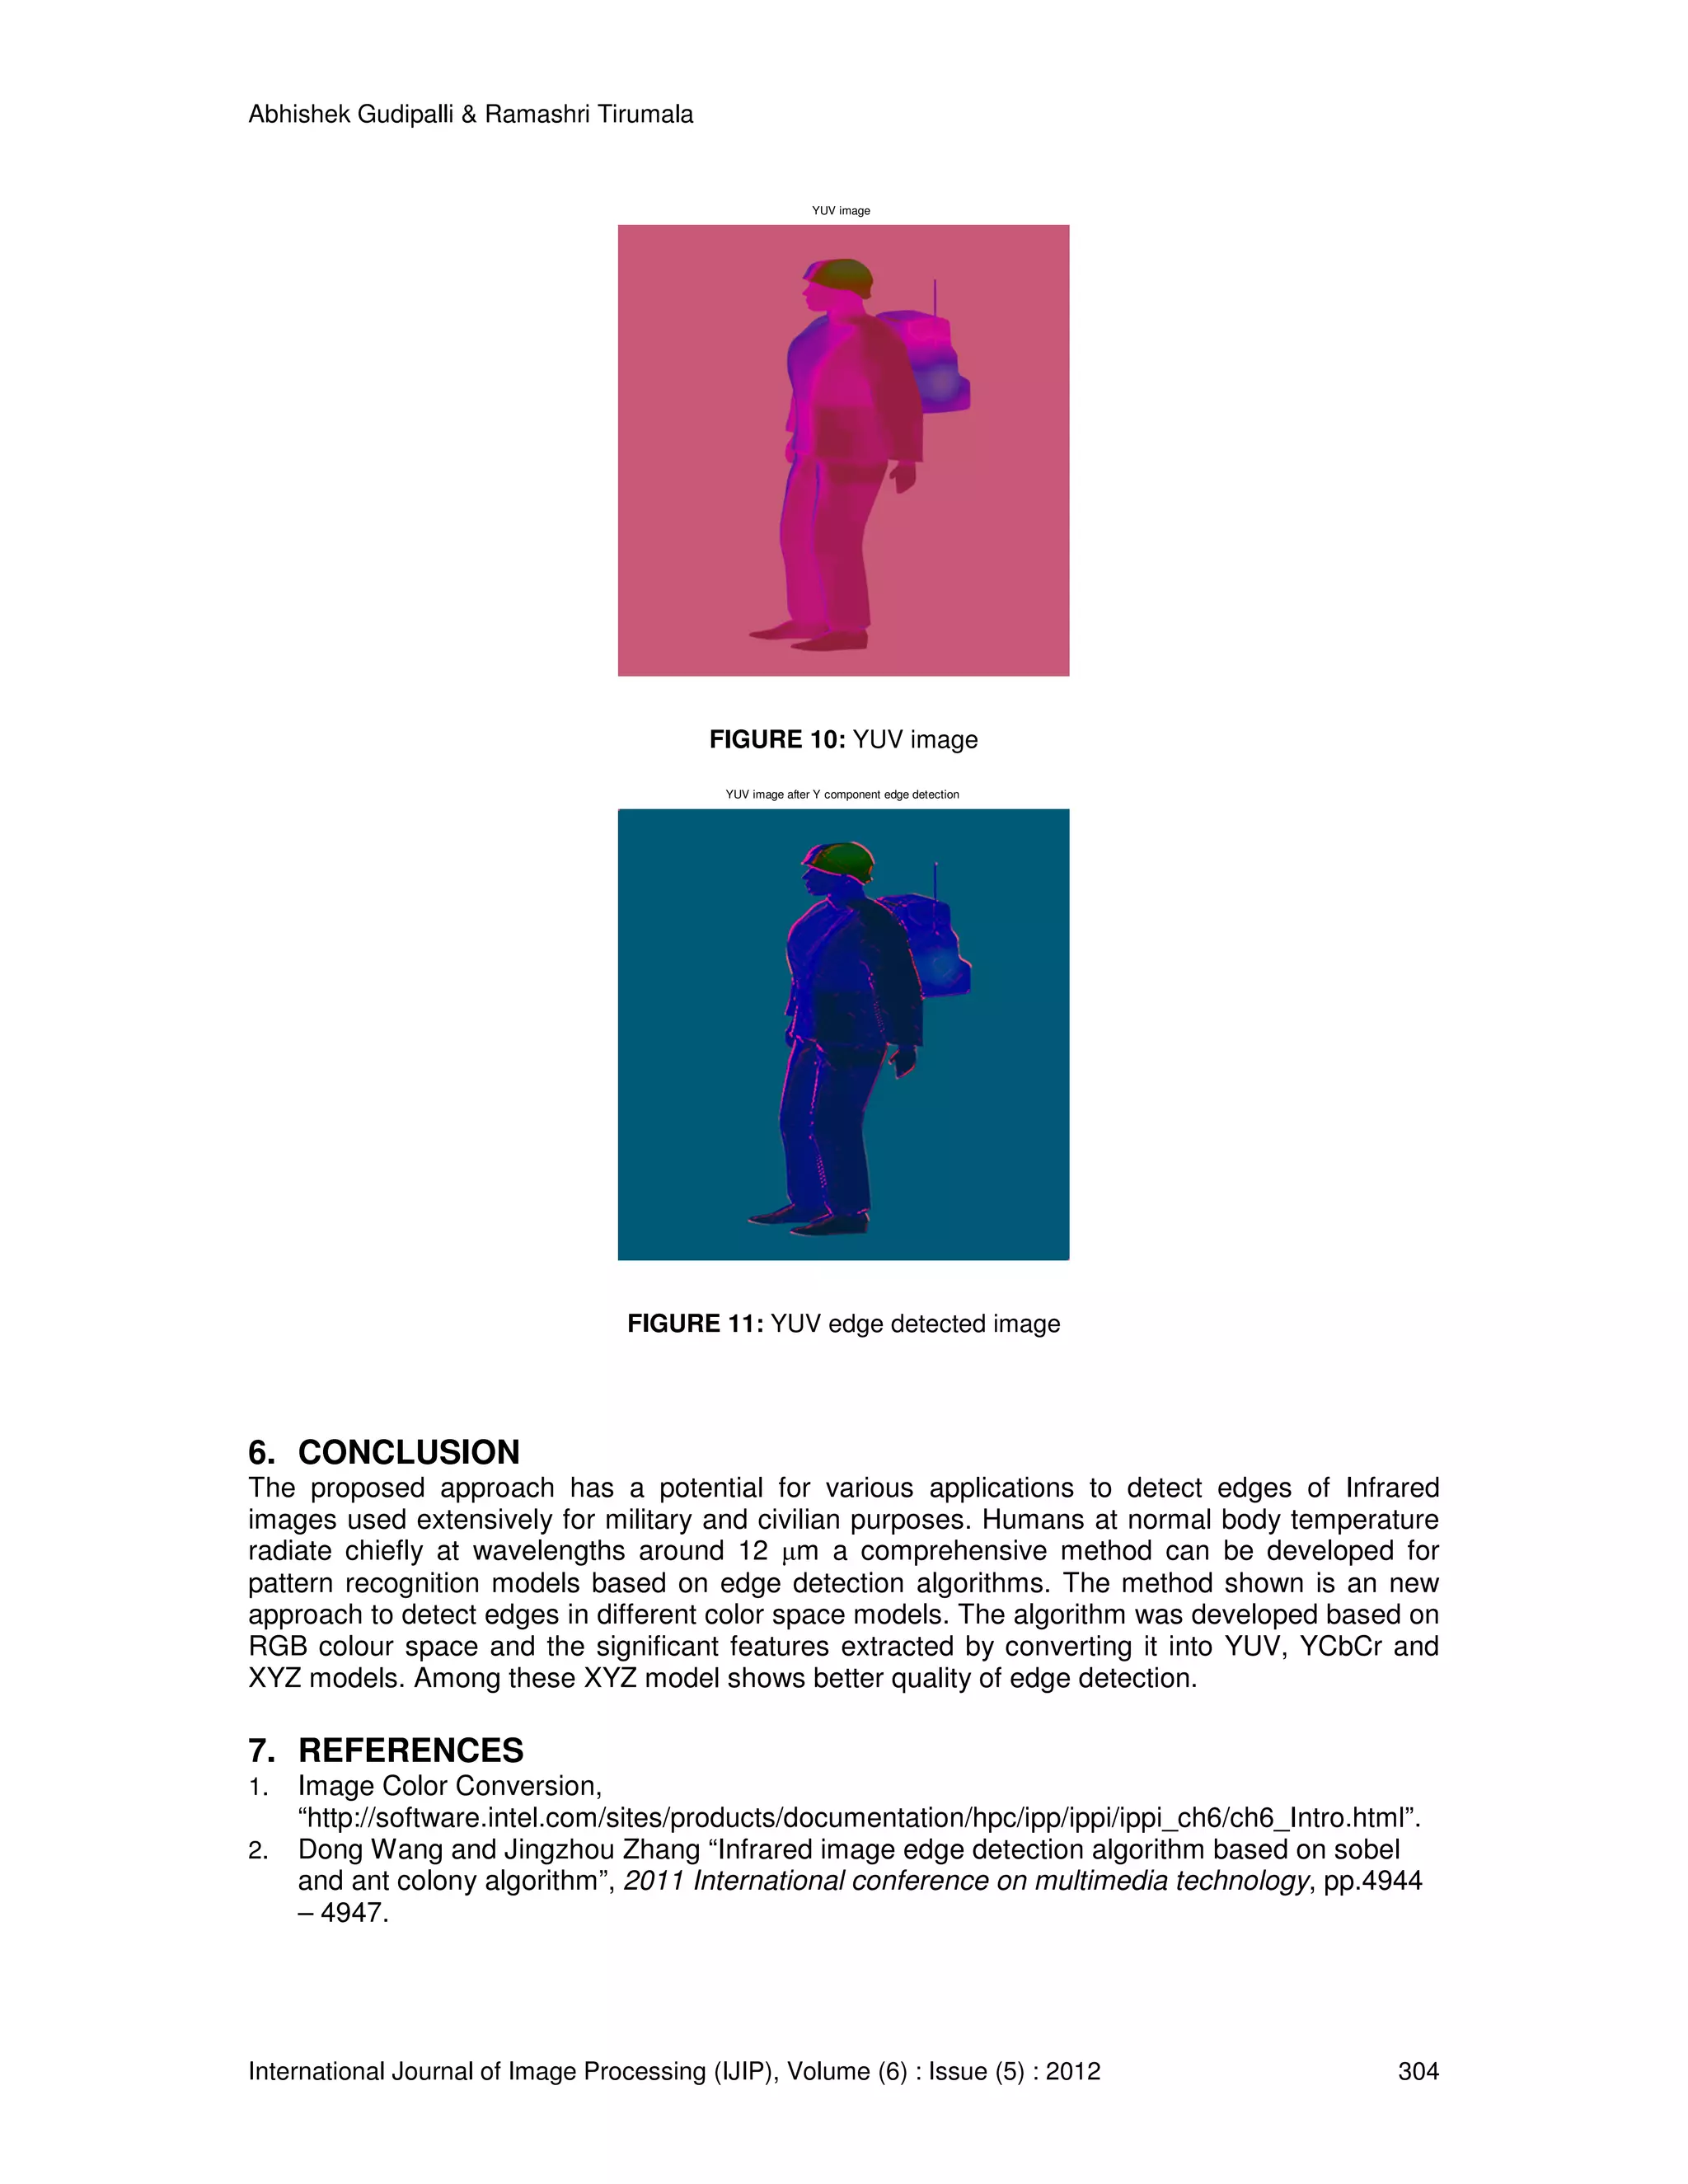
![Abhishek Gudipalli & Ramashri Tirumala International Journal of Image Processing (IJIP), Volume (6) : Issue (5) : 2012 301 values (L = 255 for 8 bits/pixel gray scale images), and K1 < 1 and K2 < 1 are two scalar constants [4]. Sheikh and Bovik (2006) developed a visual information fidelity (VIF) index for Full Reference measurement of quality of image. VIF is calculated between the reference image and its copy[5]. For ideal image, VIF is exactly unity. For distorted image types, VIF lies in between interval [0, 1]. Let e=c+n be the reference image, and n zero-mean normal distribution N (0, ߪ ଶ I ) noise. Also, let f=d+n′= gc+v′+ n′ be the test image, where g represents the blur, v′ the additive zero-mean Gaussian white noise with covariance ߪ௩ ଶ I , and n′ the zeromean normal distribution N(0,σ n2I ) noise[3]. Then, VIF can be computed as the ratio of the mutual information between c and f, and the mutual information between c and e for all wavelet subbands except the lowest approximation subband[4]. VIF= ΣI(c ;f|z) ΣI(c ;e|z) 4. PROPOSED EDGE DETECTION ALGORITHM The proposed algorithm can be explained in seven steps Step 1: The RGB image is sub divided into R, G and B layers of the image. Step 2: A 3X3 Laplacian mask is convolved with the R component of the image. Step 3: The edge detected R and the G, B layers of the image are concatenated to obtain edge detected image Step 4: SSIM and VIF values are calculated between the R edge detected image and RGB image. Step 5: Repeat steps 2 to 4 to calculate the SSIM and VIF values between G edge detected image and RGB image Step 6: Repeat steps 2 to 4 to calculate the SSIM and VIF values between B edge detected image and RGB image Step 7: The SSIM and VIF values of individual components are averaged. Step 8: R, G and B values of the image are transformed into its YCbCr, YUV and XYZ Intensity values using the conversion formulas. Step 9: Repeat steps 1 to 8 to calculate SSIM and VIF values for YCbCr, YUV and XYZ images. 5. EXPERIMENTAL RESULTS The Proposed algorithm has been applied to RGB, YCbCr, YUV and XYZ images and SSIM &VIF values are computed for a set of edge detected images and dataset is formed and tabulated in Table 1. The property of infrared images is that intensity value depends on temperature, object surface, surface direction, wavelength, etc. based up on these, for RGB color model, The SSIM value range is around 0.57 and VIF value range is around 0.21. For YCbCr color model, The SSIM value range is around 0.58 and VIF value range is around 0.13. For YUV color model, The SSIM value range is around 0.49 and VIF value range is around 0.16. For XYZ color model, The SSIM value range is around 0.61 and VIF value range is around 0.33.from the dataset, XYZ model shows better quality of edge detection than the other color models. The original and edge detected RGB, YCbCr, YUV and XYZ images are shown below. Color model SSIM VIF RGB 0.5730 0.2147 XYZ 0.6156 0.3306 YCbCr 0.5790 0.1316 YUV 0.4907 0.1675 TABLE 1: SSIM and VIF Values for RGB, XYZ, YCbCr and YUV images.](https://image.slidesharecdn.com/ijip-651-160101133856/75/Comprehensive-Infrared-Image-Edge-detection-Algorithm-5-2048.jpg)