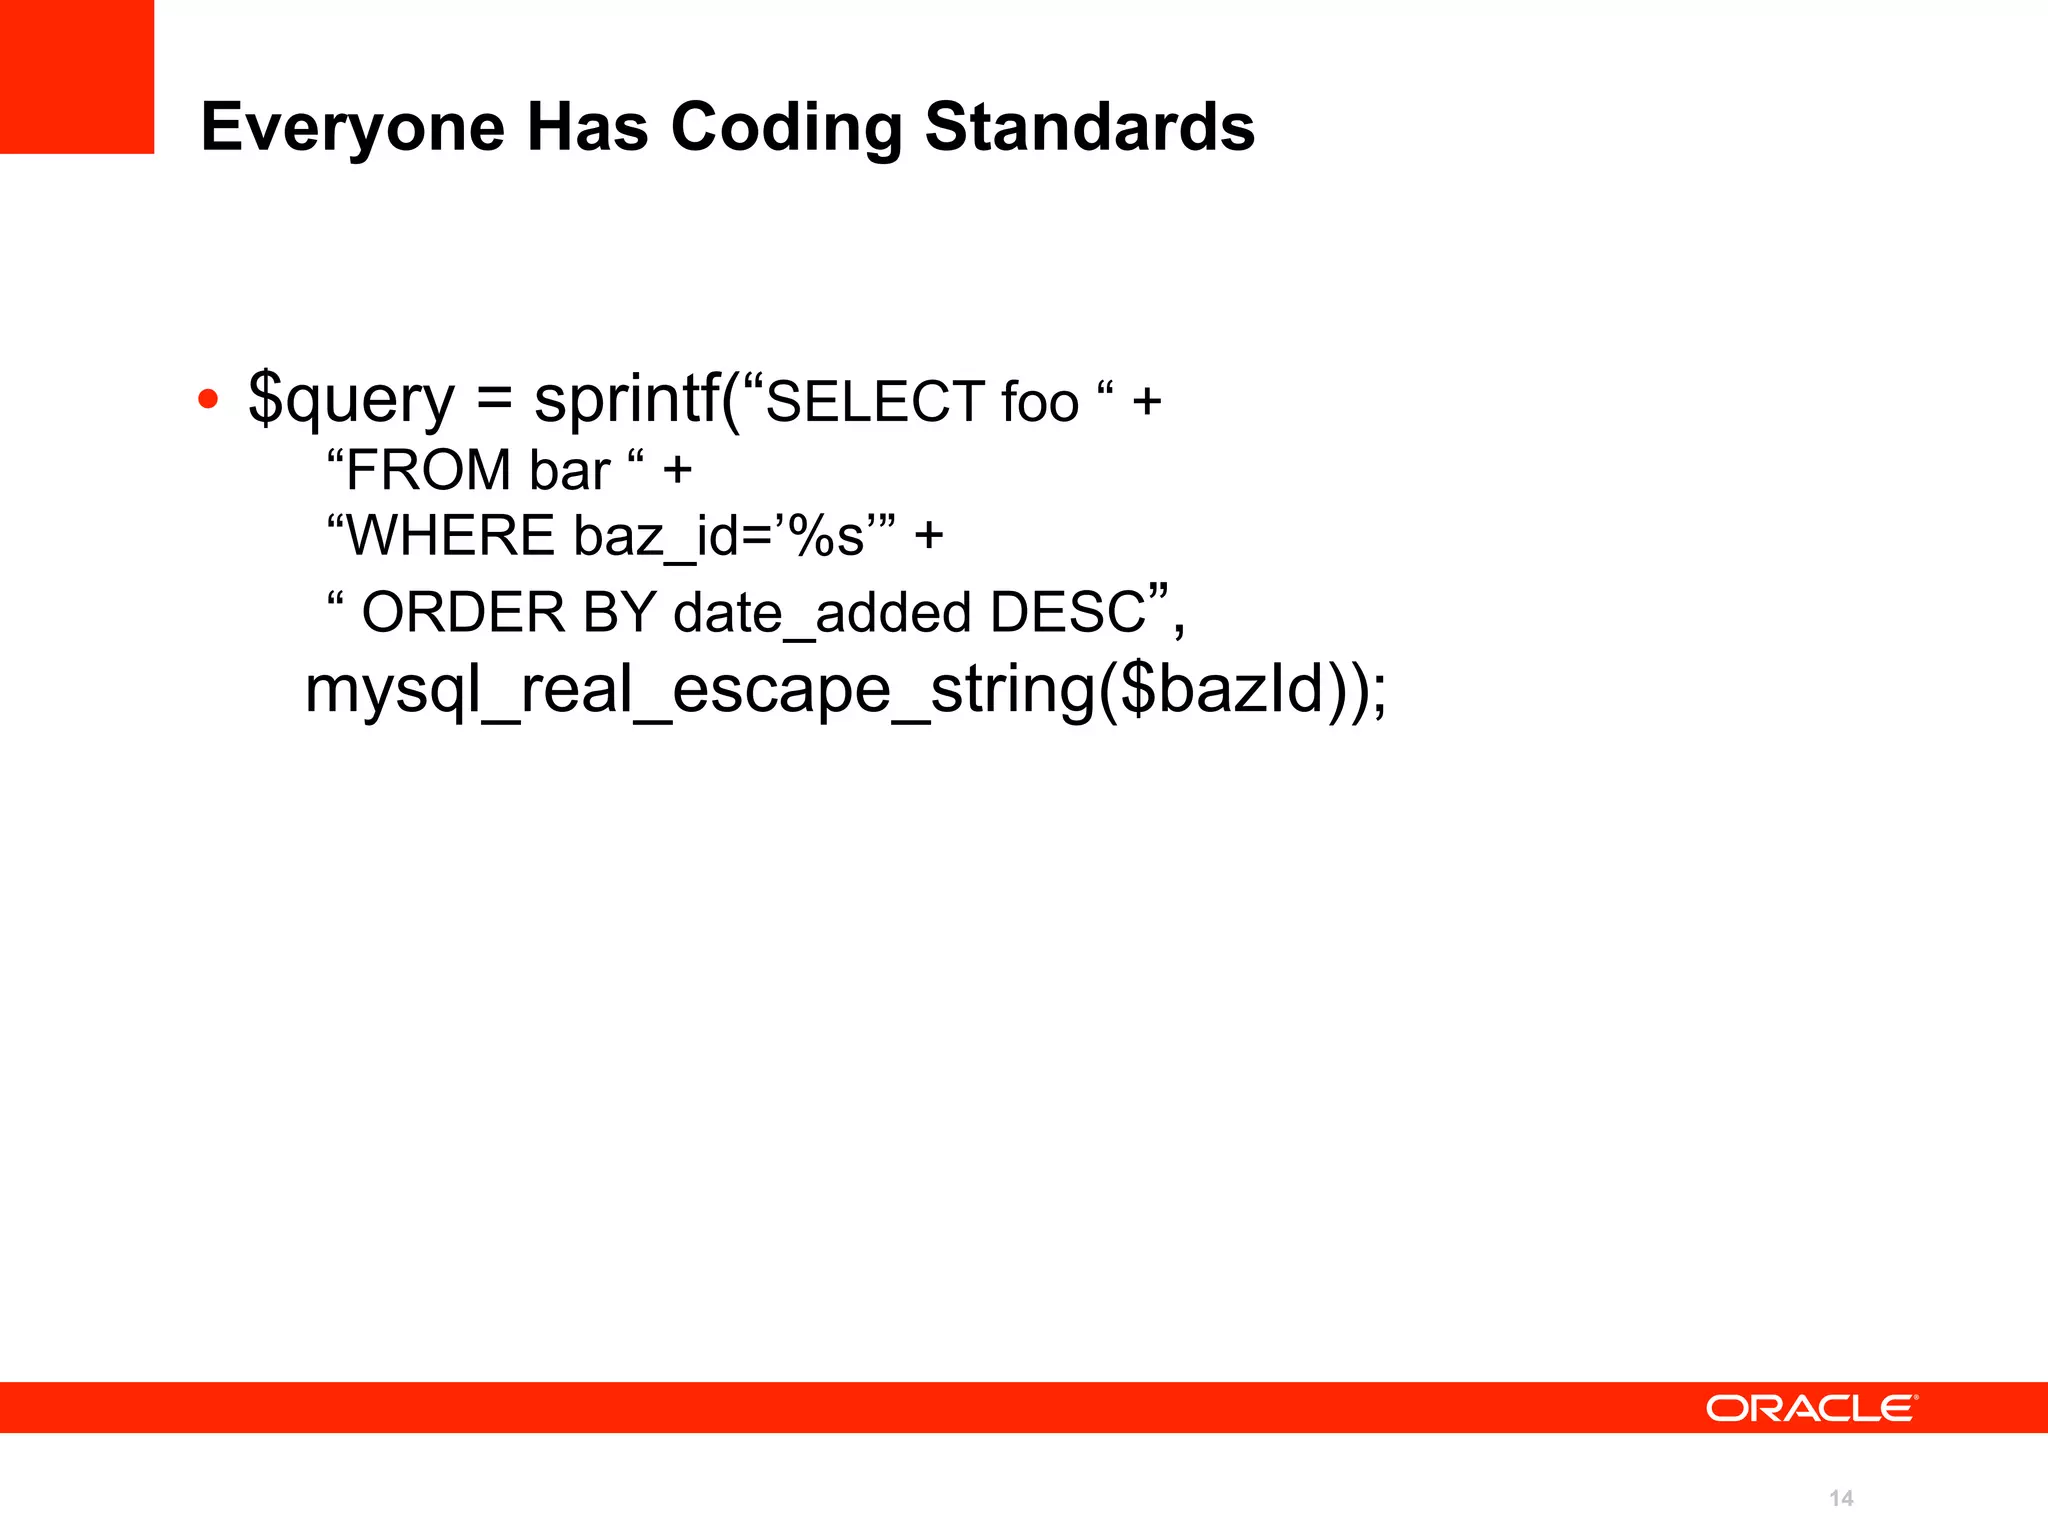
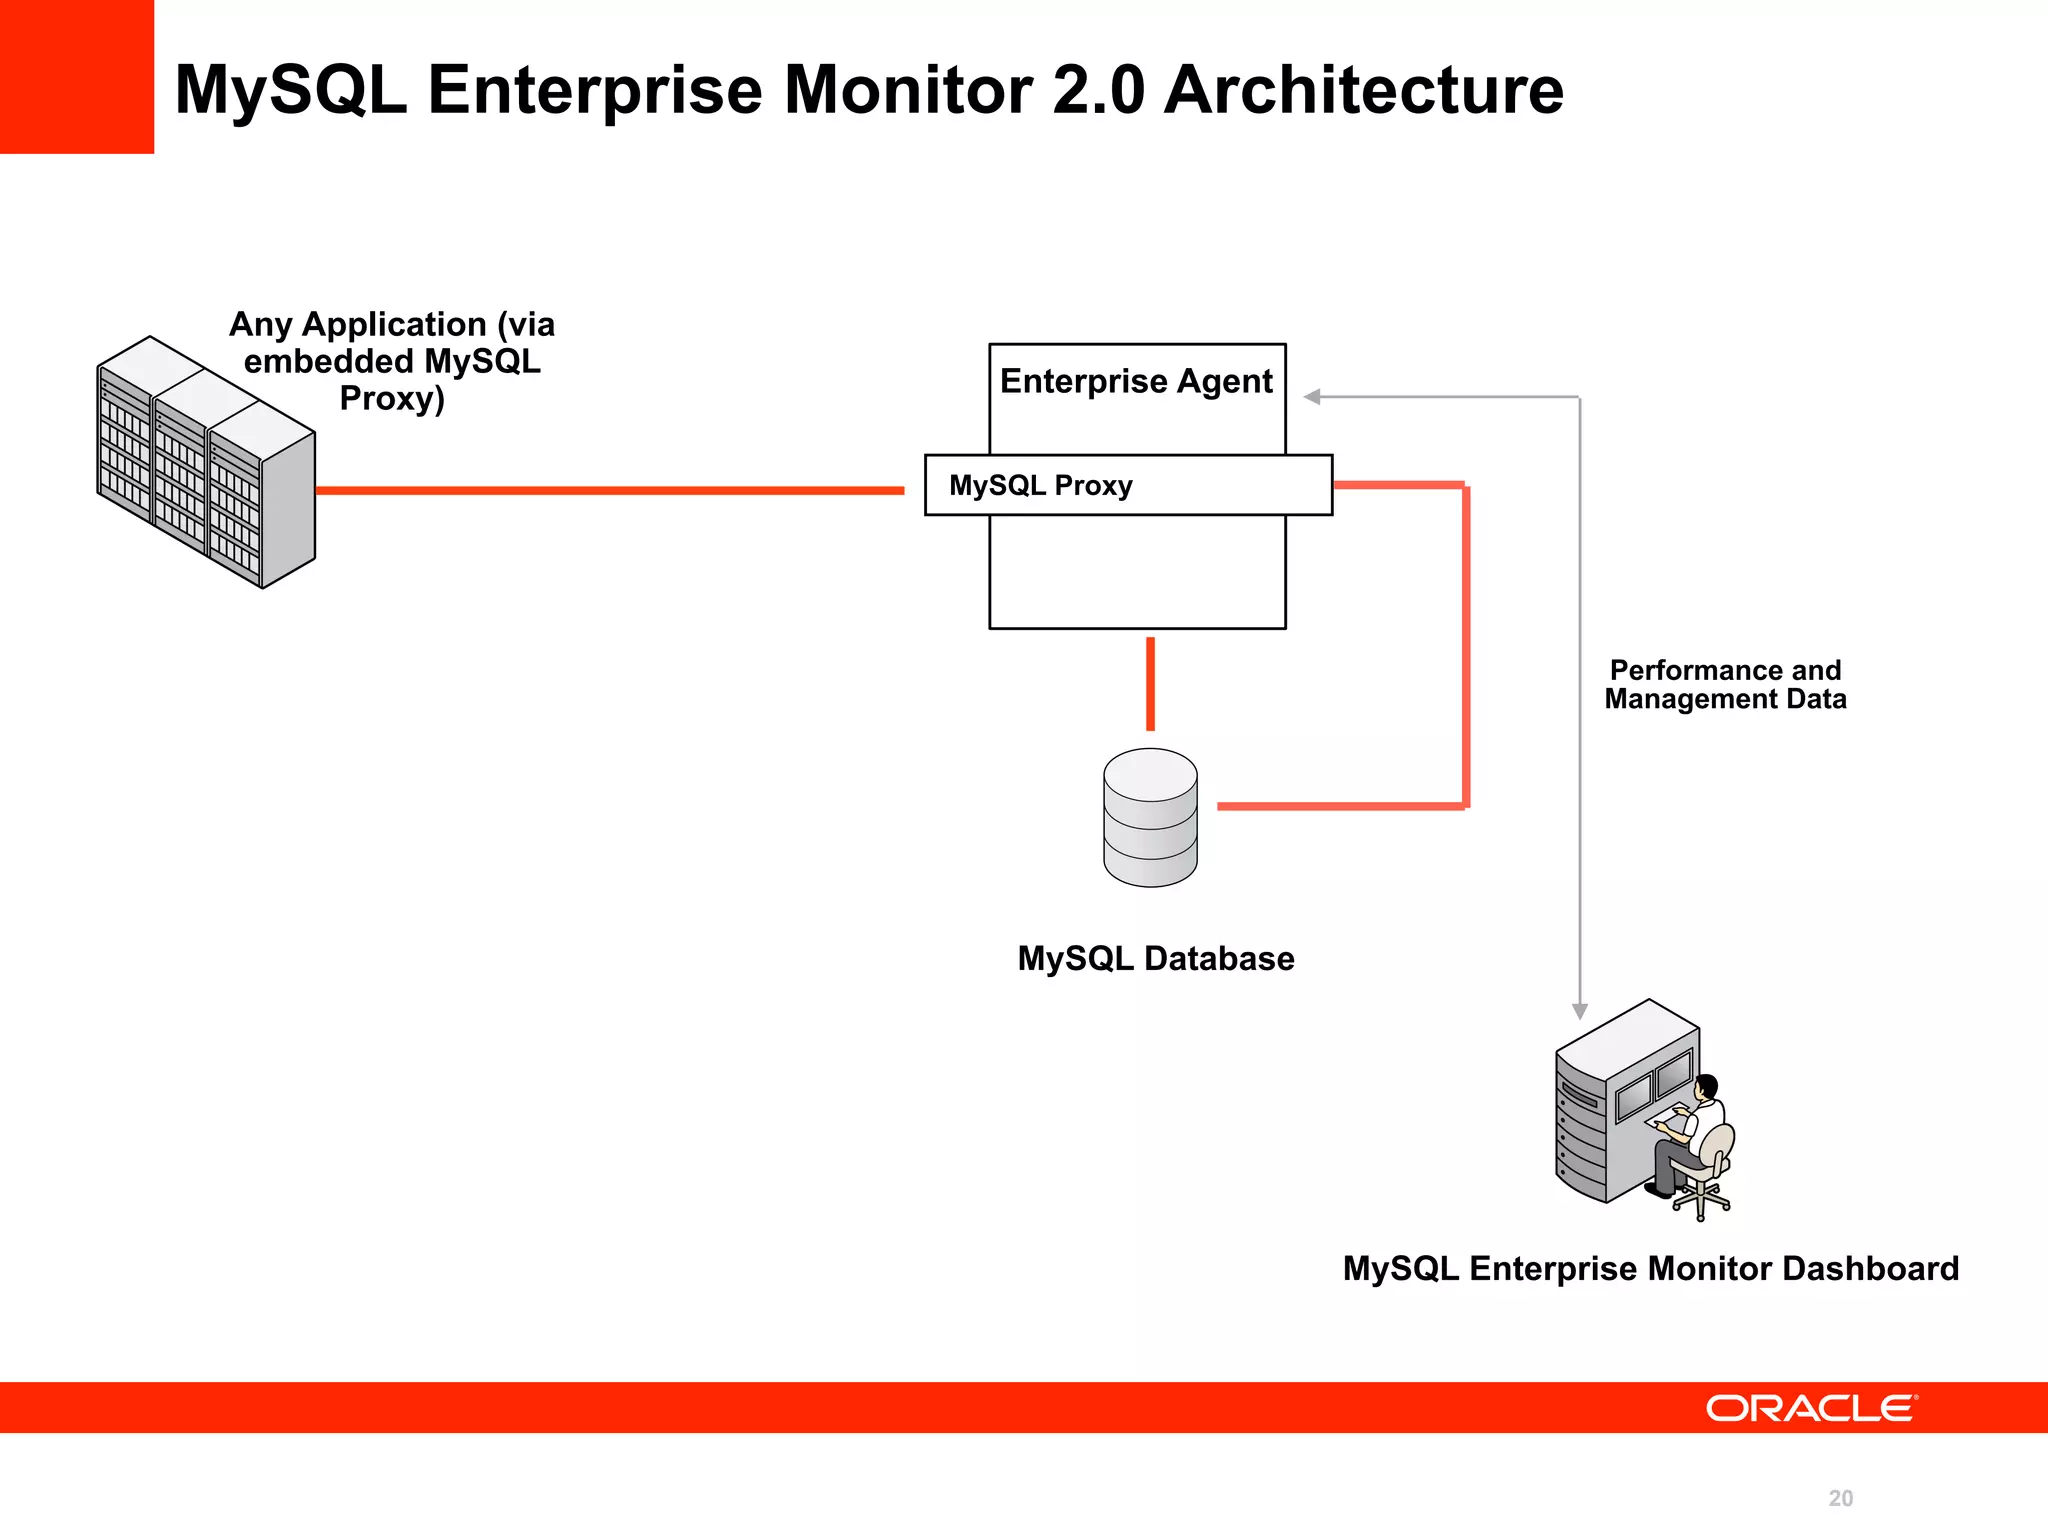
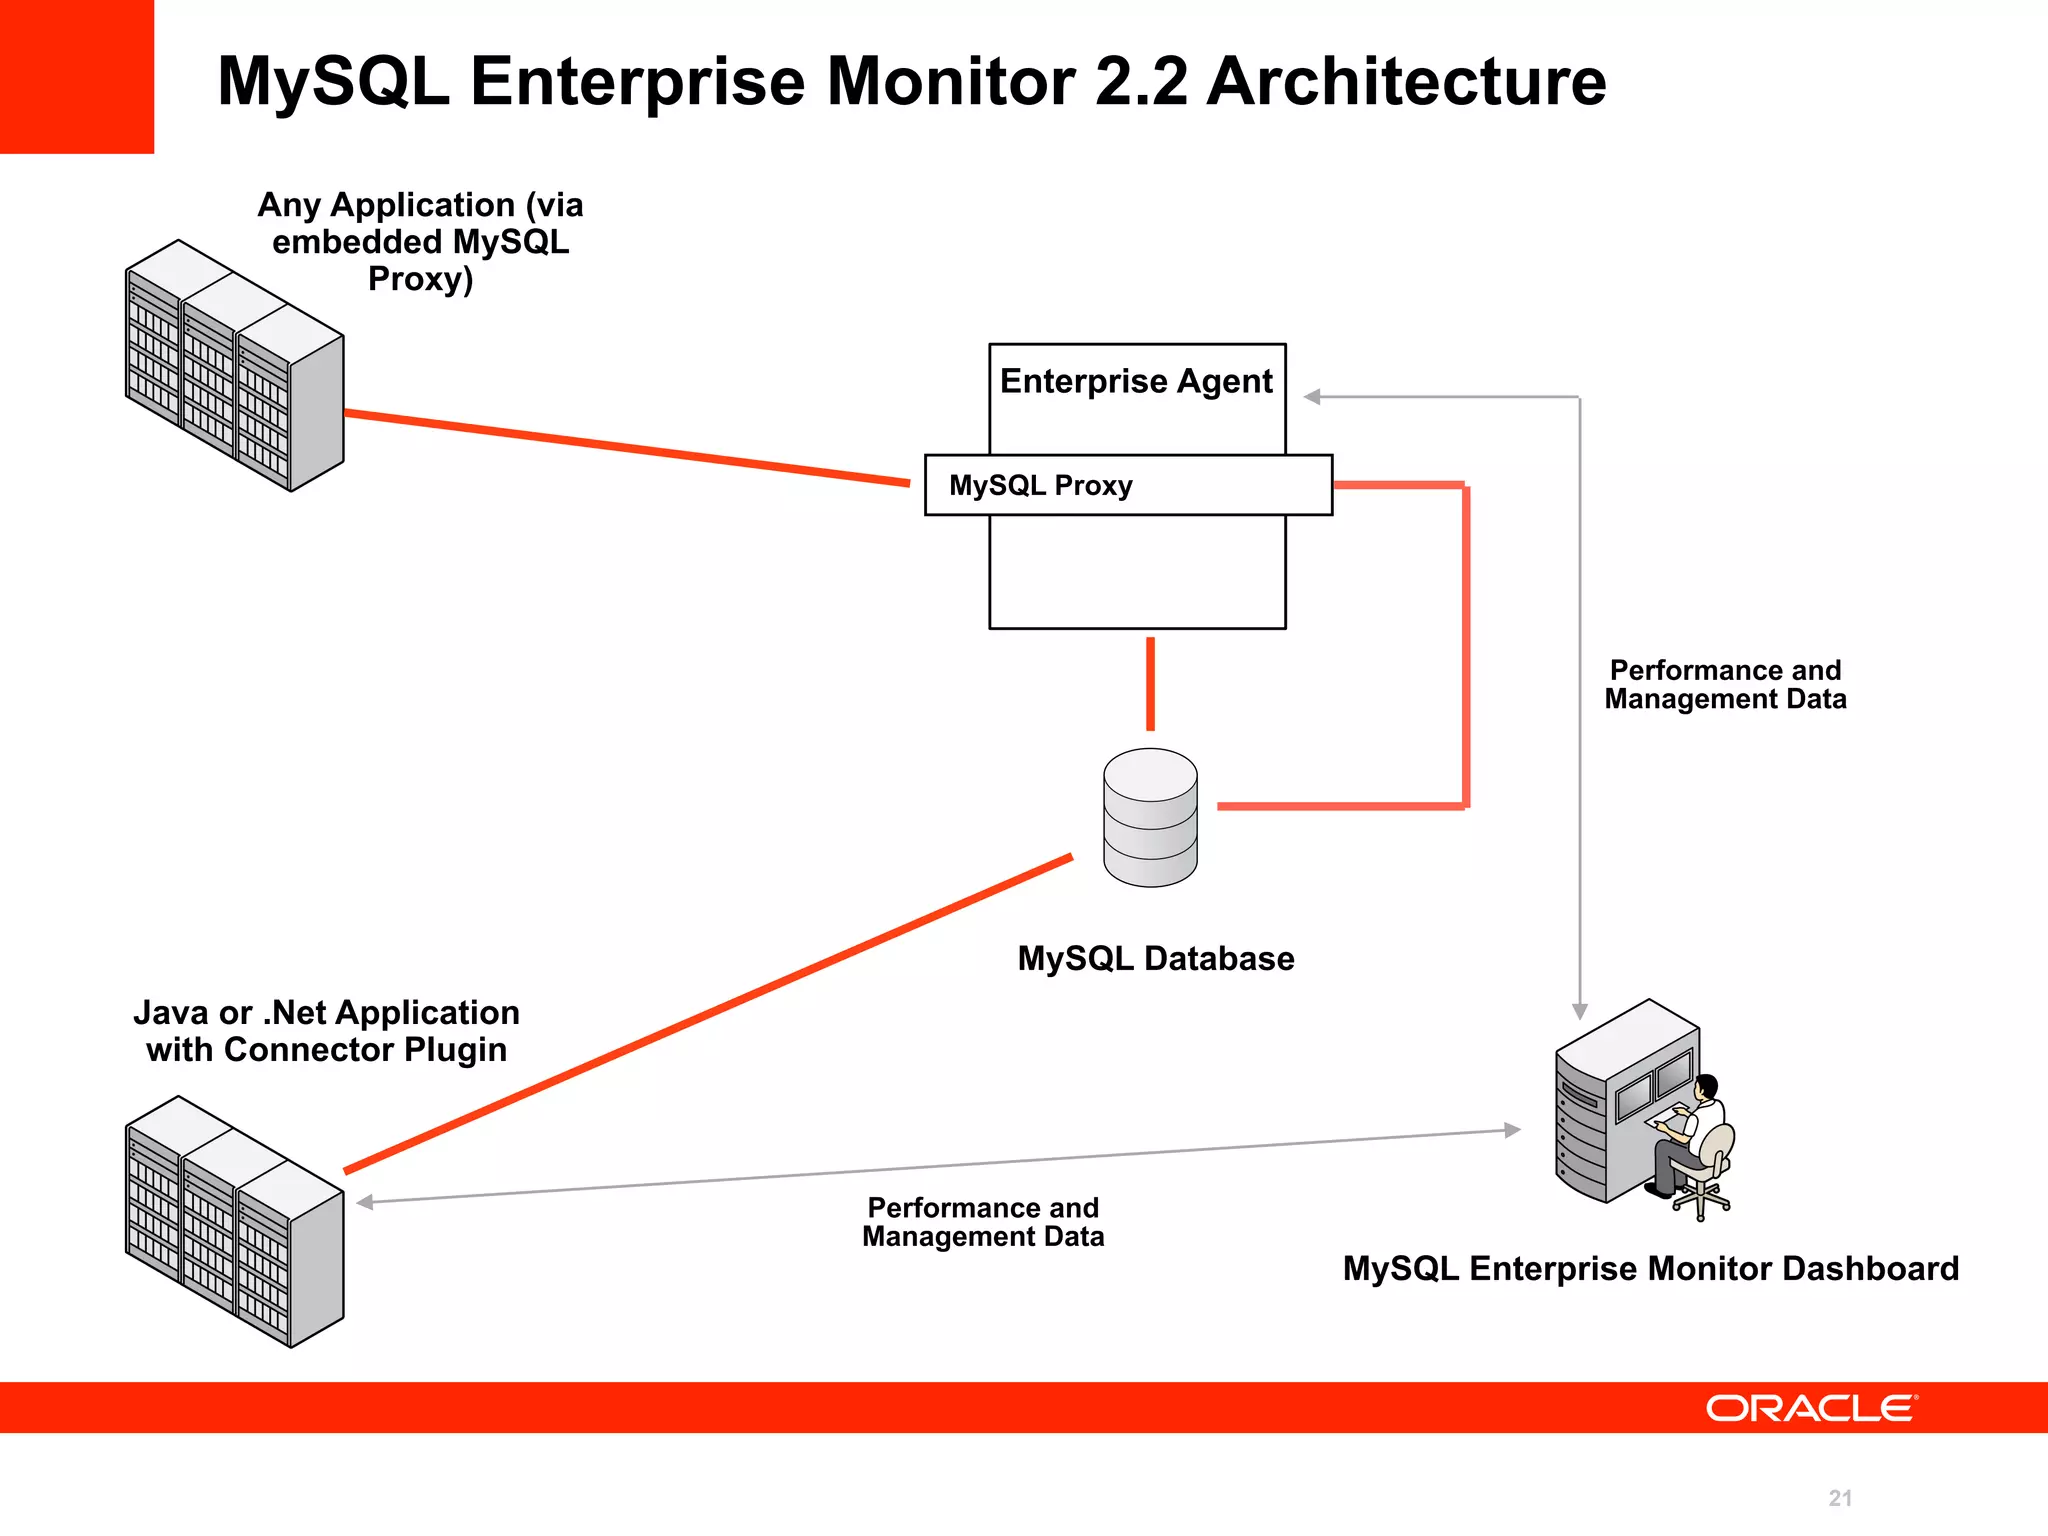
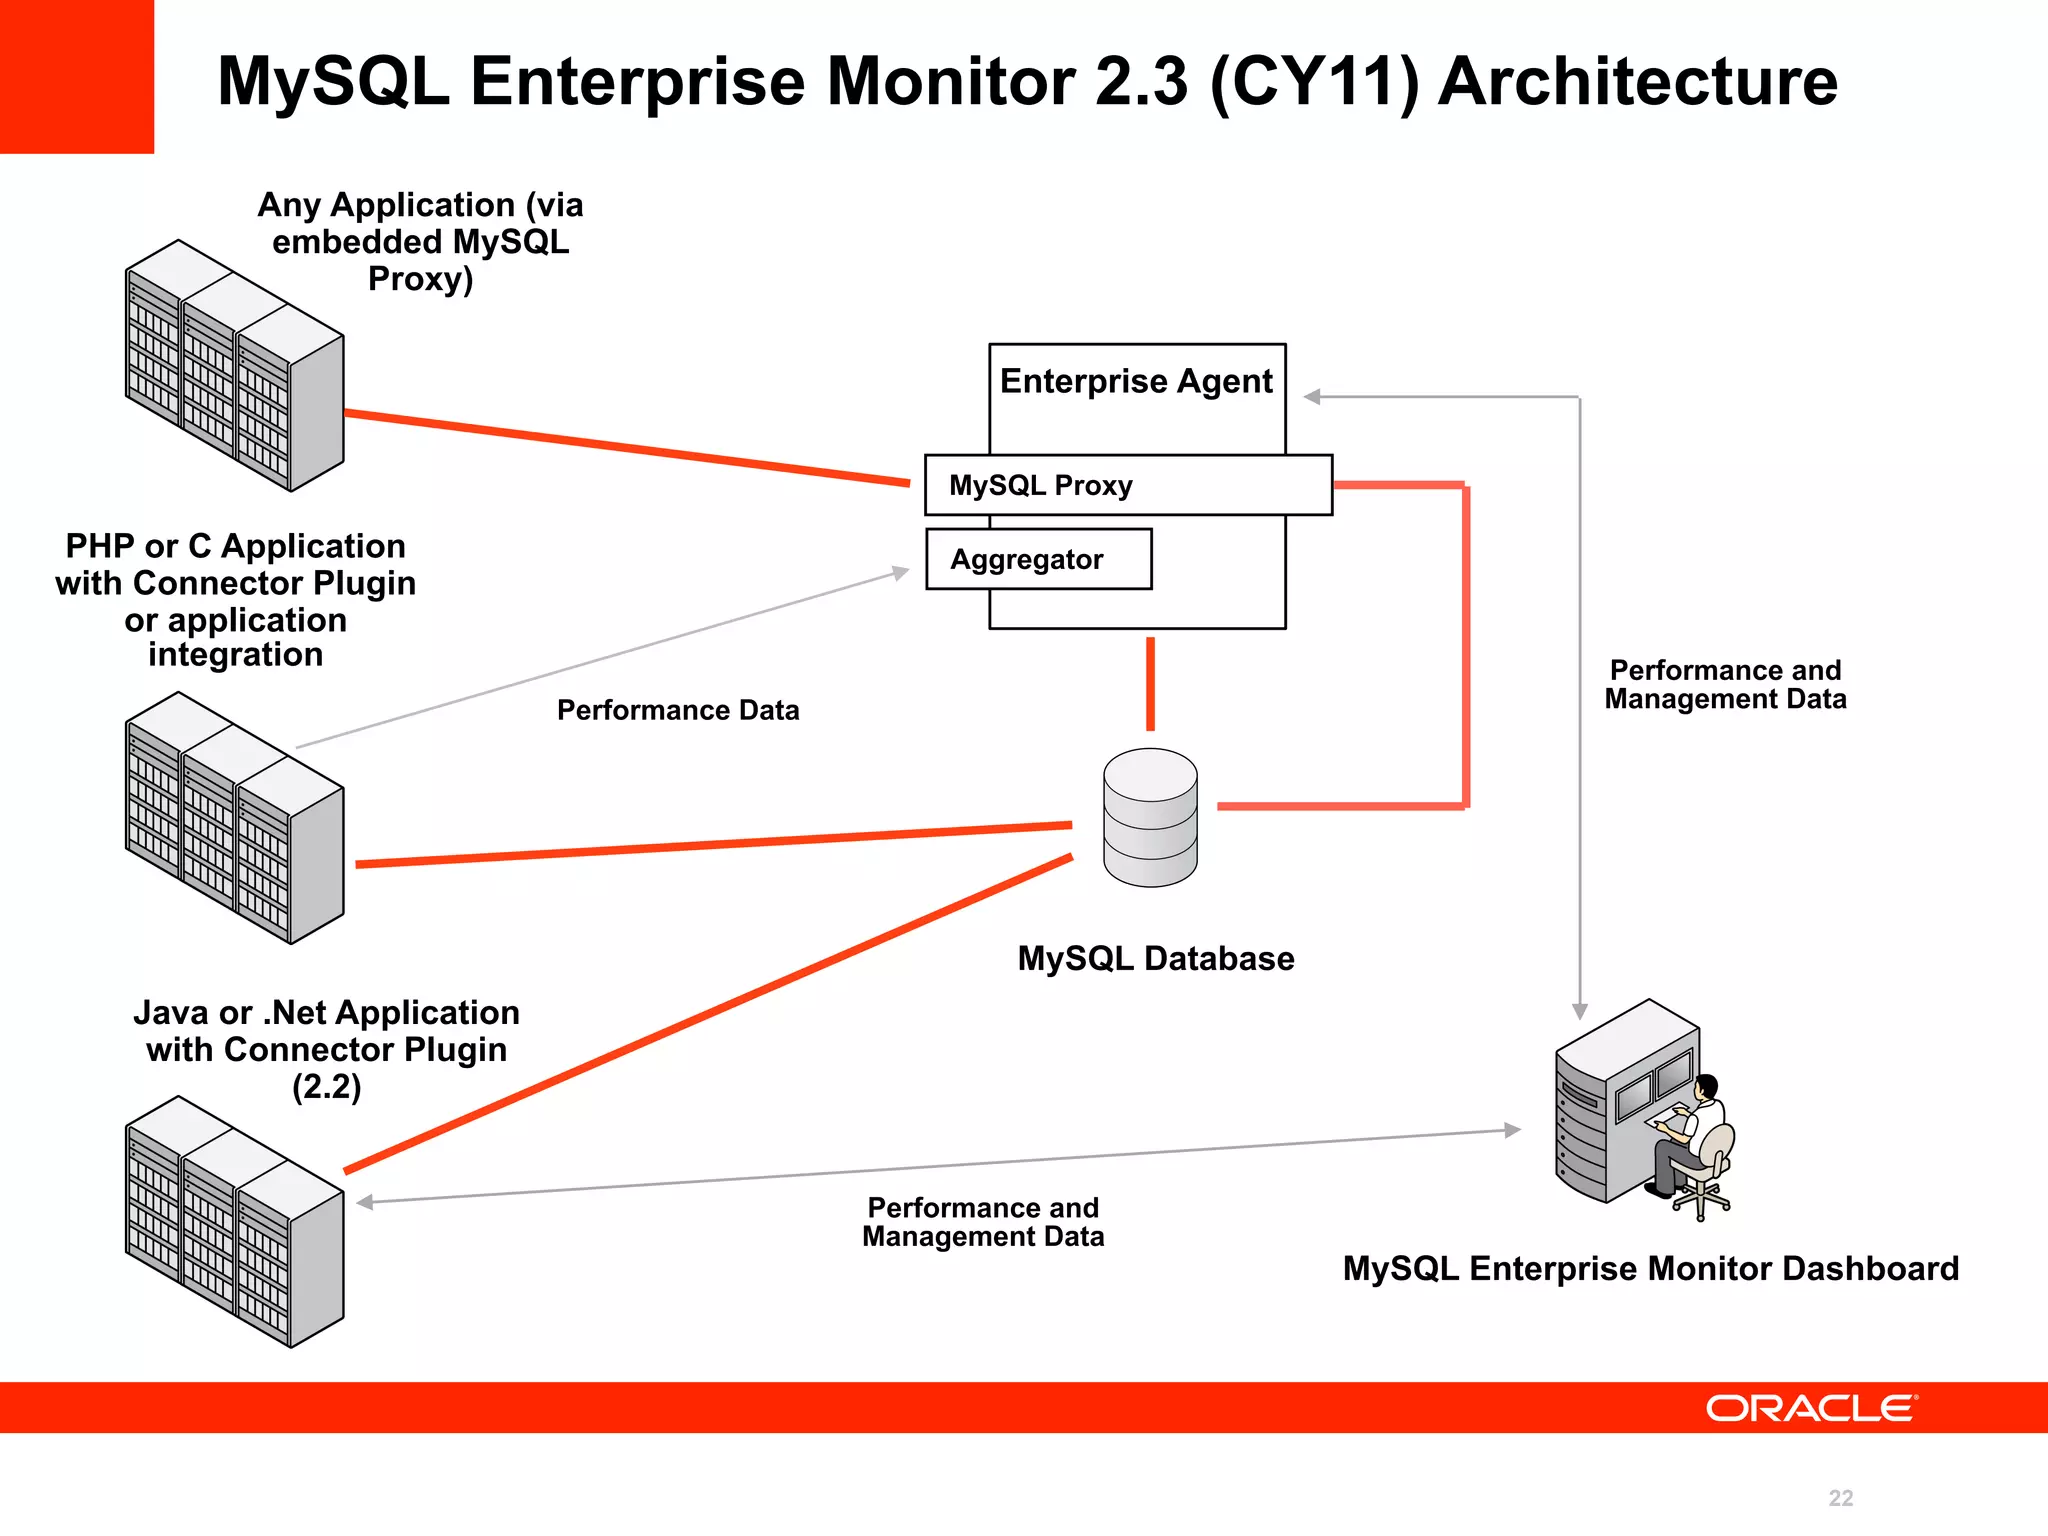
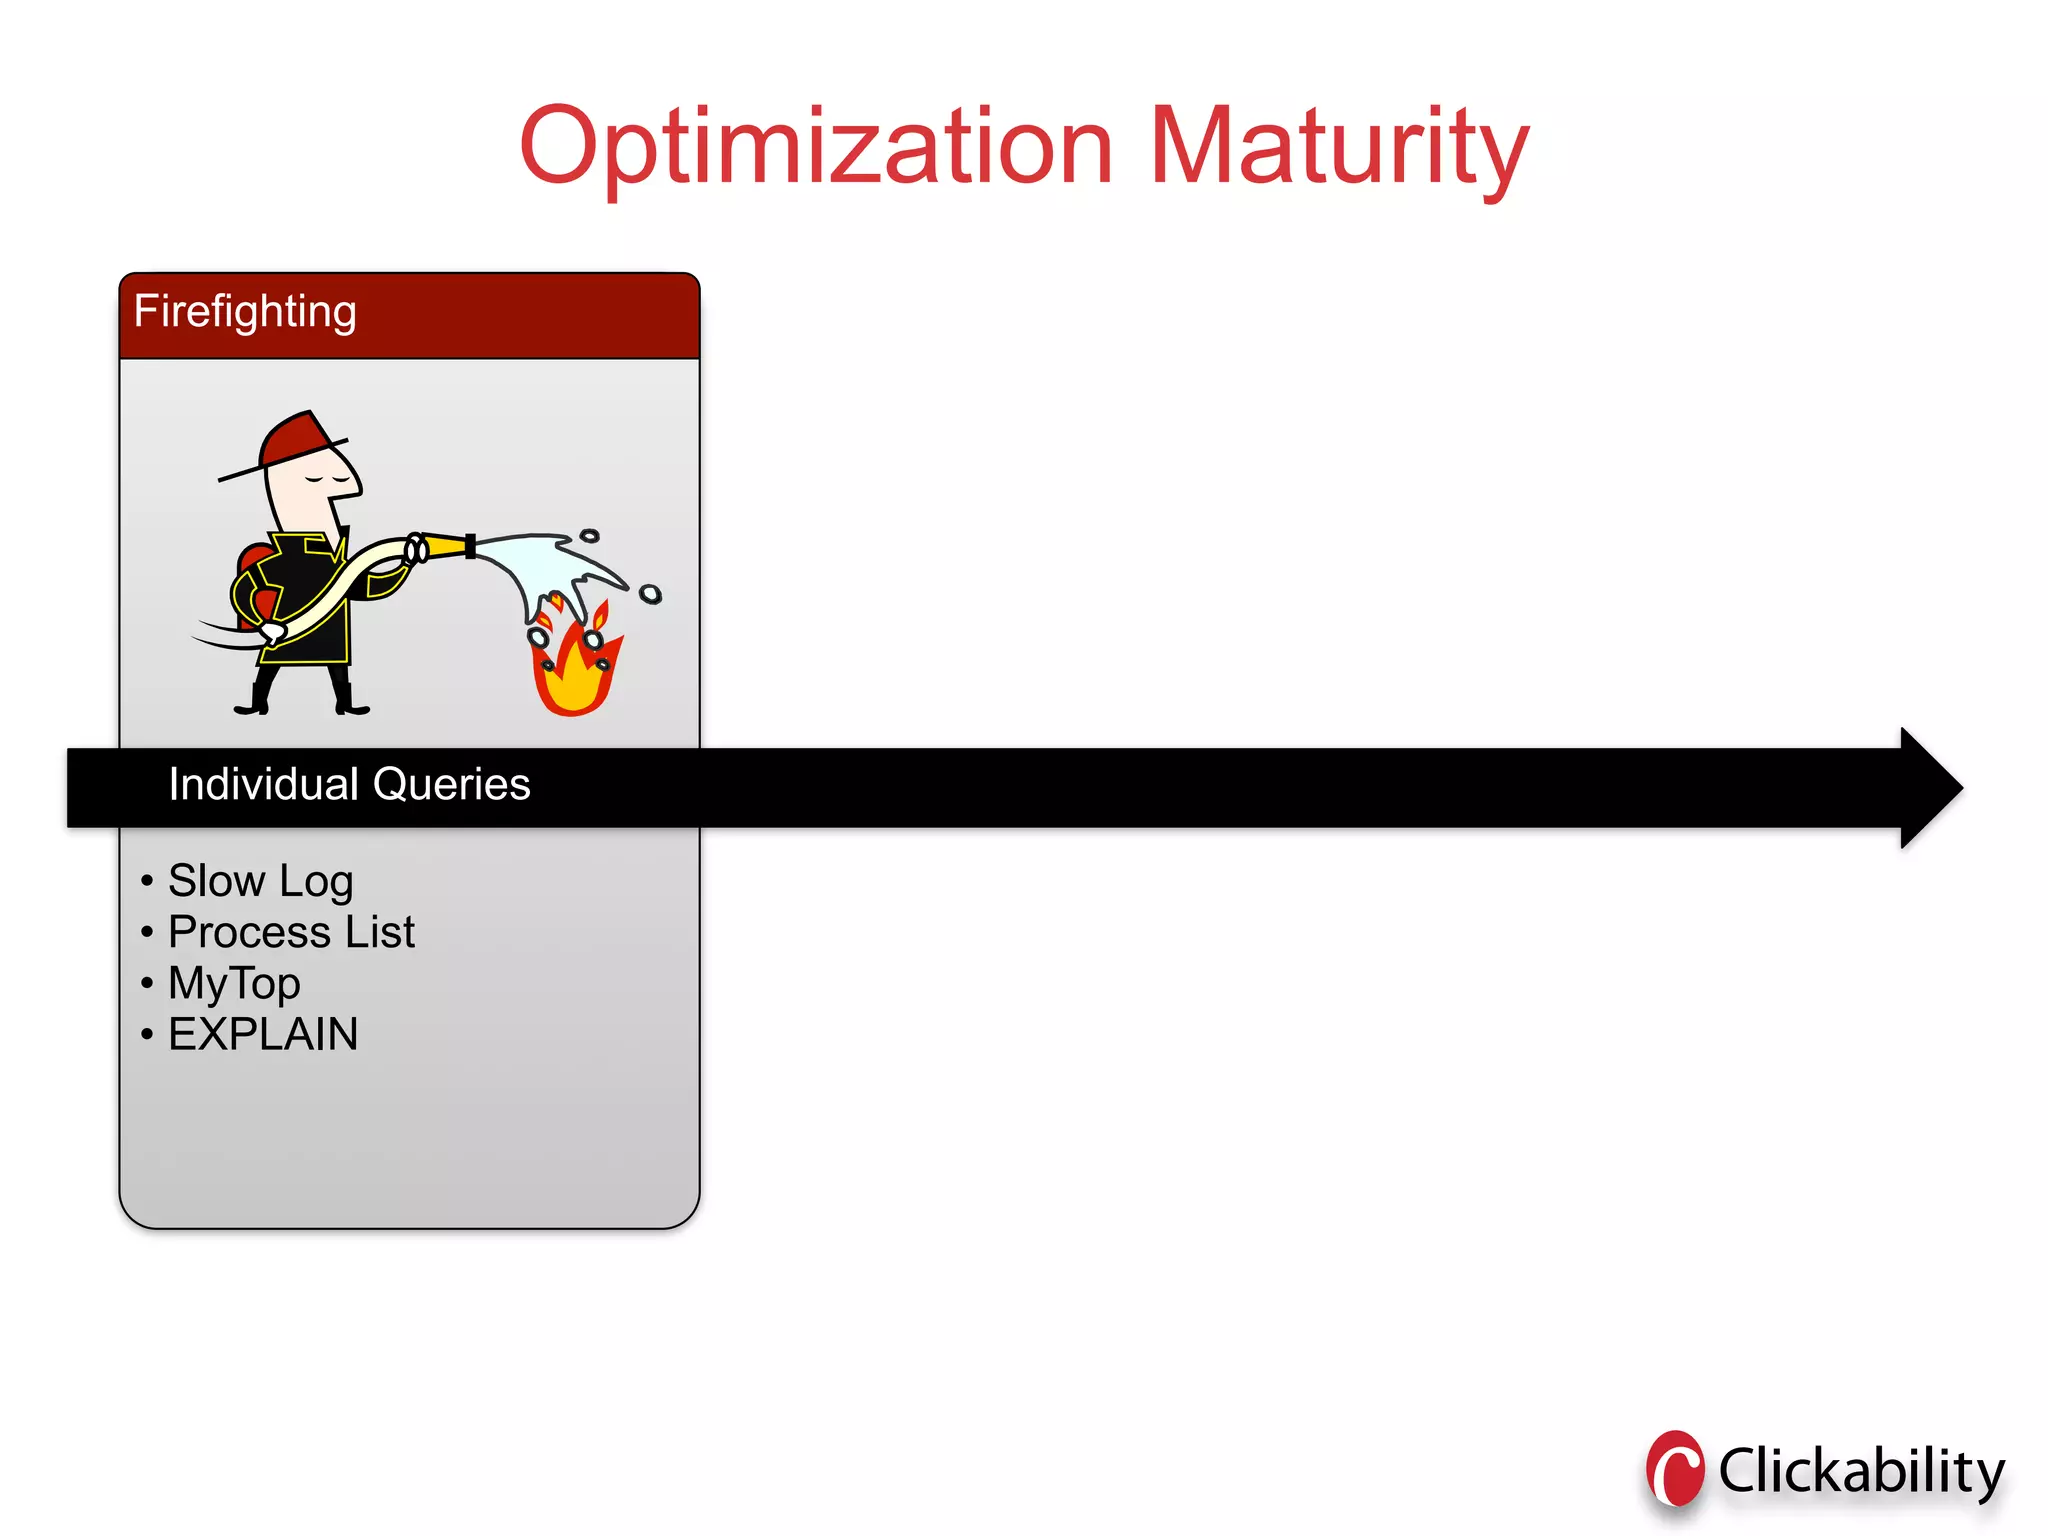
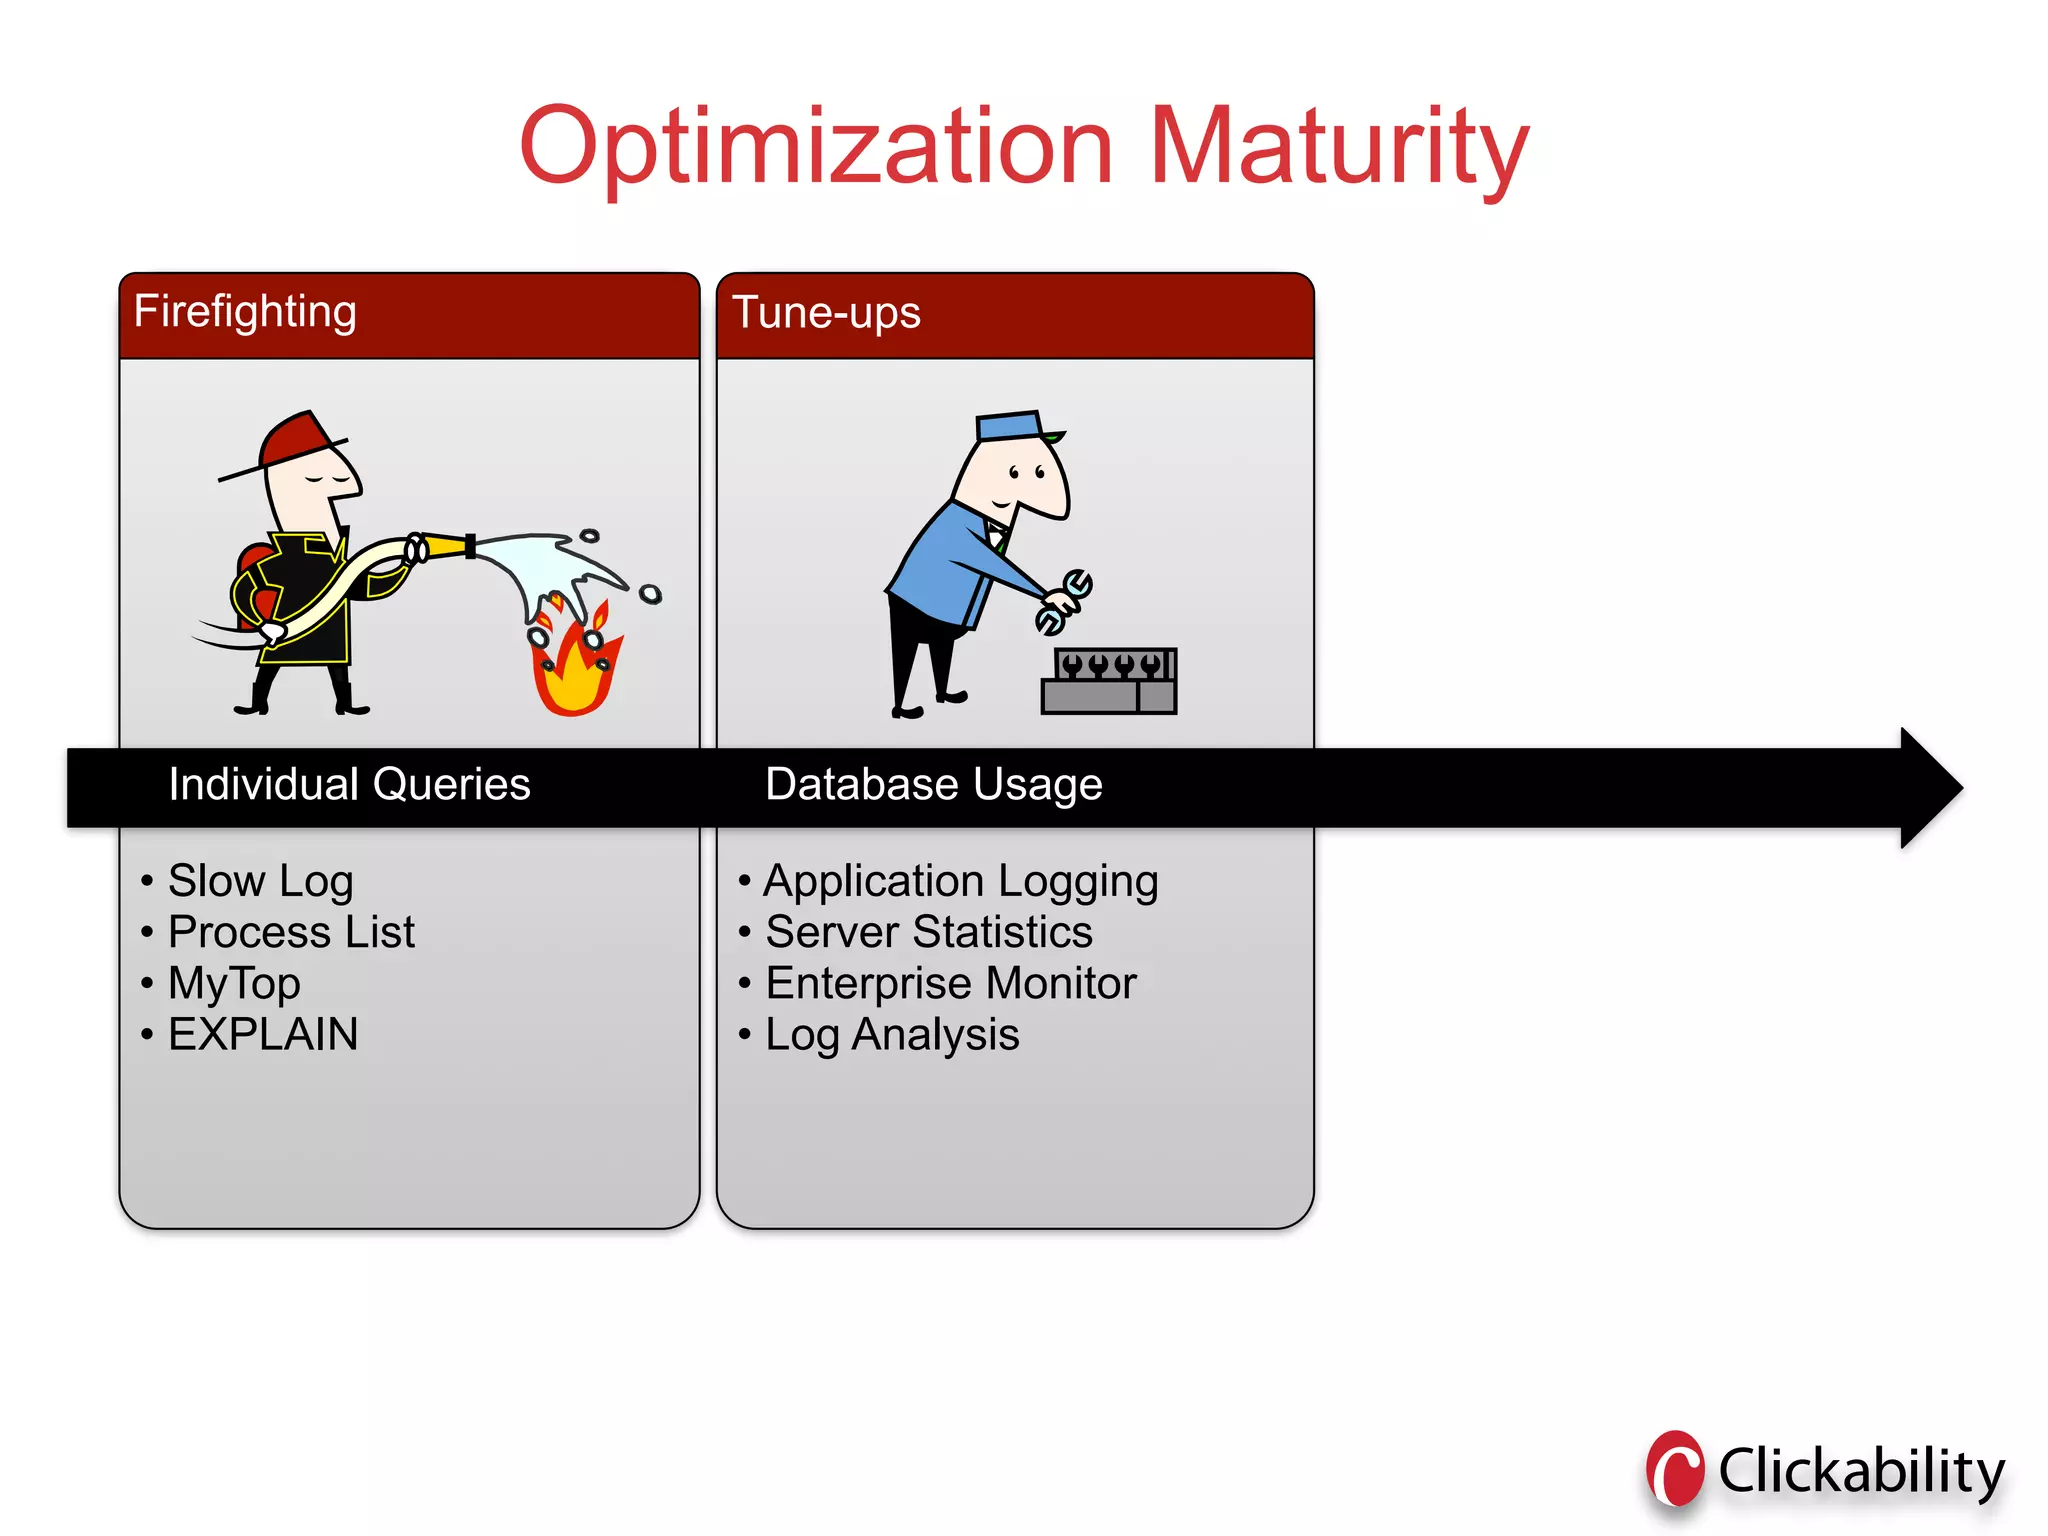
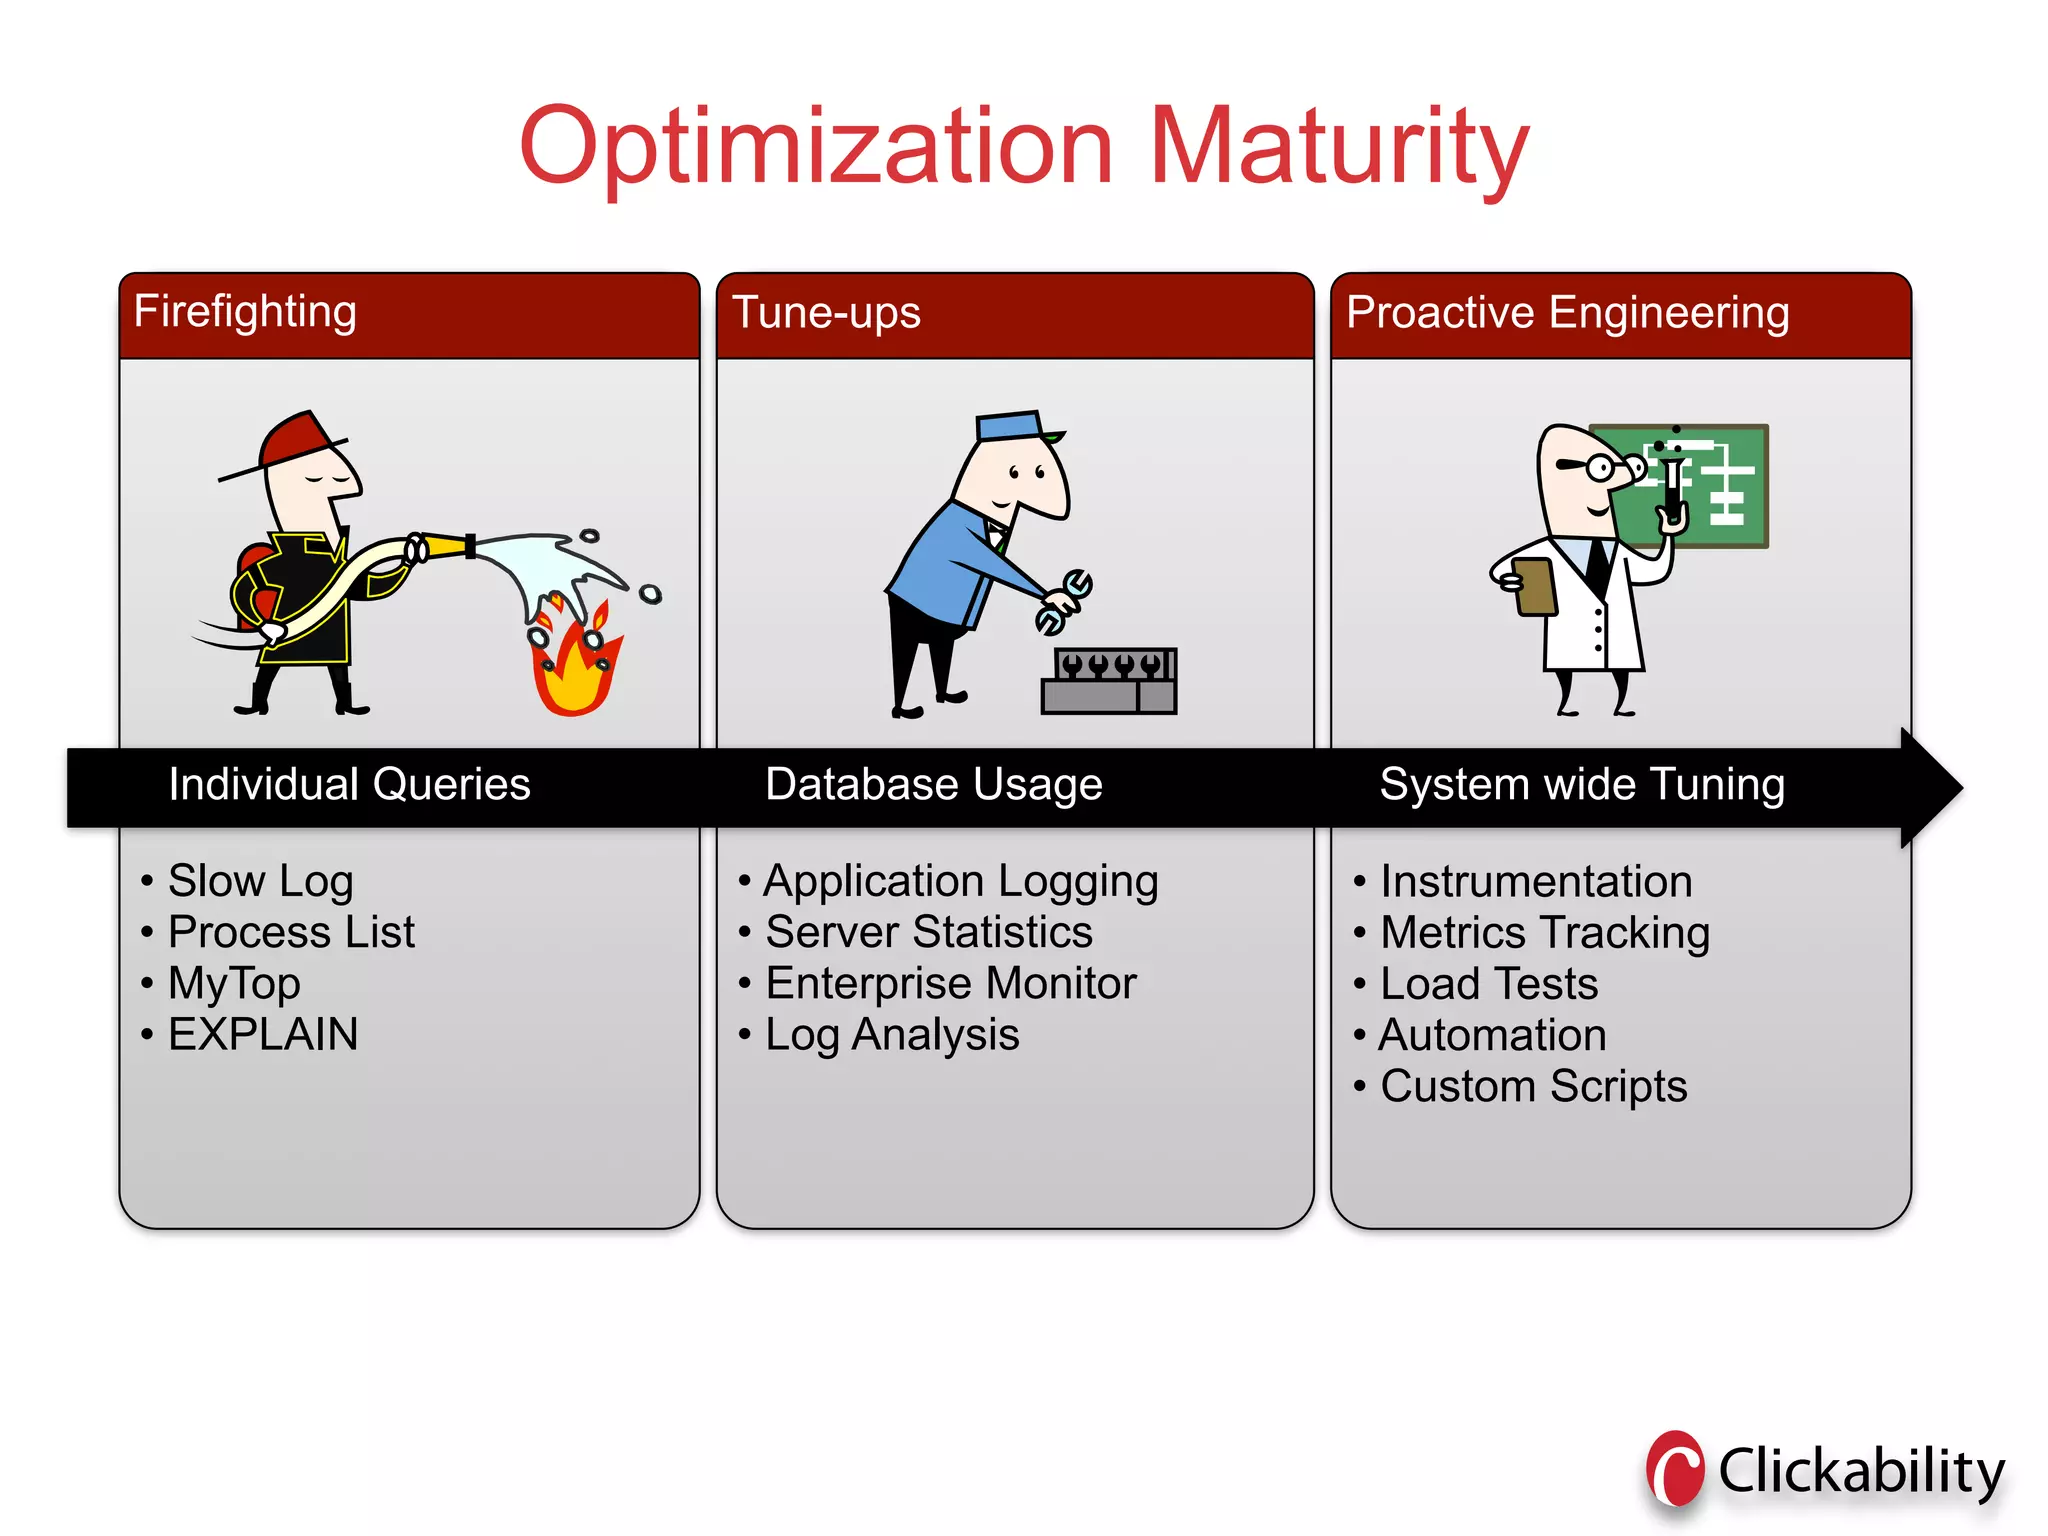
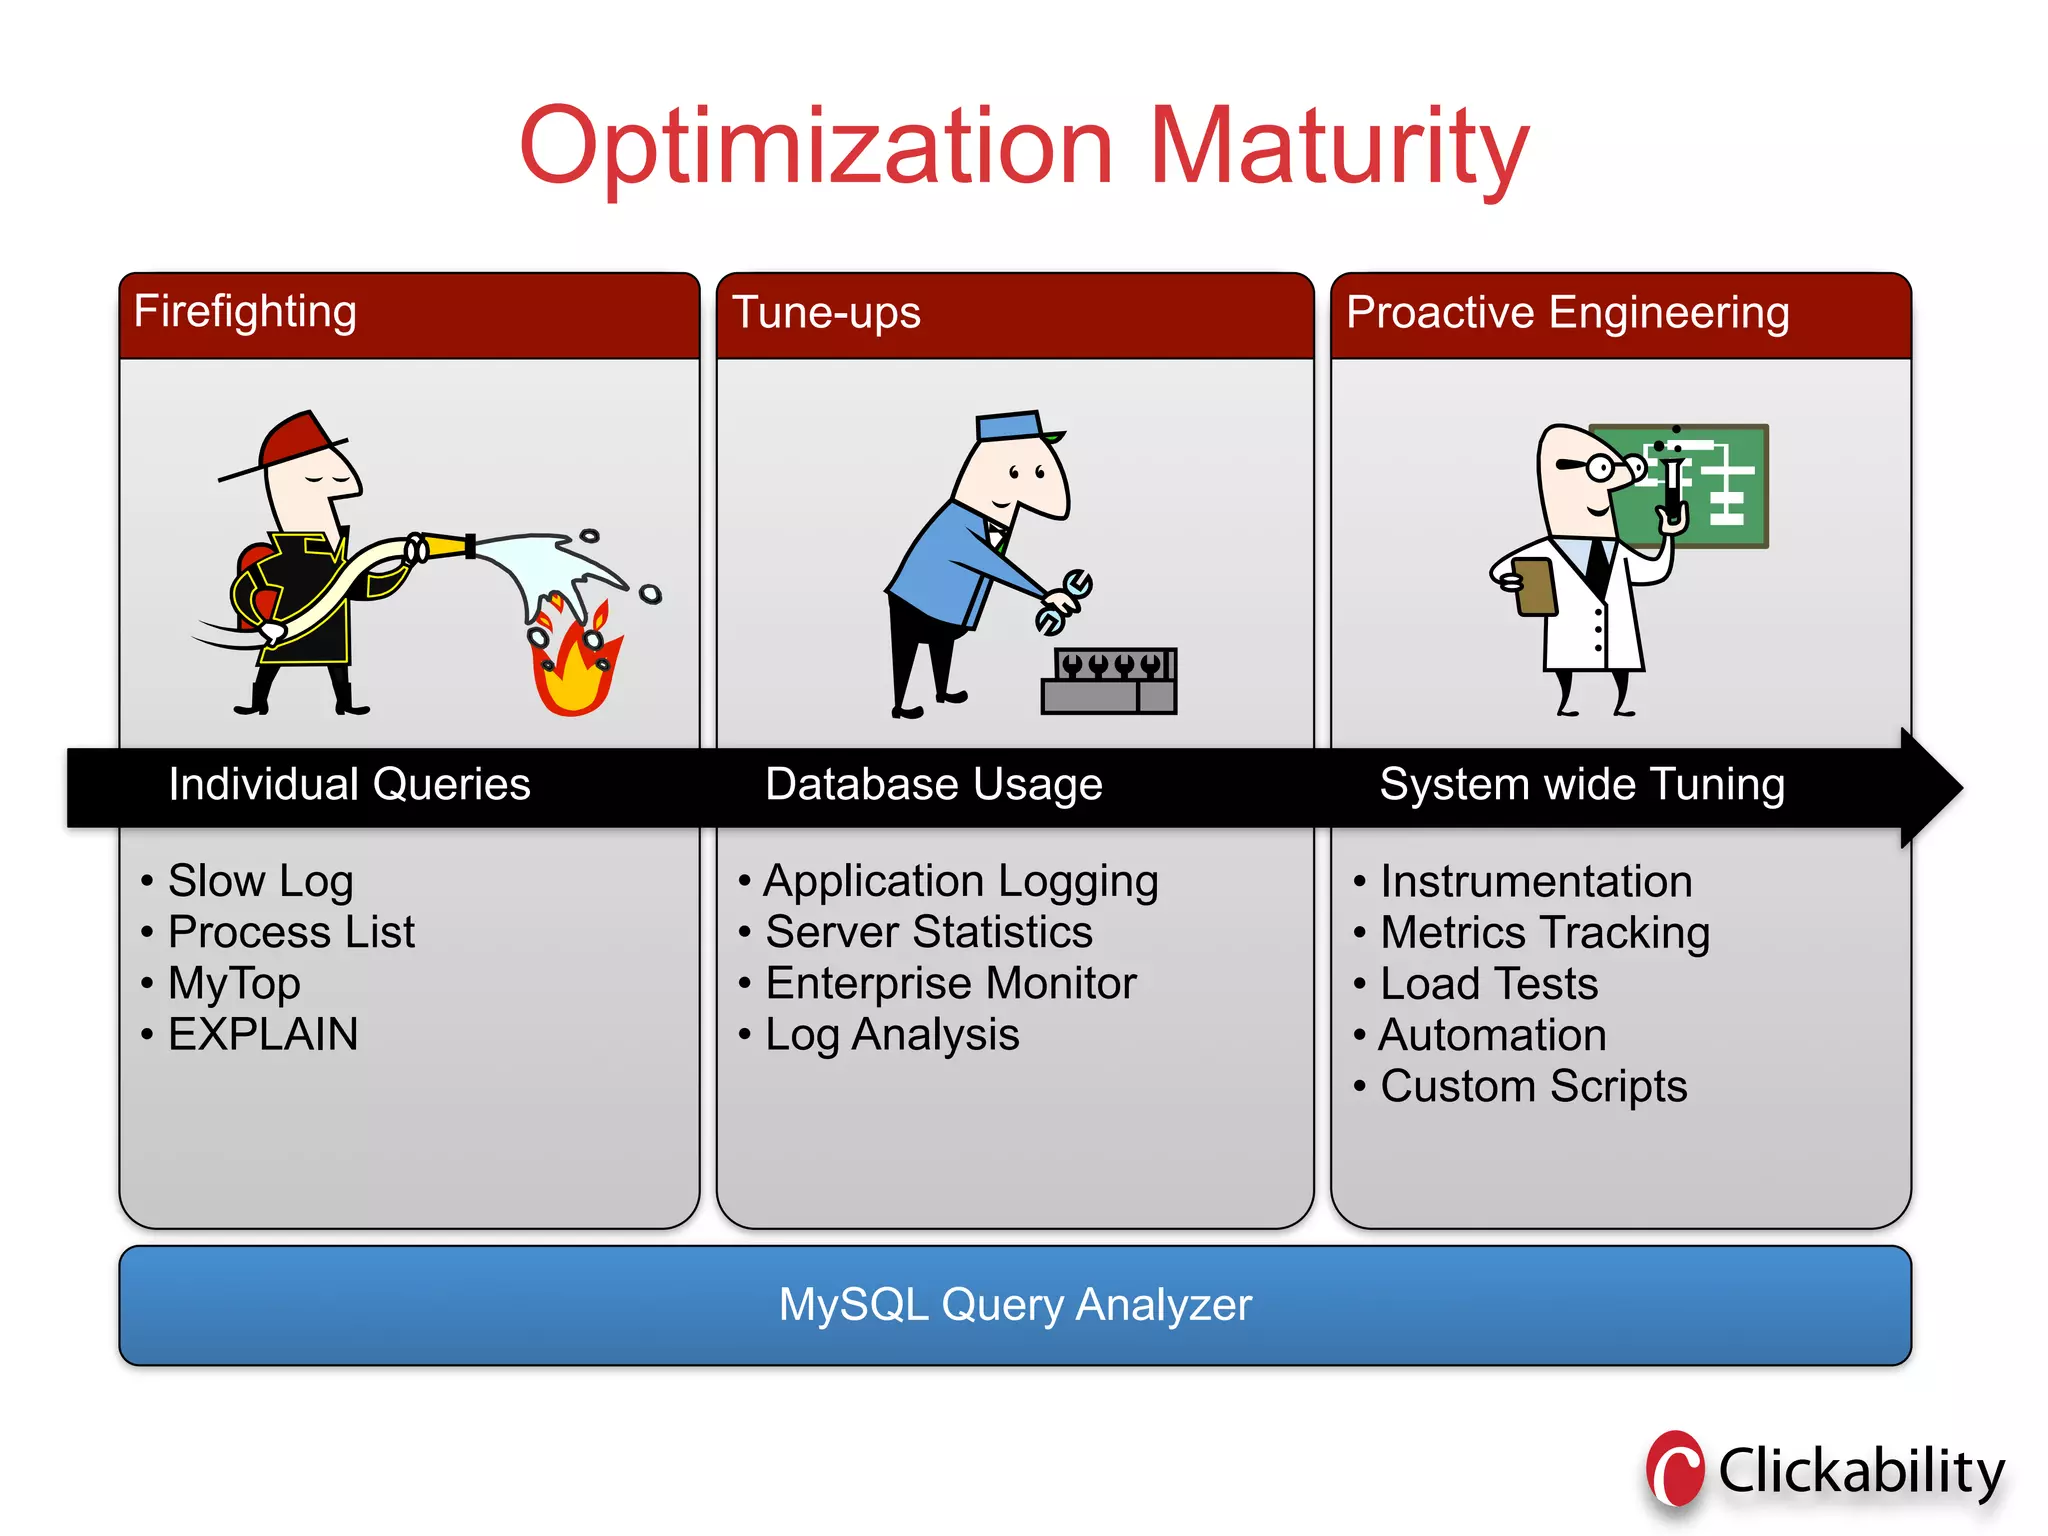
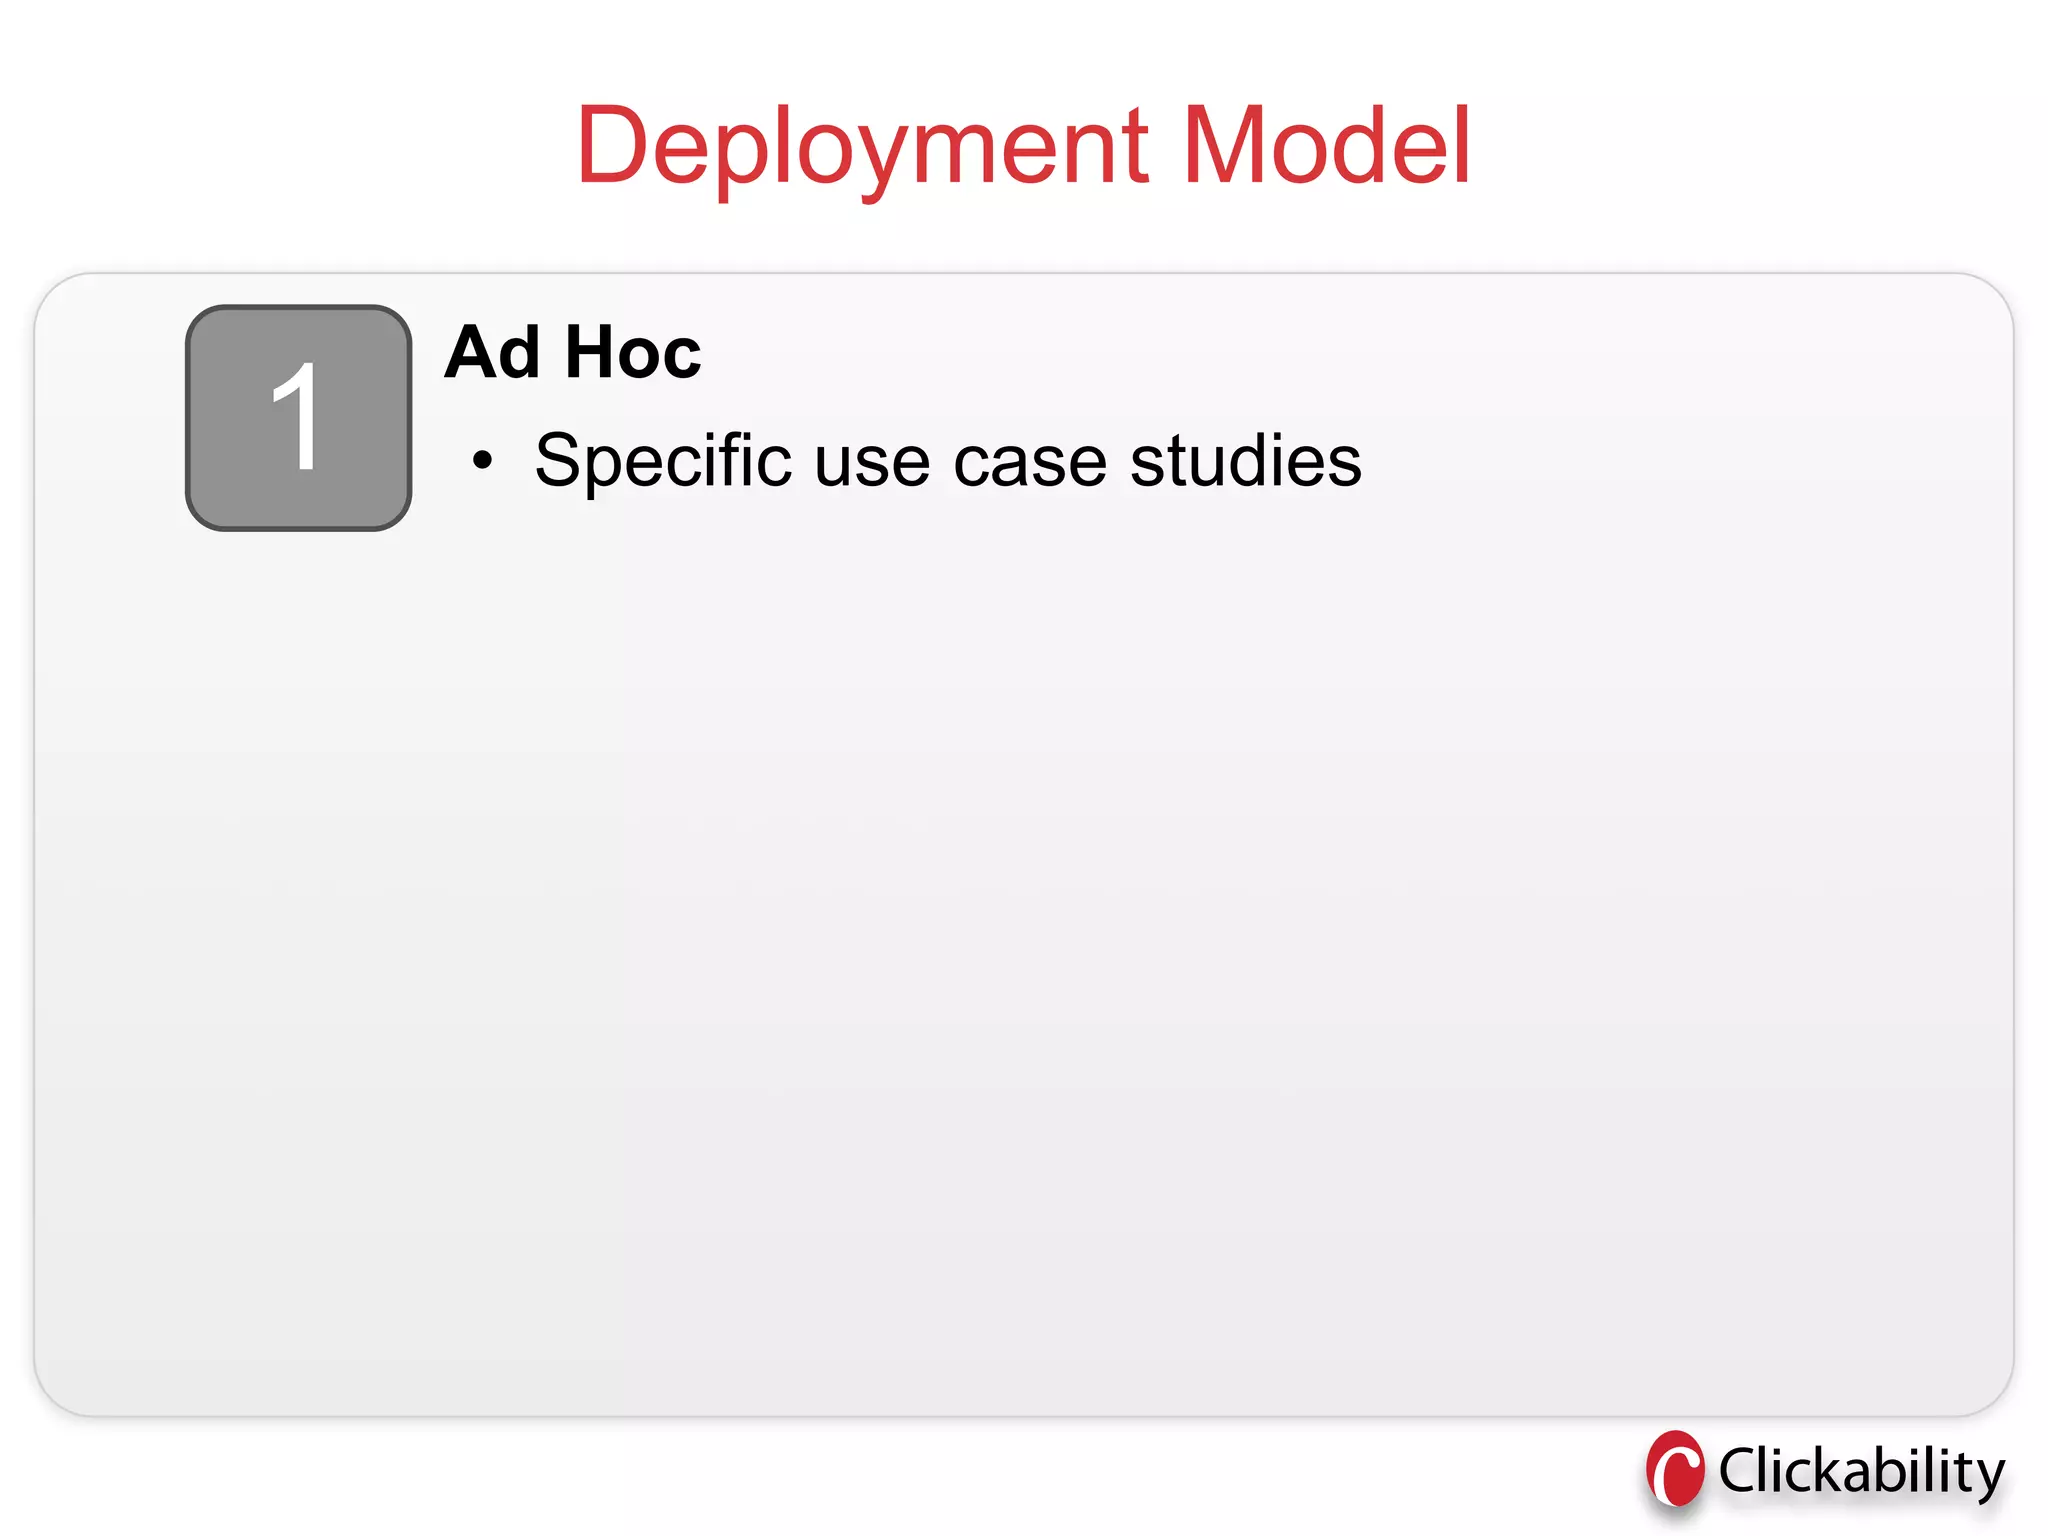
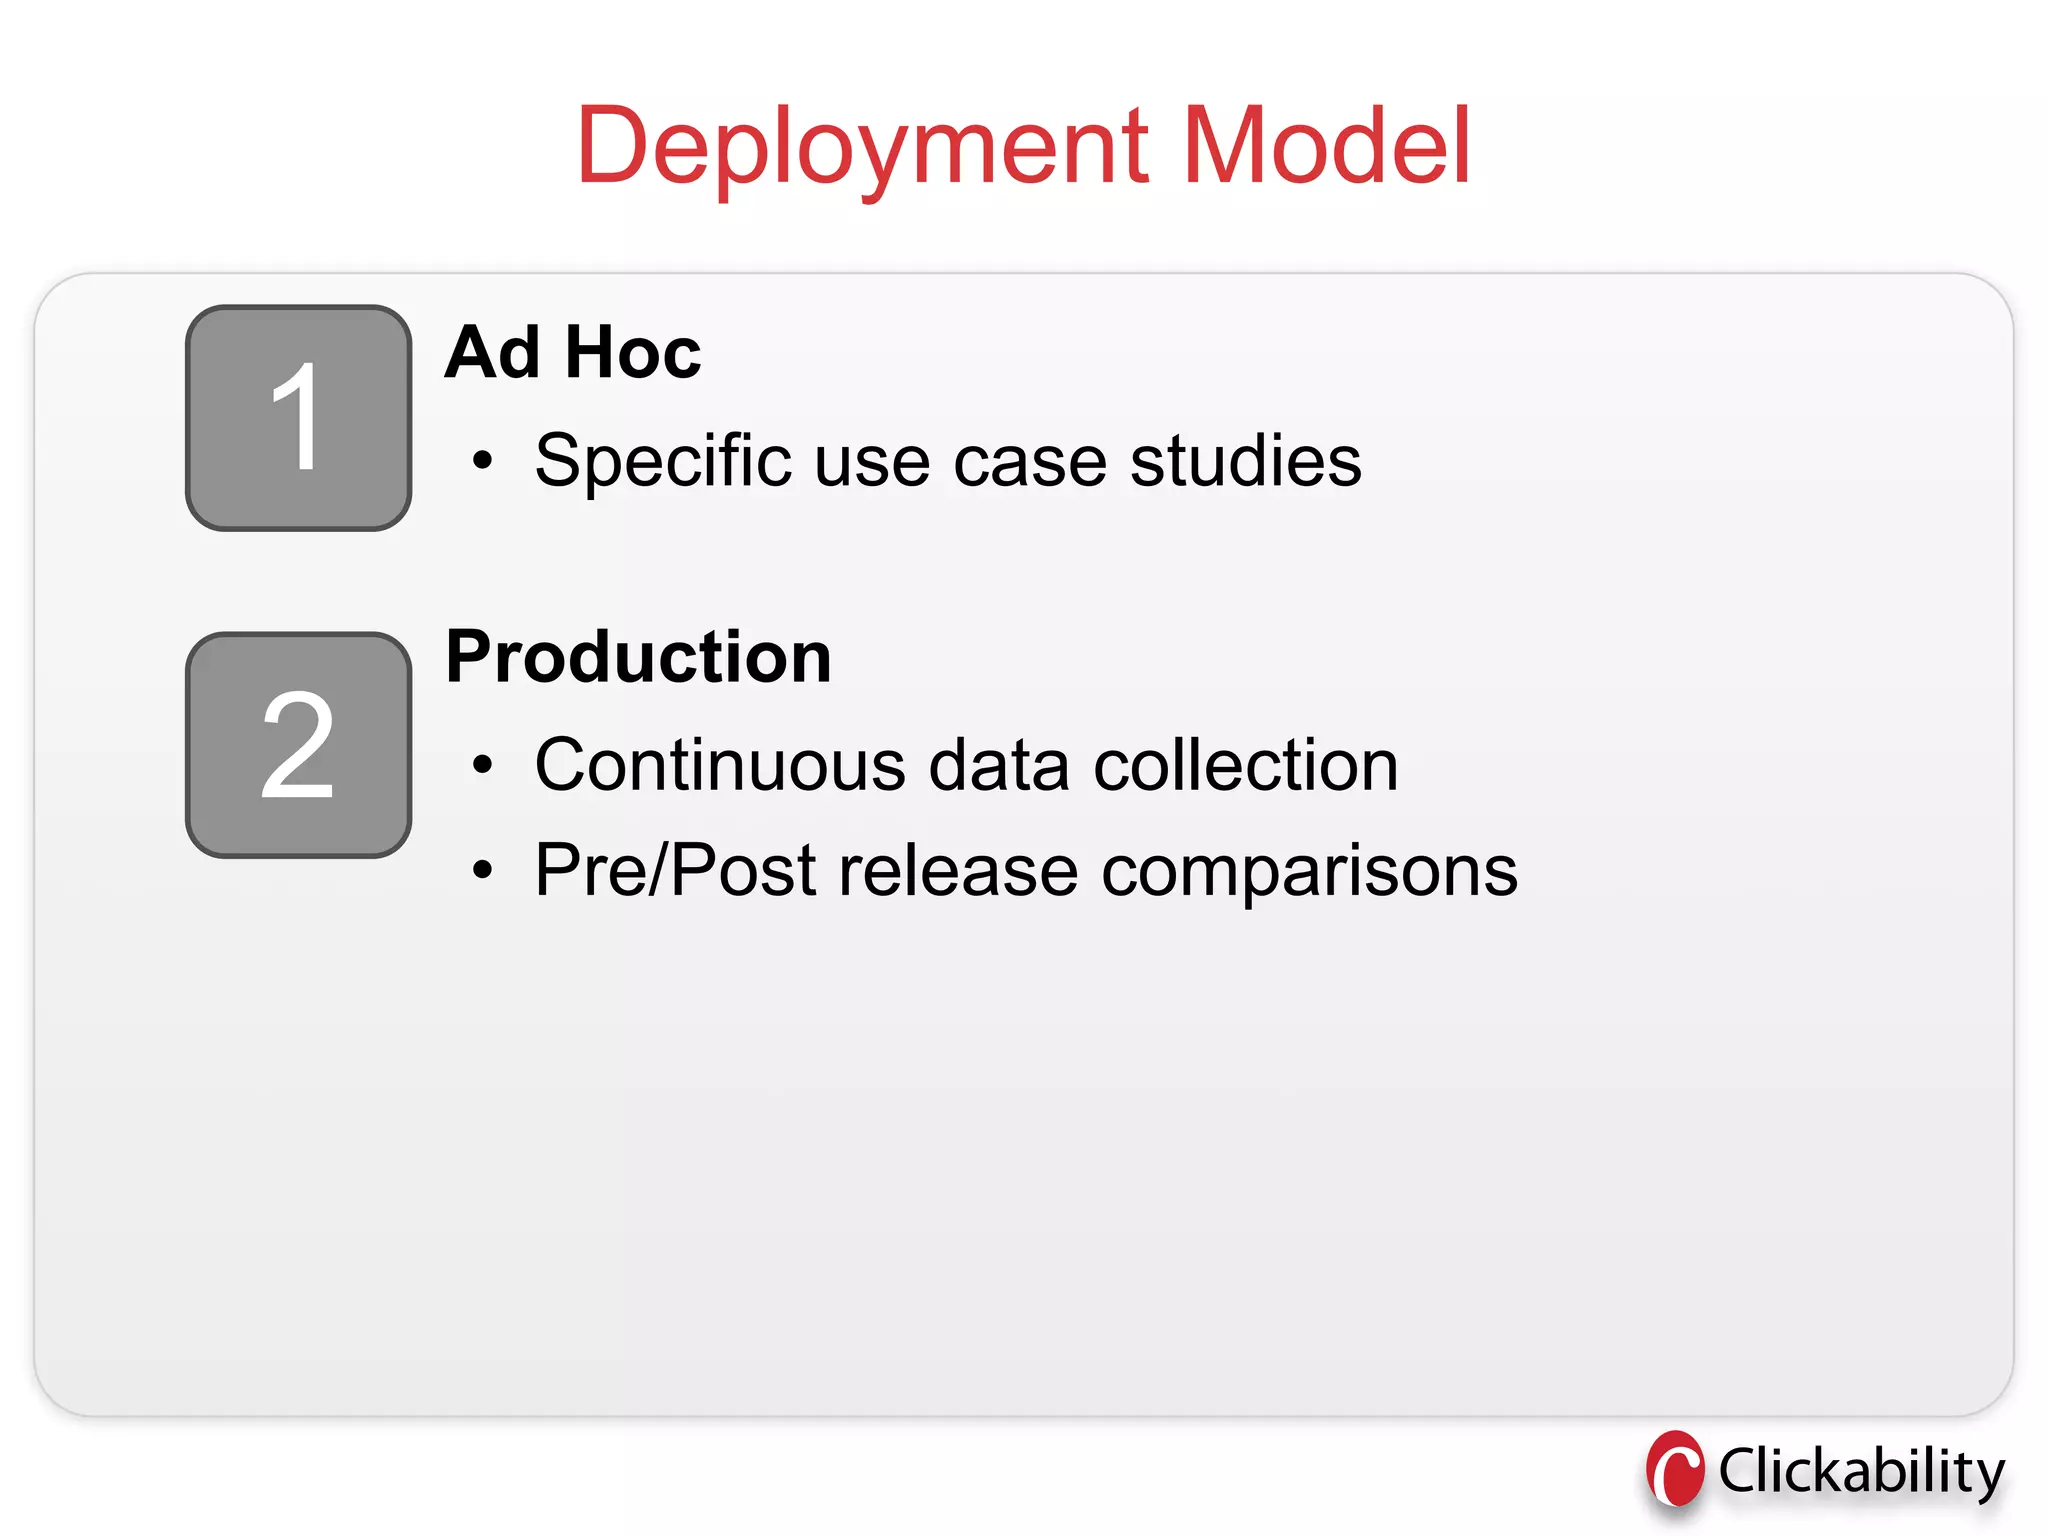
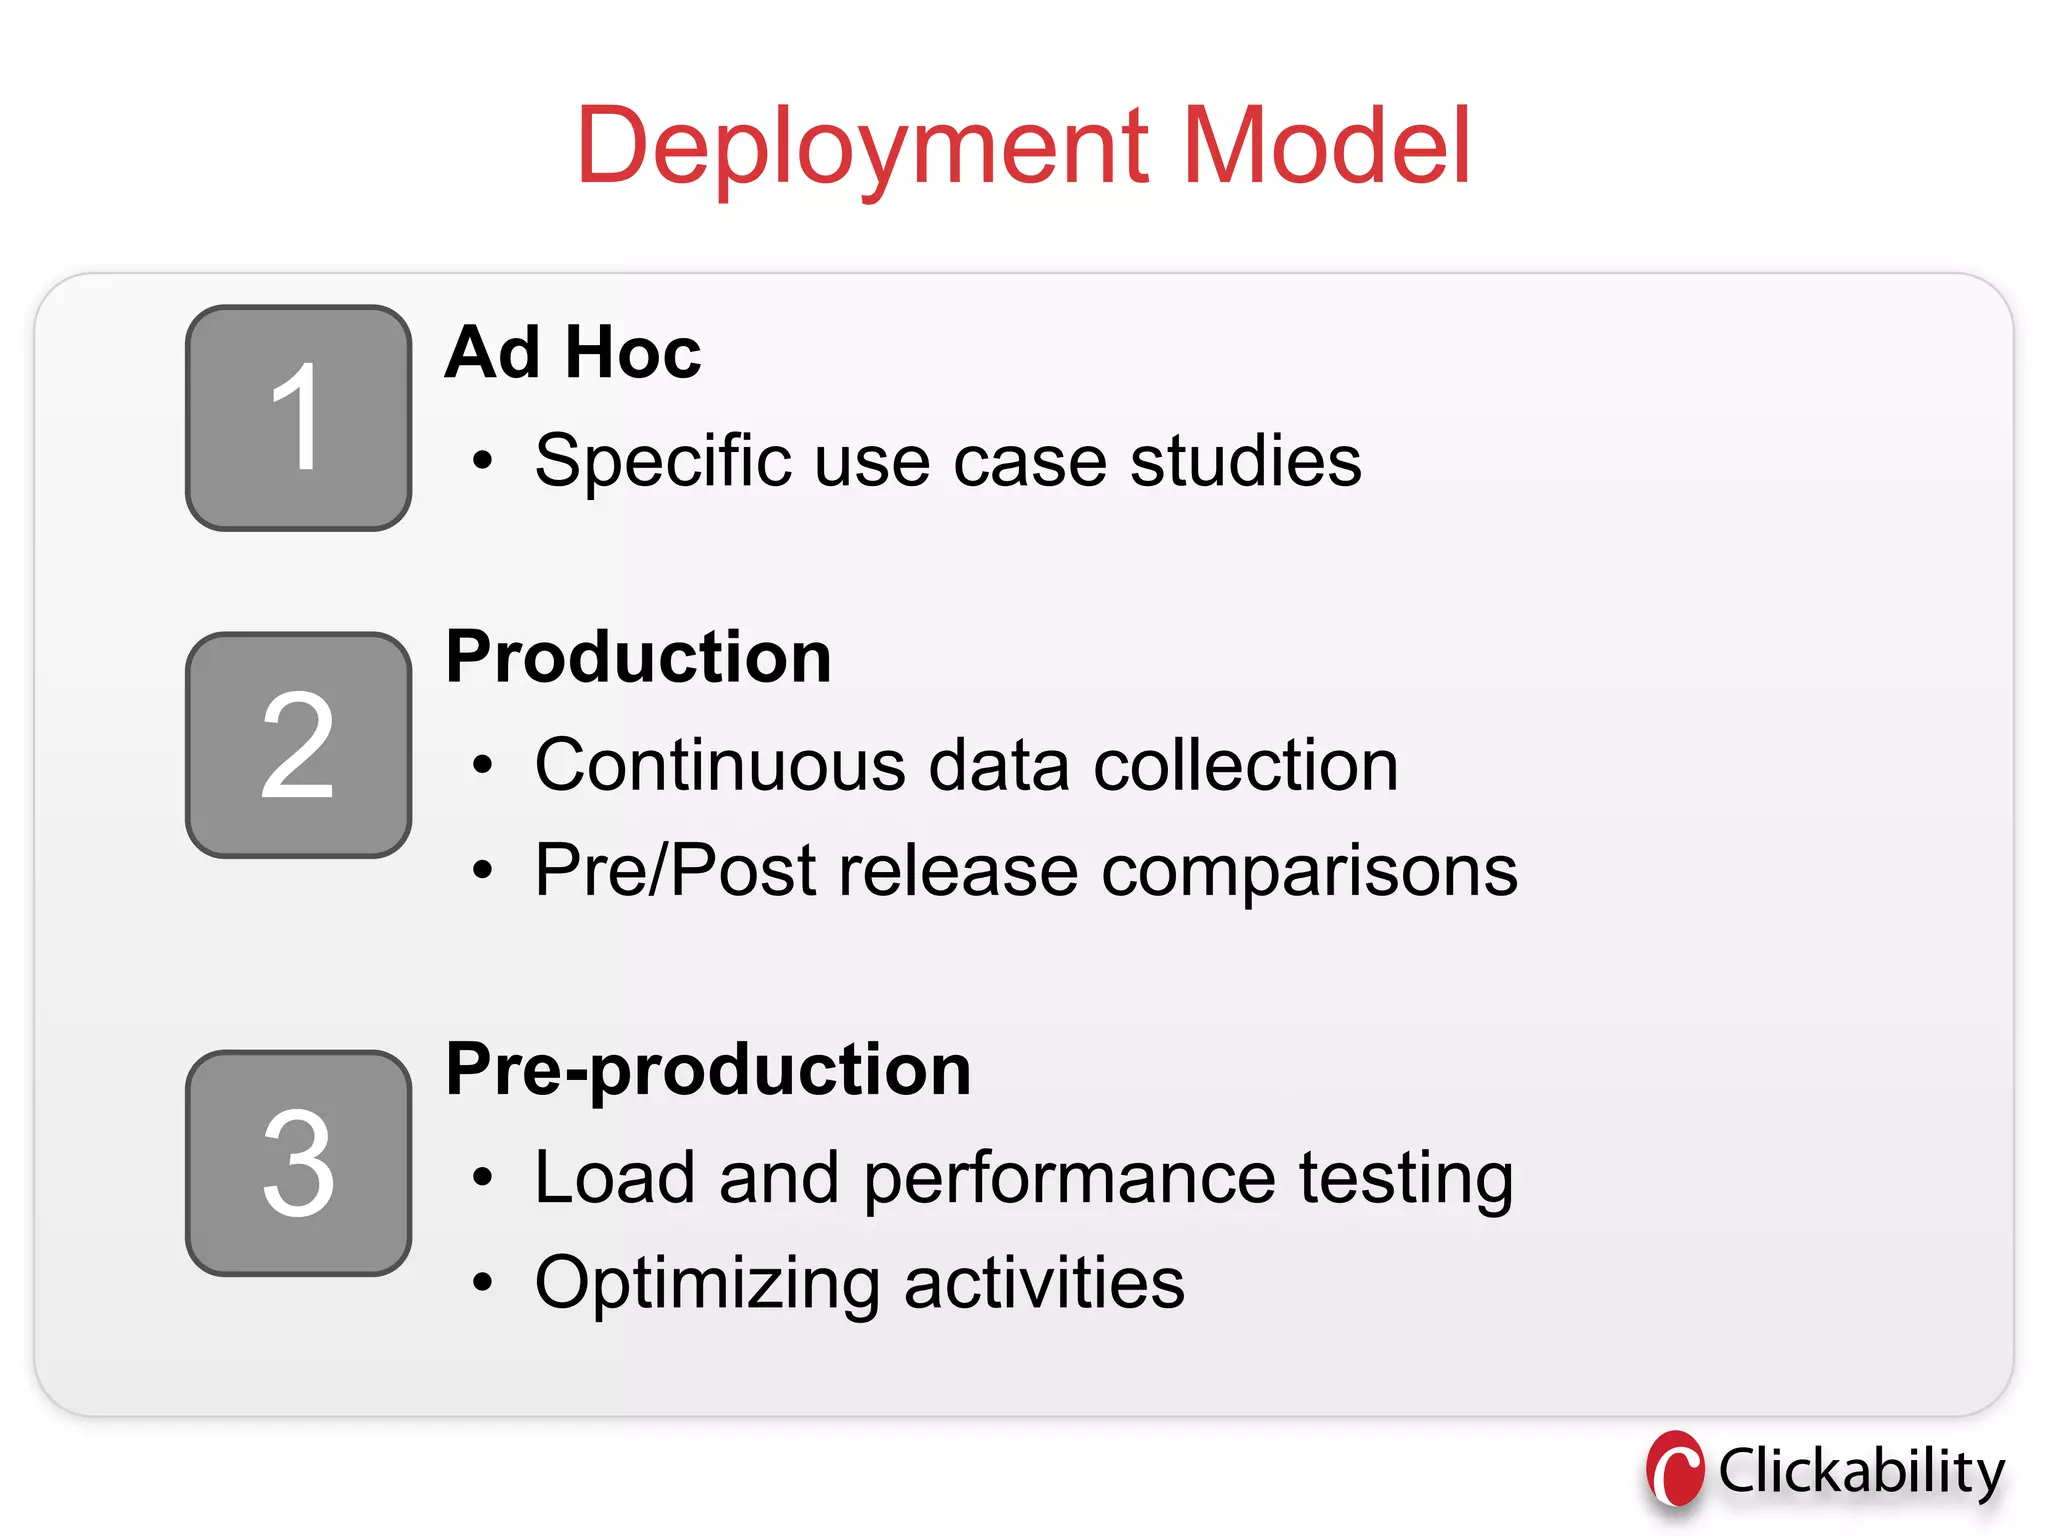
<Insert Picture Here> Efficient Performance Analysis and Tuning with MySQL Enterprise Monitor Mark Matthews, Principal Software Developer, Oracle Jeff Freund, CEO and CTO, Clickability
The following is intended to outline our general product direction. It is intended for information purposes only, and may not be incorporated into any contract. It is not a commitment to deliver any material, code, or functionality, and should not be relied upon in making purchasing decisions. The development, release, and timing of any features or functionality described for Oracle’s products remains at the sole discretion of Oracle. 2
Agenda • Performance Analysis - When and Why <Insert Picture Here> • Data Store Performance Issues • Finding Them - The Classic Approach • The MySQL Enterprise Monitor-Based Approach • How Clickability uses MySQL Query Analyzer • Wrap-Up 3
Performance Analysis - When and Why • Development – Are we meeting performance requirements? – Are we meeting design standards? – Framework, stack surprises... • Quality Assurance – Diagnose performance problems under load – Analyze new functionality’s performance impact – Find errors, warnings before production • Production – Building a “pulse” of the deployed environment – Fighting fires (outages, storms, errors) 4
Data Store Performance Issues • The usual suspects – Missing, dropped or bad index – Contention – Sub-optimal configuration(s) • The sneakier suspects – Statements executed too often – Statements executed in vain, with errors – Statements touching too many rows – New application or functionality deployed without operation team’s knowledge 5
Finding the Performance Issues - The Classic Way 6
“Fun” Starts With: Notification Type: CRITICAL Service: 10.x.x.x; MYSQL State: UP Address: 10.x.x.x Info: temporary_objects 900m | temporary_objects=900m;60;40 thread_cache_hitrate_now=200m connections_per_sec=0.03 Date/Time: Thu Sep 16 20:01:16 CST 2010 7
Leading To the “Trailhead”.... 8
First Try the Slow Query Log... /Users/Mark/oow-demo/enterprise/monitor/mysql/bin/mysqld, Version: 5.1.48-enterprise-commercial-advanced-log (MySQL Enterprise Server - Advanced Edition (Commercial)). started with: Tcp port: 13306 Unix socket: /Users/Mark/oow-demo/enterprise/ monitor/mysql/tmp/mysql.sock Time Id Command Argument 9
If You’re “Lucky”, It’s In the General Log... klinkerbrick:data Mark$ ls -l mysqld.log -rw-rw---- 1 _mysql _mysql 112014183 Sep 17 10:01 mysqld.log 10
Anybody Have Mad awk, sed or Perl Skills Here? • Post-process the general log (if it’s even available) to get query counts • We end up with a culprit similar to: – SELECT foo FROM bar WHERE baz_id=1 ORDER BY date_added DESC • Or if using an ORM – SELECT barclass0_.foo as foo_1_3 FROM bar barclass0_ WHERE barclass0_.baz_id=1 ORDER BY barclass0_.date_added DESC 11
Find and Fix • Missing index – Log into the database and EXPLAIN the query • Statement still executes often, can it be cached? • What code is executing it (and why?) 12
Remember those ORMs? • SELECT barclass0_.foo as foo_1_3 FROM bar barclass0_ WHERE barclass0_.baz_id=1 ORDER BY barclass0_.date_added DESC • sortedBar = s.createFilter( baz.getBars (), "order by this.dateAdded desc" ).list(); 13
Everyone Has Coding Standards • $query = sprintf(“SELECT foo “ + “FROM bar “ + “WHERE baz_id=’%s’” + “ ORDER BY date_added DESC”, mysql_real_escape_string($bazId)); 14
Help !??? • Anybody good with awk, sed, grep and/or Perl? 15
There Has to Be an Easier Way? • The issues – Not integrated – No correlation between notice, analysis and diagnosis – Often not realtime (for queries at least) – Limits the types of problems that can be found and diagnosed – Quickly becomes complex – The analysis buck often stops at the MySQL server itself 16
Enterprise Monitor- Based Approach 17
What is MySQL Enterprise Monitor? • Provides pro-active monitoring and alerting for your MySQL environment • Part of the MySQL Enterprise subscription • Deployed in your environment 18
Why MySQL Enterprise Monitor is More Efficient • Combines performance analysis, alerting and diagnosis • Provides remedies to many common misconfigurations through advisors • Can find more types of data store performance killers • Essentially a data warehouse of your MySQL servers’ health, performance and behavior over time • Analysis, diagnosis available through more levels of the stack 19
MySQL Enterprise Monitor 2.0 Architecture Any Application (via embedded MySQL Enterprise Agent Proxy) MySQL Proxy Performance and Management Data MySQL Database MySQL Enterprise Monitor Dashboard 20
MySQL Enterprise Monitor 2.2 Architecture Any Application (via embedded MySQL Proxy) Enterprise Agent MySQL Proxy Performance and Management Data MySQL Database Java or .Net Application with Connector Plugin Performance and Management Data MySQL Enterprise Monitor Dashboard 21
MySQL Enterprise Monitor 2.3 (CY11) Architecture Any Application (via embedded MySQL Proxy) Enterprise Agent MySQL Proxy PHP or C Application Aggregator with Connector Plugin or application integration Performance and Performance Data Management Data MySQL Database Java or .Net Application with Connector Plugin (2.2) Performance and Management Data MySQL Enterprise Monitor Dashboard 22
Imagine Multiplied by Scale.... 23
The Real World 24
SaaS Web Content Management and Delivery Best Content Best Content Management Solution Management Solution
Clickability Overview • Global Leader in On Demand Web Content Management • Serving 8000+ users who manage 400+ websites around the world • Delivers 600M+ page views per month
Optimization Maturity
Optimization Maturity Firefighting Individual Queries • Slow Log • Process List • MyTop • EXPLAIN
Optimization Maturity Firefighting Tune-ups Individual Queries Database Usage • Slow Log • Application Logging • Process List • Server Statistics • MyTop • Enterprise Monitor • EXPLAIN • Log Analysis
Optimization Maturity Firefighting Tune-ups Proactive Engineering Individual Queries Database Usage System wide Tuning • Slow Log • Application Logging • Instrumentation • Process List • Server Statistics • Metrics Tracking • MyTop • Enterprise Monitor • Load Tests • EXPLAIN • Log Analysis • Automation • Custom Scripts
Optimization Maturity Firefighting Tune-ups Proactive Engineering Individual Queries Database Usage System wide Tuning • Slow Log • Application Logging • Instrumentation • Process List • Server Statistics • Metrics Tracking • MyTop • Enterprise Monitor • Load Tests • EXPLAIN • Log Analysis • Automation • Custom Scripts MySQL Query Analyzer
Deployment Model
Deployment Model • Ad Hoc 1 • Specific use case studies
Deployment Model • Ad Hoc 1 • Specific use case studies • Production 2 • Continuous data collection • Pre/Post release comparisons
Deployment Model • Ad Hoc 1 • Specific use case studies • Production 2 • Continuous data collection • Pre/Post release comparisons • Pre-production 3 • Load and performance testing • Optimizing activities
Usage of Query Analyzer Data
Usage of Query Analyzer Data Query Analyzer UI • Ad Hoc studies • Manual Inspection
Usage of Query Analyzer Data Query Analyzer UI Custom Scripts • Ad Hoc studies • Comparison analysis • Manual Inspection • Difference in counts • New queries
Usage of Query Analyzer Data Query Analyzer UI Custom Scripts Monitoring Tools • Ad Hoc studies • Comparison analysis • Coming soon! • Manual Inspection • Difference in counts • Thresholds and Alerts • New queries • Trend analysis
Deployment Model: Production …. App Server Applications IPTable Routing: • No proxy • Data collection Databases MySQL Proxy port 4040 Data collection MySQL port 3306 MySQL Enterprise Monitor Data pruning scripts
Deployment Model: Production …. App Server Applications IPTable Routing: • No proxy • Data collection Databases MySQL Proxy port 4040 Data collection MySQL port 3306 MySQL Enterprise Monitor Data pruning scripts Next Steps: Convert to JDBC Driver deployment model.
Deployment Model: Pre-Production Load Test Data Analysis Scripts App Server JDBC Driver / MySQL Enterprise Plugin Data Collection via HTTP MySQL MySQL Enterprise Monitor Data archiving/pruning scripts
Deployment Model: Pre-Production Load Test Data Analysis Scripts App Server JDBC Driver / MySQL Enterprise Plugin Data Collection via HTTP MySQL MySQL Enterprise Monitor Data archiving/pruning scripts Next Steps: - Embed load tests in Continuous Integration server - Monitoring with Nagios/Cacti.
Case Study: Cache Optimization Databases Website Publisher Published Websites Java WebApp Local object Caches
Case Study: Cache Optimization Databases Website Publisher Published Websites Java WebApp Local object Caches Objective: Optimize the “linked content” cache to lower database load, measured in terms of execution count for expensive queries.
Case Study: Cache Optimization Databases Website Publisher Published Websites Java WebApp Local object Caches Objective: Optimize the “linked content” cache to lower database load, measured in terms of execution count for expensive queries. Tuning Parameters: Size of Cache, TTL of Cache
Case Study: Cache Optimization Databases Website Publisher Published Websites Java WebApp Local object Caches Objective: Optimize the “linked content” cache to lower database load, measured in terms of execution count for expensive queries. Tuning Parameters: Size of Cache, TTL of Cache Tradeoffs: Java Memory vs. Database query load
Case Study: Test Results 1500 One specific “high cost” query was Linked Content TTL = 10mins watched to evaluate cache TTL impact on database load. Queries per Minute 1125 750 375 0 0 60 120 Minutes
Case Study: Test Results 700 One specific “high cost” query was watched through several tests to Avg. Queries per Minute evaluate cache TTL impact on 525 database load. 350 175 0 1 5 10 20 30 40 50 60 Cache TTL in Minutes
Wrap Up 35
Performance Analysis with MySQL Enterprise Monitor is More Efficient • Multi-dimensional, integrated and correlated system – Less complex to install and maintain • Analysis, diagnosis available through more levels of the stack – Getting to the root cause can be quicker • Can find more types of data store performance issues • Remedies to many common misconfigurations – “Wingman” to those responsible for your MySQL Installation 36
Questions? 37
38
39

Efficient Performance Analysis and Tuning with MySQL Enterprise Monitor

  • 1.
    <Insert Picture Here> EfficientPerformance Analysis and Tuning with MySQL Enterprise Monitor Mark Matthews, Principal Software Developer, Oracle Jeff Freund, CEO and CTO, Clickability
  • 2.
    The following isintended to outline our general product direction. It is intended for information purposes only, and may not be incorporated into any contract. It is not a commitment to deliver any material, code, or functionality, and should not be relied upon in making purchasing decisions. The development, release, and timing of any features or functionality described for Oracle’s products remains at the sole discretion of Oracle. 2
  • 3.
    Agenda • Performance Analysis - When and Why <Insert Picture Here> • Data Store Performance Issues • Finding Them - The Classic Approach • The MySQL Enterprise Monitor-Based Approach • How Clickability uses MySQL Query Analyzer • Wrap-Up 3
  • 4.
    Performance Analysis -When and Why • Development – Are we meeting performance requirements? – Are we meeting design standards? – Framework, stack surprises... • Quality Assurance – Diagnose performance problems under load – Analyze new functionality’s performance impact – Find errors, warnings before production • Production – Building a “pulse” of the deployed environment – Fighting fires (outages, storms, errors) 4
  • 5.
    Data Store PerformanceIssues • The usual suspects – Missing, dropped or bad index – Contention – Sub-optimal configuration(s) • The sneakier suspects – Statements executed too often – Statements executed in vain, with errors – Statements touching too many rows – New application or functionality deployed without operation team’s knowledge 5
  • 6.
    Finding the PerformanceIssues - The Classic Way 6
  • 7.
    “Fun” Starts With: NotificationType: CRITICAL Service: 10.x.x.x; MYSQL State: UP Address: 10.x.x.x Info: temporary_objects 900m | temporary_objects=900m;60;40 thread_cache_hitrate_now=200m connections_per_sec=0.03 Date/Time: Thu Sep 16 20:01:16 CST 2010 7
  • 8.
    Leading To the“Trailhead”.... 8
  • 9.
    First Try theSlow Query Log... /Users/Mark/oow-demo/enterprise/monitor/mysql/bin/mysqld, Version: 5.1.48-enterprise-commercial-advanced-log (MySQL Enterprise Server - Advanced Edition (Commercial)). started with: Tcp port: 13306 Unix socket: /Users/Mark/oow-demo/enterprise/ monitor/mysql/tmp/mysql.sock Time Id Command Argument 9
  • 10.
    If You’re “Lucky”,It’s In the General Log... klinkerbrick:data Mark$ ls -l mysqld.log -rw-rw---- 1 _mysql _mysql 112014183 Sep 17 10:01 mysqld.log 10
  • 11.
    Anybody Have Madawk, sed or Perl Skills Here? • Post-process the general log (if it’s even available) to get query counts • We end up with a culprit similar to: – SELECT foo FROM bar WHERE baz_id=1 ORDER BY date_added DESC • Or if using an ORM – SELECT barclass0_.foo as foo_1_3 FROM bar barclass0_ WHERE barclass0_.baz_id=1 ORDER BY barclass0_.date_added DESC 11
  • 12.
    Find and Fix •Missing index – Log into the database and EXPLAIN the query • Statement still executes often, can it be cached? • What code is executing it (and why?) 12
  • 13.
    Remember those ORMs? •SELECT barclass0_.foo as foo_1_3 FROM bar barclass0_ WHERE barclass0_.baz_id=1 ORDER BY barclass0_.date_added DESC • sortedBar = s.createFilter( baz.getBars (), "order by this.dateAdded desc" ).list(); 13
  • 14.
    Everyone Has CodingStandards • $query = sprintf(“SELECT foo “ + “FROM bar “ + “WHERE baz_id=’%s’” + “ ORDER BY date_added DESC”, mysql_real_escape_string($bazId)); 14
  • 15.
    Help !??? • Anybodygood with awk, sed, grep and/or Perl? 15
  • 16.
    There Has toBe an Easier Way? • The issues – Not integrated – No correlation between notice, analysis and diagnosis – Often not realtime (for queries at least) – Limits the types of problems that can be found and diagnosed – Quickly becomes complex – The analysis buck often stops at the MySQL server itself 16
  • 17.
  • 18.
    What is MySQLEnterprise Monitor? • Provides pro-active monitoring and alerting for your MySQL environment • Part of the MySQL Enterprise subscription • Deployed in your environment 18
  • 19.
    Why MySQL EnterpriseMonitor is More Efficient • Combines performance analysis, alerting and diagnosis • Provides remedies to many common misconfigurations through advisors • Can find more types of data store performance killers • Essentially a data warehouse of your MySQL servers’ health, performance and behavior over time • Analysis, diagnosis available through more levels of the stack 19
  • 20.
    MySQL Enterprise Monitor2.0 Architecture Any Application (via embedded MySQL Enterprise Agent Proxy) MySQL Proxy Performance and Management Data MySQL Database MySQL Enterprise Monitor Dashboard 20
  • 21.
    MySQL Enterprise Monitor2.2 Architecture Any Application (via embedded MySQL Proxy) Enterprise Agent MySQL Proxy Performance and Management Data MySQL Database Java or .Net Application with Connector Plugin Performance and Management Data MySQL Enterprise Monitor Dashboard 21
  • 22.
    MySQL Enterprise Monitor2.3 (CY11) Architecture Any Application (via embedded MySQL Proxy) Enterprise Agent MySQL Proxy PHP or C Application Aggregator with Connector Plugin or application integration Performance and Performance Data Management Data MySQL Database Java or .Net Application with Connector Plugin (2.2) Performance and Management Data MySQL Enterprise Monitor Dashboard 22
  • 23.
  • 24.
  • 25.
    SaaS Web ContentManagement and Delivery Best Content Best Content Management Solution Management Solution
  • 26.
    Clickability Overview • Global Leader in On Demand Web Content Management • Serving 8000+ users who manage 400+ websites around the world • Delivers 600M+ page views per month
  • 27.
  • 28.
    Optimization Maturity Firefighting IndividualQueries • Slow Log • Process List • MyTop • EXPLAIN
  • 29.
    Optimization Maturity Firefighting Tune-ups Individual Queries Database Usage • Slow Log • Application Logging • Process List • Server Statistics • MyTop • Enterprise Monitor • EXPLAIN • Log Analysis
  • 30.
    Optimization Maturity Firefighting Tune-ups Proactive Engineering Individual Queries Database Usage System wide Tuning • Slow Log • Application Logging • Instrumentation • Process List • Server Statistics • Metrics Tracking • MyTop • Enterprise Monitor • Load Tests • EXPLAIN • Log Analysis • Automation • Custom Scripts
  • 31.
    Optimization Maturity Firefighting Tune-ups Proactive Engineering Individual Queries Database Usage System wide Tuning • Slow Log • Application Logging • Instrumentation • Process List • Server Statistics • Metrics Tracking • MyTop • Enterprise Monitor • Load Tests • EXPLAIN • Log Analysis • Automation • Custom Scripts MySQL Query Analyzer
  • 32.
  • 33.
    Deployment Model • Ad Hoc 1 • Specific use case studies
  • 34.
    Deployment Model • Ad Hoc 1 • Specific use case studies • Production 2 • Continuous data collection • Pre/Post release comparisons
  • 35.
    Deployment Model • Ad Hoc 1 • Specific use case studies • Production 2 • Continuous data collection • Pre/Post release comparisons • Pre-production 3 • Load and performance testing • Optimizing activities
  • 36.
    Usage of QueryAnalyzer Data
  • 37.
    Usage of QueryAnalyzer Data Query Analyzer UI • Ad Hoc studies • Manual Inspection
  • 38.
    Usage of QueryAnalyzer Data Query Analyzer UI Custom Scripts • Ad Hoc studies • Comparison analysis • Manual Inspection • Difference in counts • New queries
  • 39.
    Usage of QueryAnalyzer Data Query Analyzer UI Custom Scripts Monitoring Tools • Ad Hoc studies • Comparison analysis • Coming soon! • Manual Inspection • Difference in counts • Thresholds and Alerts • New queries • Trend analysis
  • 40.
    Deployment Model: Production …. App Server Applications IPTable Routing: • No proxy • Data collection Databases MySQL Proxy port 4040 Data collection MySQL port 3306 MySQL Enterprise Monitor Data pruning scripts
  • 41.
    Deployment Model: Production …. App Server Applications IPTable Routing: • No proxy • Data collection Databases MySQL Proxy port 4040 Data collection MySQL port 3306 MySQL Enterprise Monitor Data pruning scripts Next Steps: Convert to JDBC Driver deployment model.
  • 42.
    Deployment Model: Pre-Production Load Test Data Analysis Scripts App Server JDBC Driver / MySQL Enterprise Plugin Data Collection via HTTP MySQL MySQL Enterprise Monitor Data archiving/pruning scripts
  • 43.
    Deployment Model: Pre-Production Load Test Data Analysis Scripts App Server JDBC Driver / MySQL Enterprise Plugin Data Collection via HTTP MySQL MySQL Enterprise Monitor Data archiving/pruning scripts Next Steps: - Embed load tests in Continuous Integration server - Monitoring with Nagios/Cacti.
  • 44.
    Case Study: CacheOptimization Databases Website Publisher Published Websites Java WebApp Local object Caches
  • 45.
    Case Study: CacheOptimization Databases Website Publisher Published Websites Java WebApp Local object Caches Objective: Optimize the “linked content” cache to lower database load, measured in terms of execution count for expensive queries.
  • 46.
    Case Study: CacheOptimization Databases Website Publisher Published Websites Java WebApp Local object Caches Objective: Optimize the “linked content” cache to lower database load, measured in terms of execution count for expensive queries. Tuning Parameters: Size of Cache, TTL of Cache
  • 47.
    Case Study: CacheOptimization Databases Website Publisher Published Websites Java WebApp Local object Caches Objective: Optimize the “linked content” cache to lower database load, measured in terms of execution count for expensive queries. Tuning Parameters: Size of Cache, TTL of Cache Tradeoffs: Java Memory vs. Database query load
  • 48.
    Case Study: TestResults 1500 One specific “high cost” query was Linked Content TTL = 10mins watched to evaluate cache TTL impact on database load. Queries per Minute 1125 750 375 0 0 60 120 Minutes
  • 49.
    Case Study: TestResults 700 One specific “high cost” query was watched through several tests to Avg. Queries per Minute evaluate cache TTL impact on 525 database load. 350 175 0 1 5 10 20 30 40 50 60 Cache TTL in Minutes
  • 50.
  • 51.
    Performance Analysis withMySQL Enterprise Monitor is More Efficient • Multi-dimensional, integrated and correlated system – Less complex to install and maintain • Analysis, diagnosis available through more levels of the stack – Getting to the root cause can be quicker • Can find more types of data store performance issues • Remedies to many common misconfigurations – “Wingman” to those responsible for your MySQL Installation 36
  • 52.
  • 53.
  • 54.