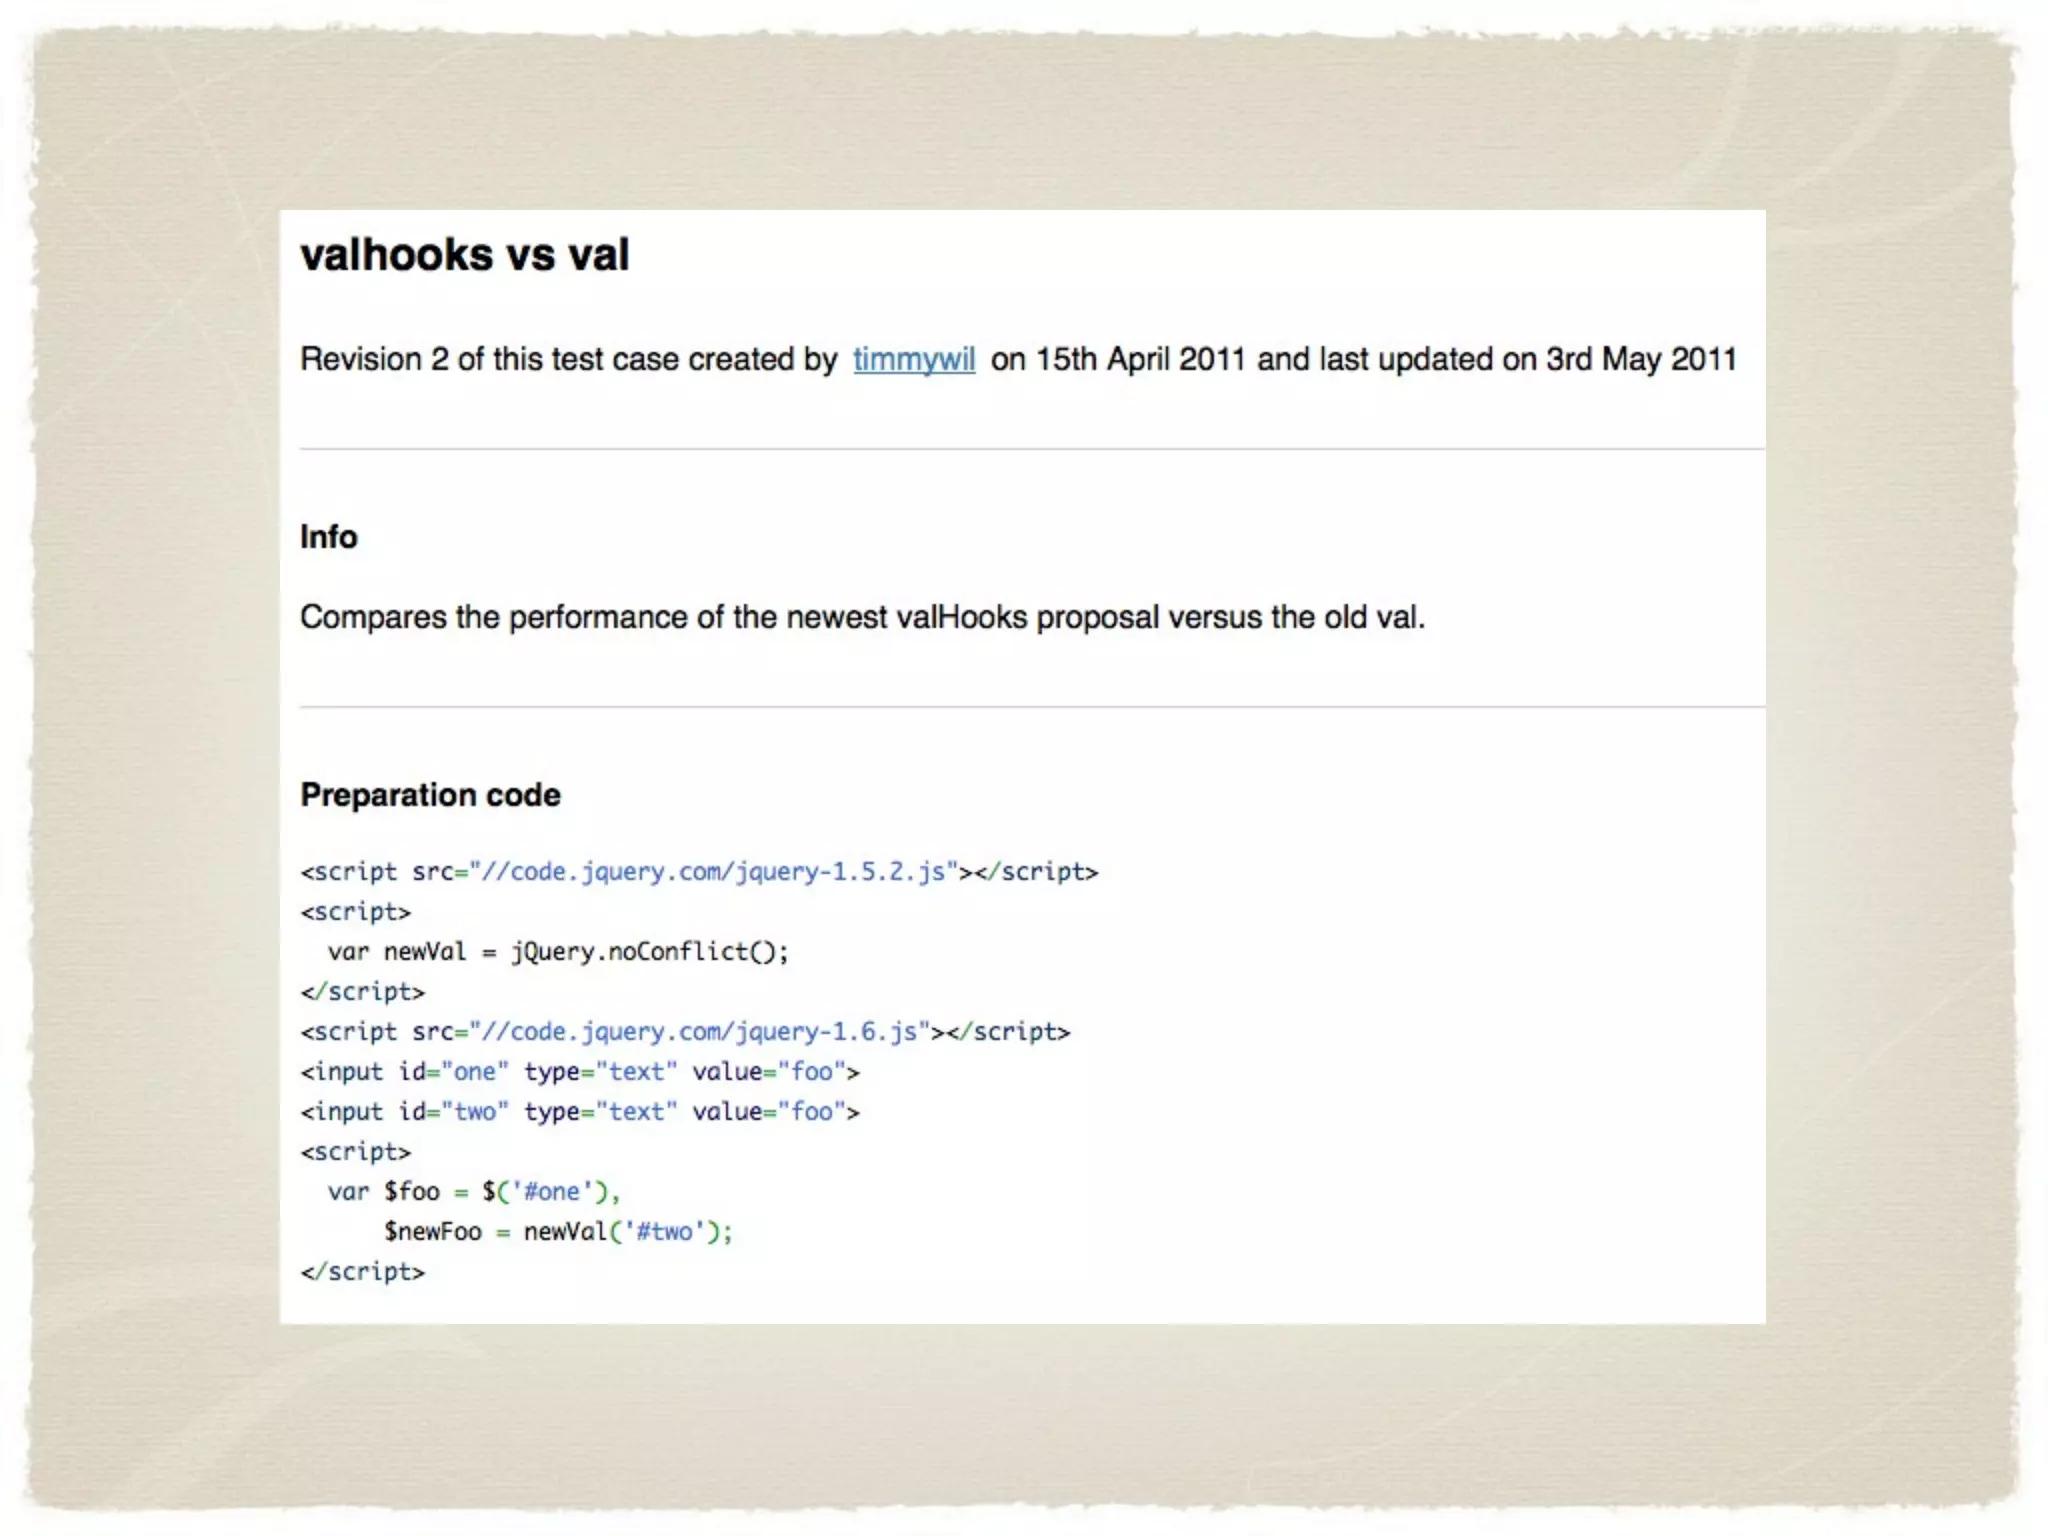
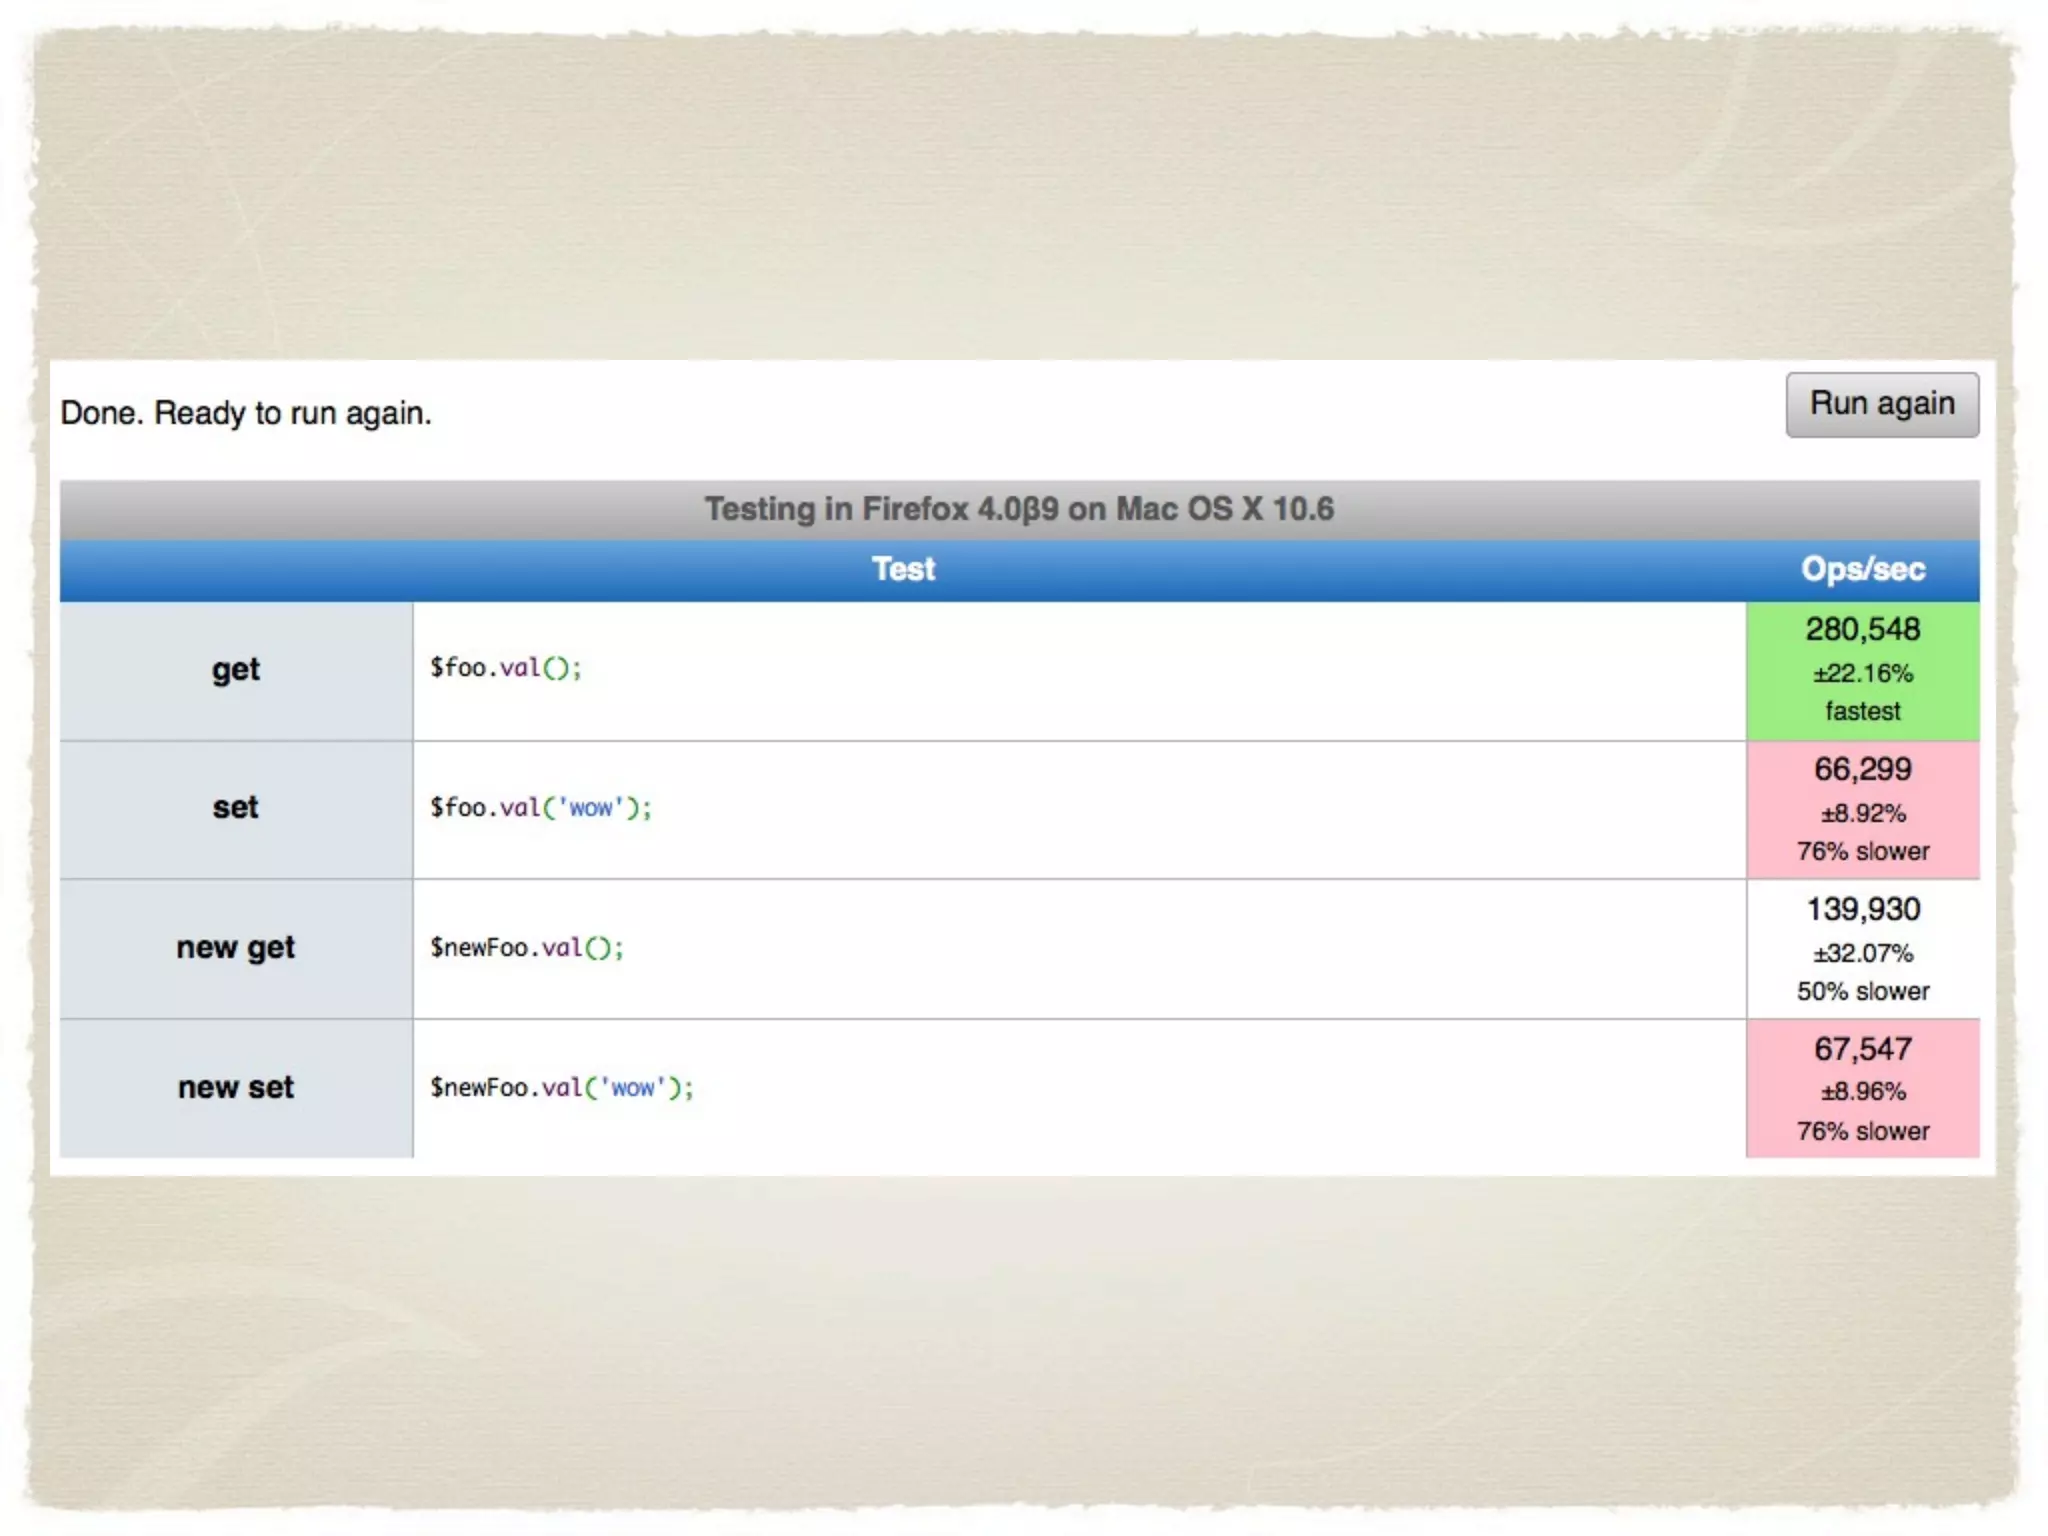
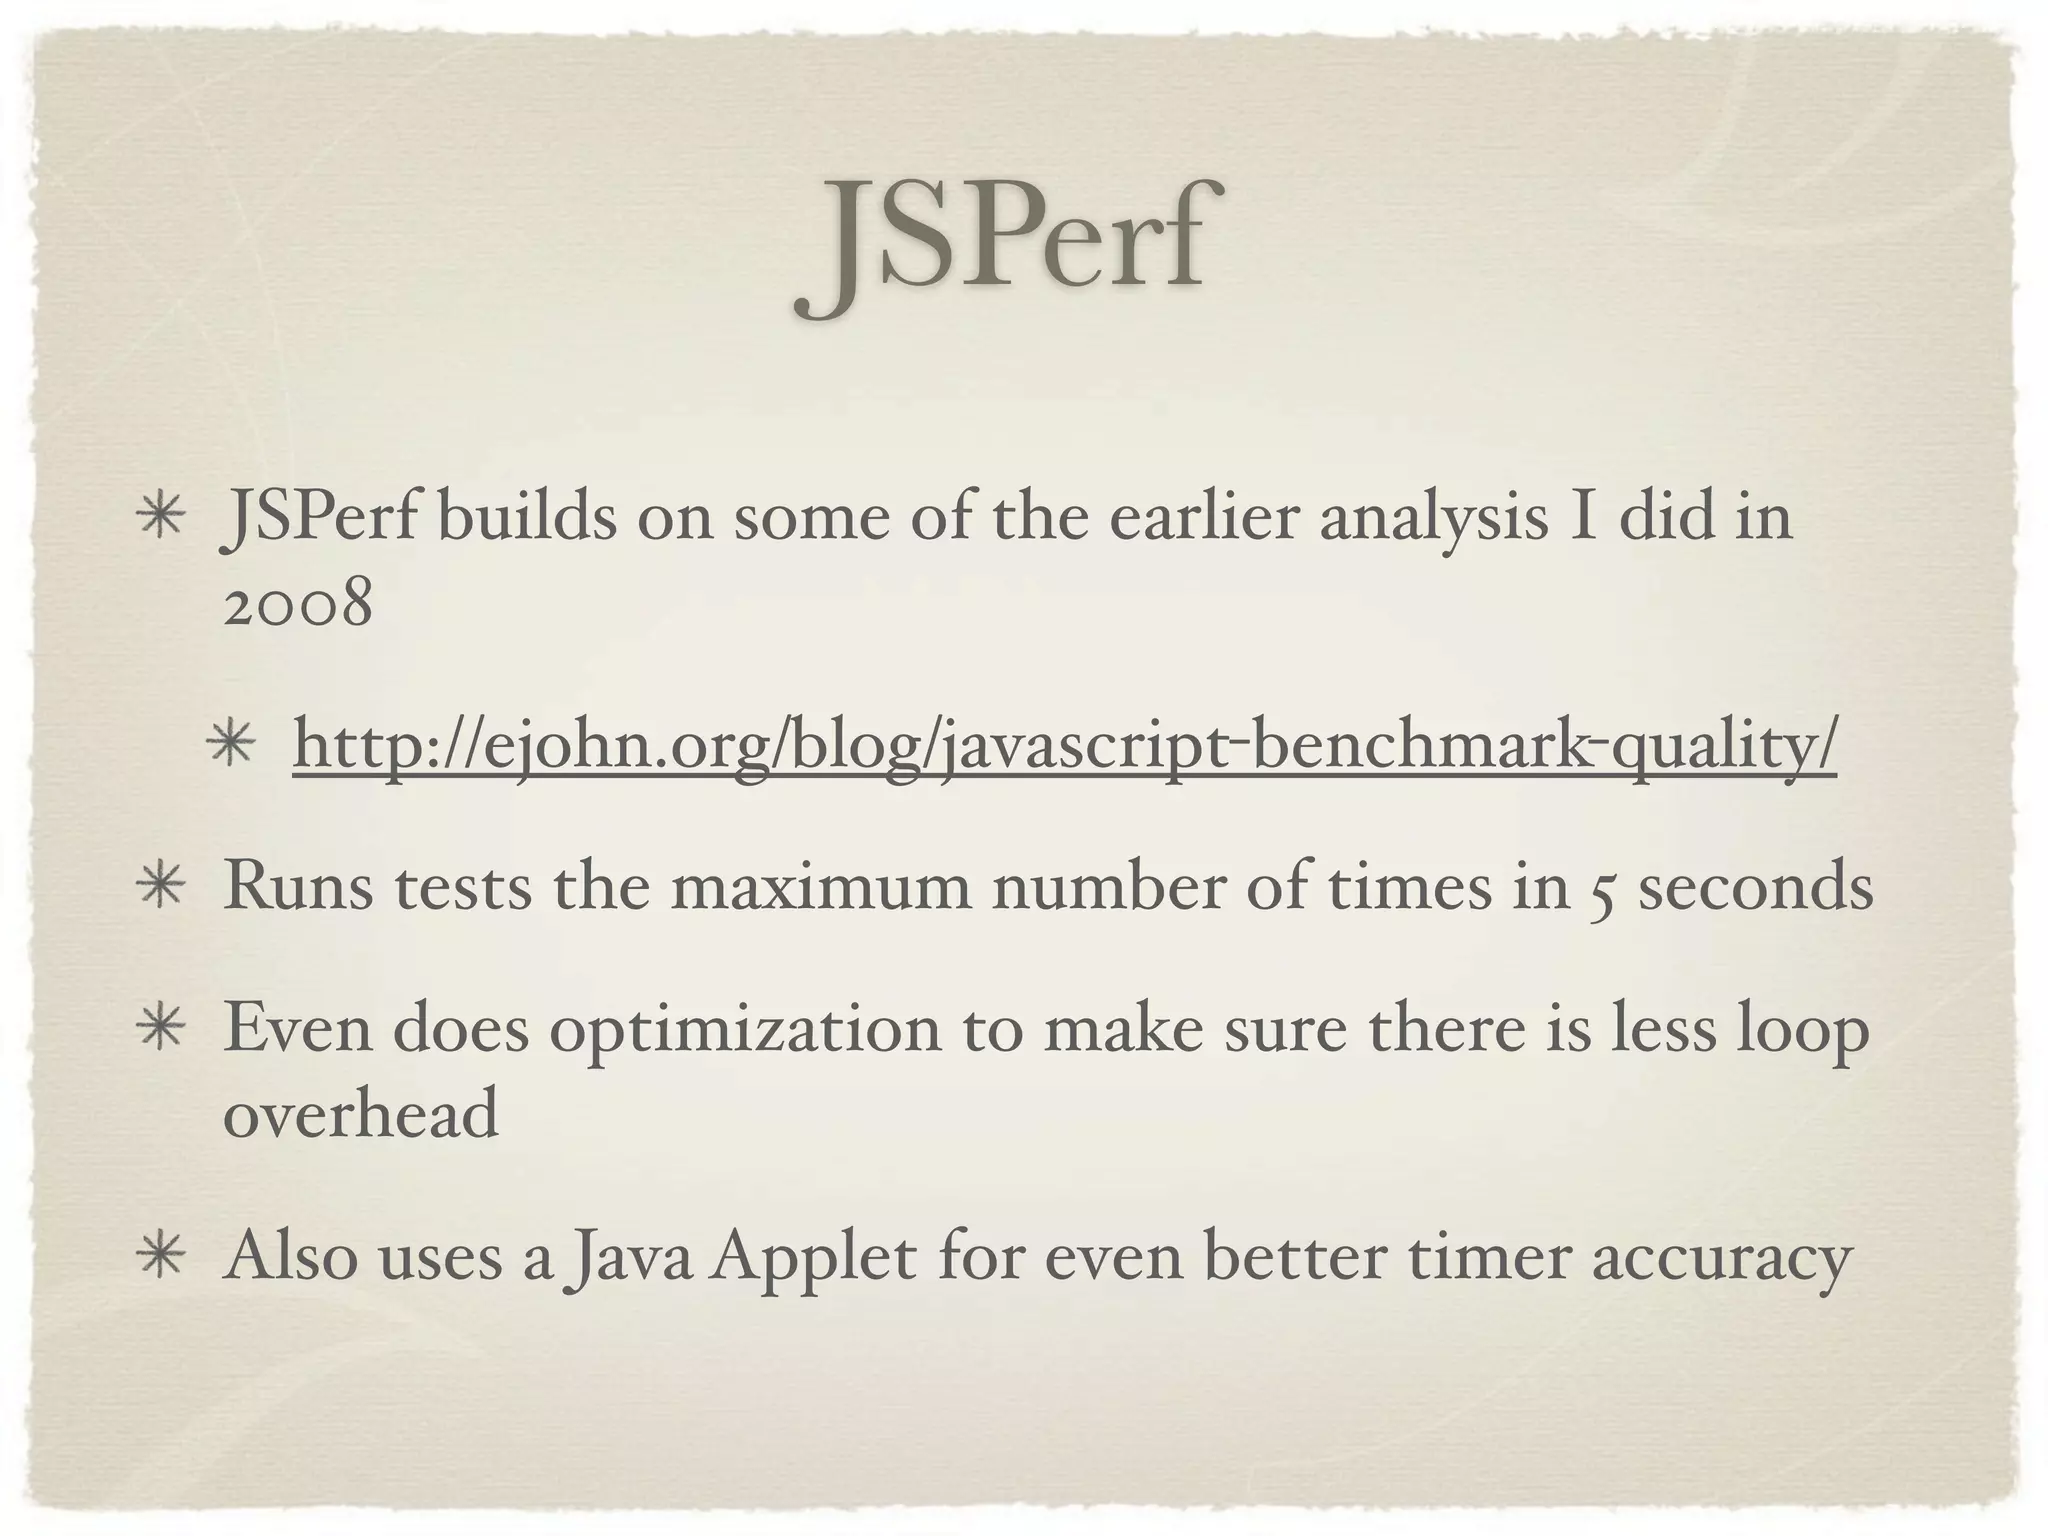
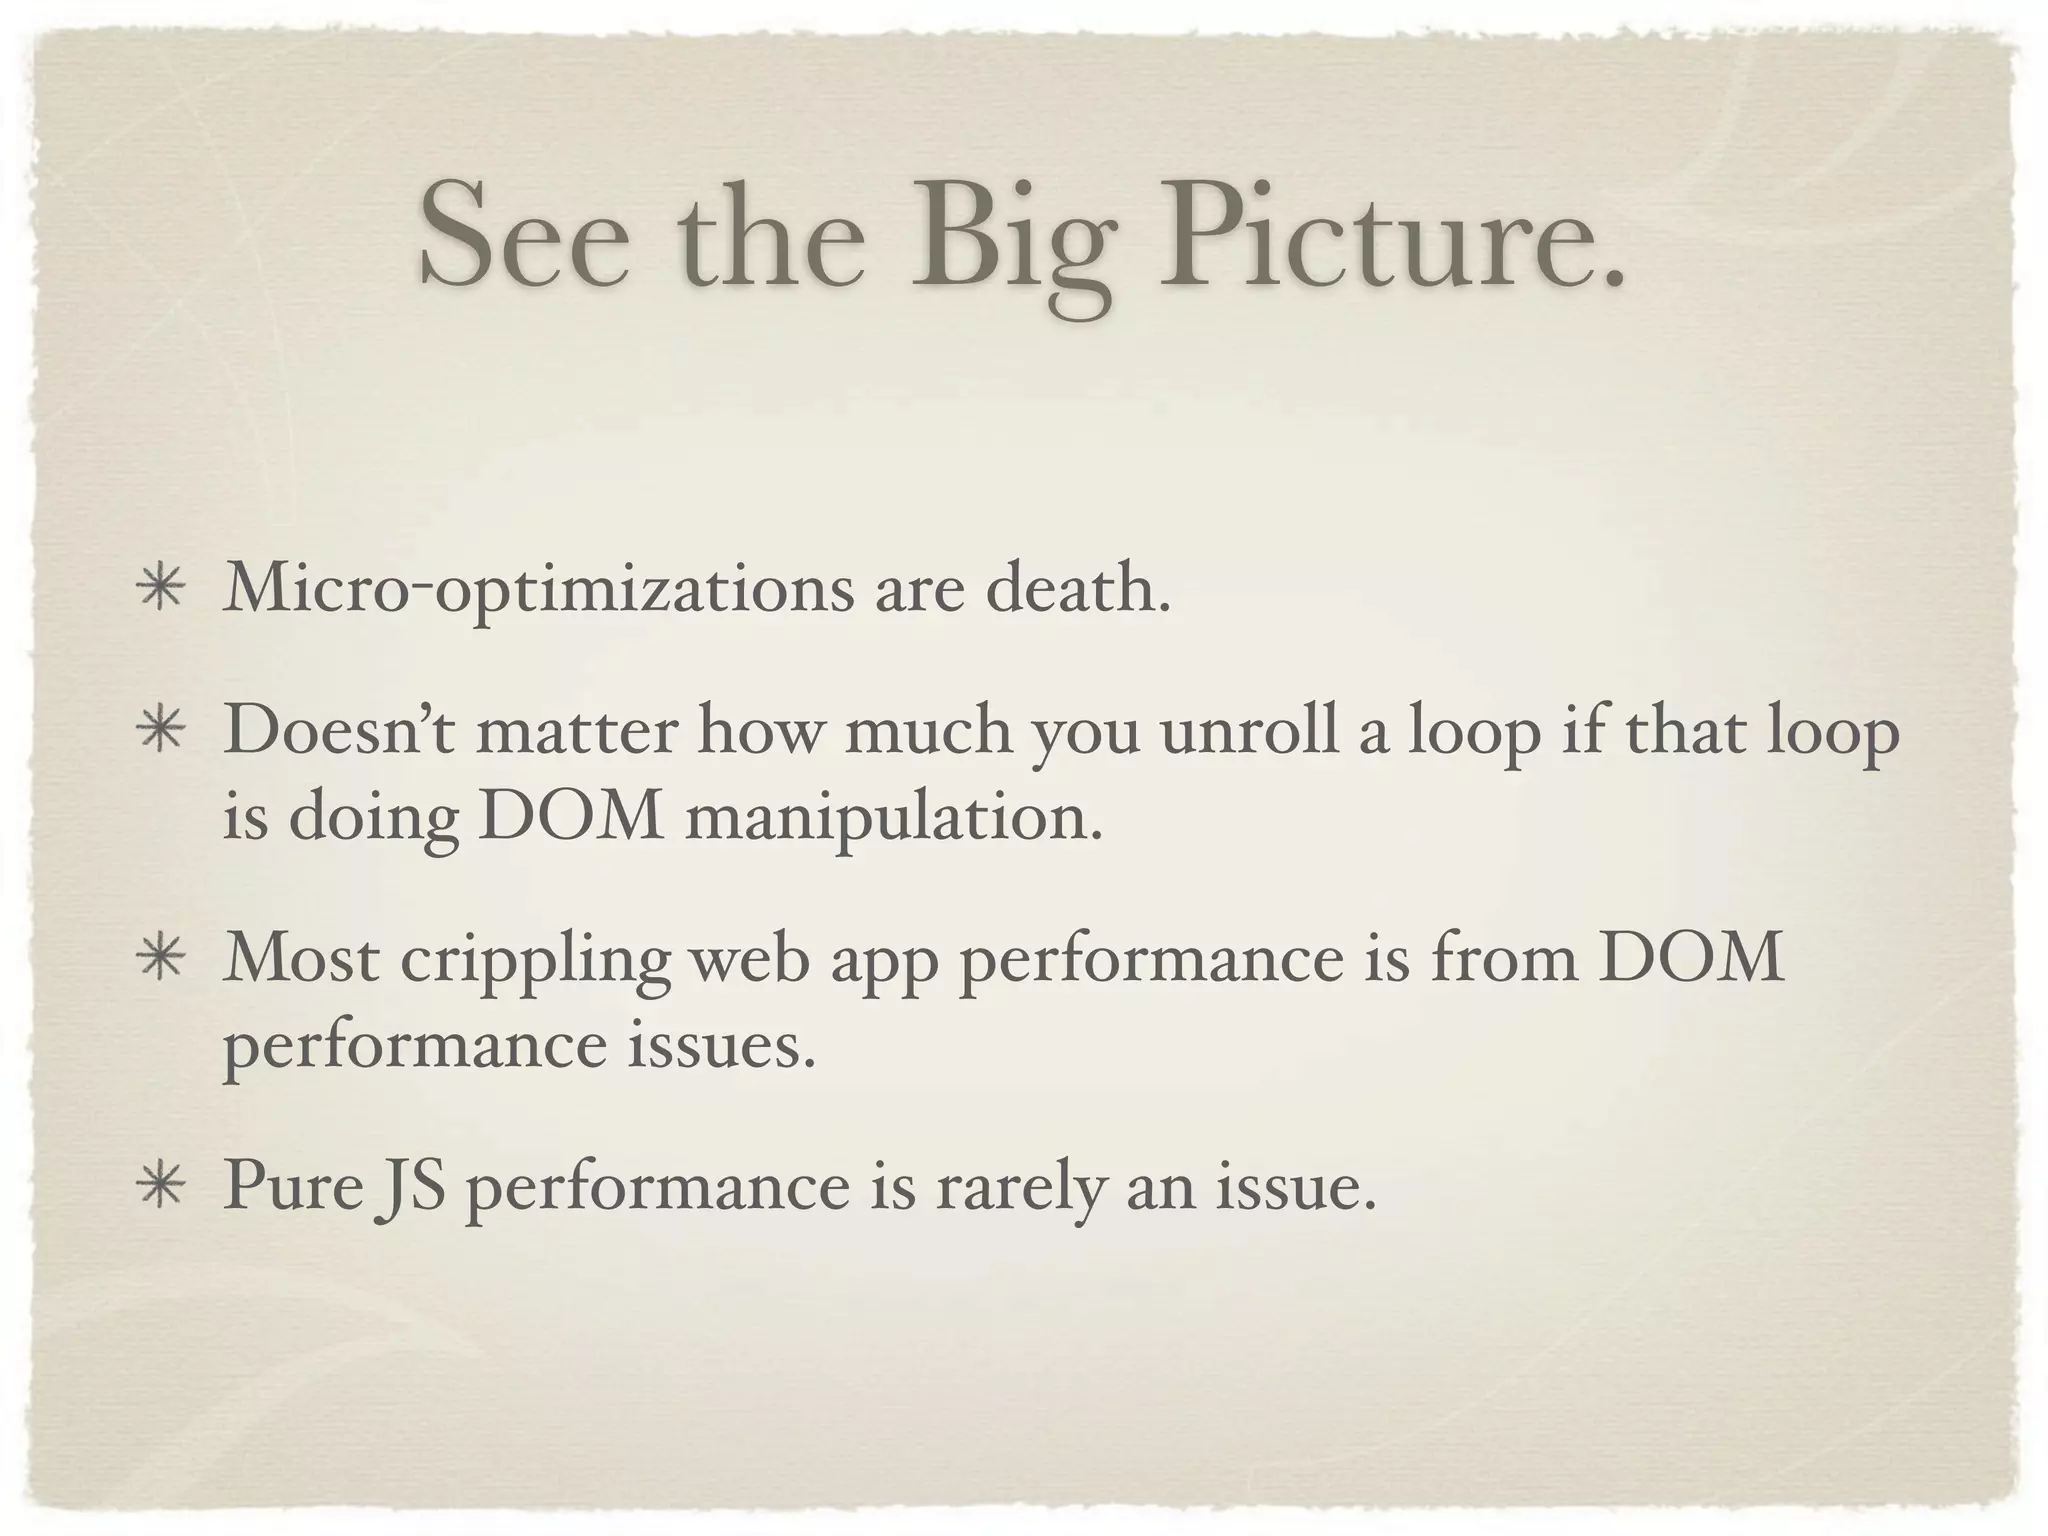
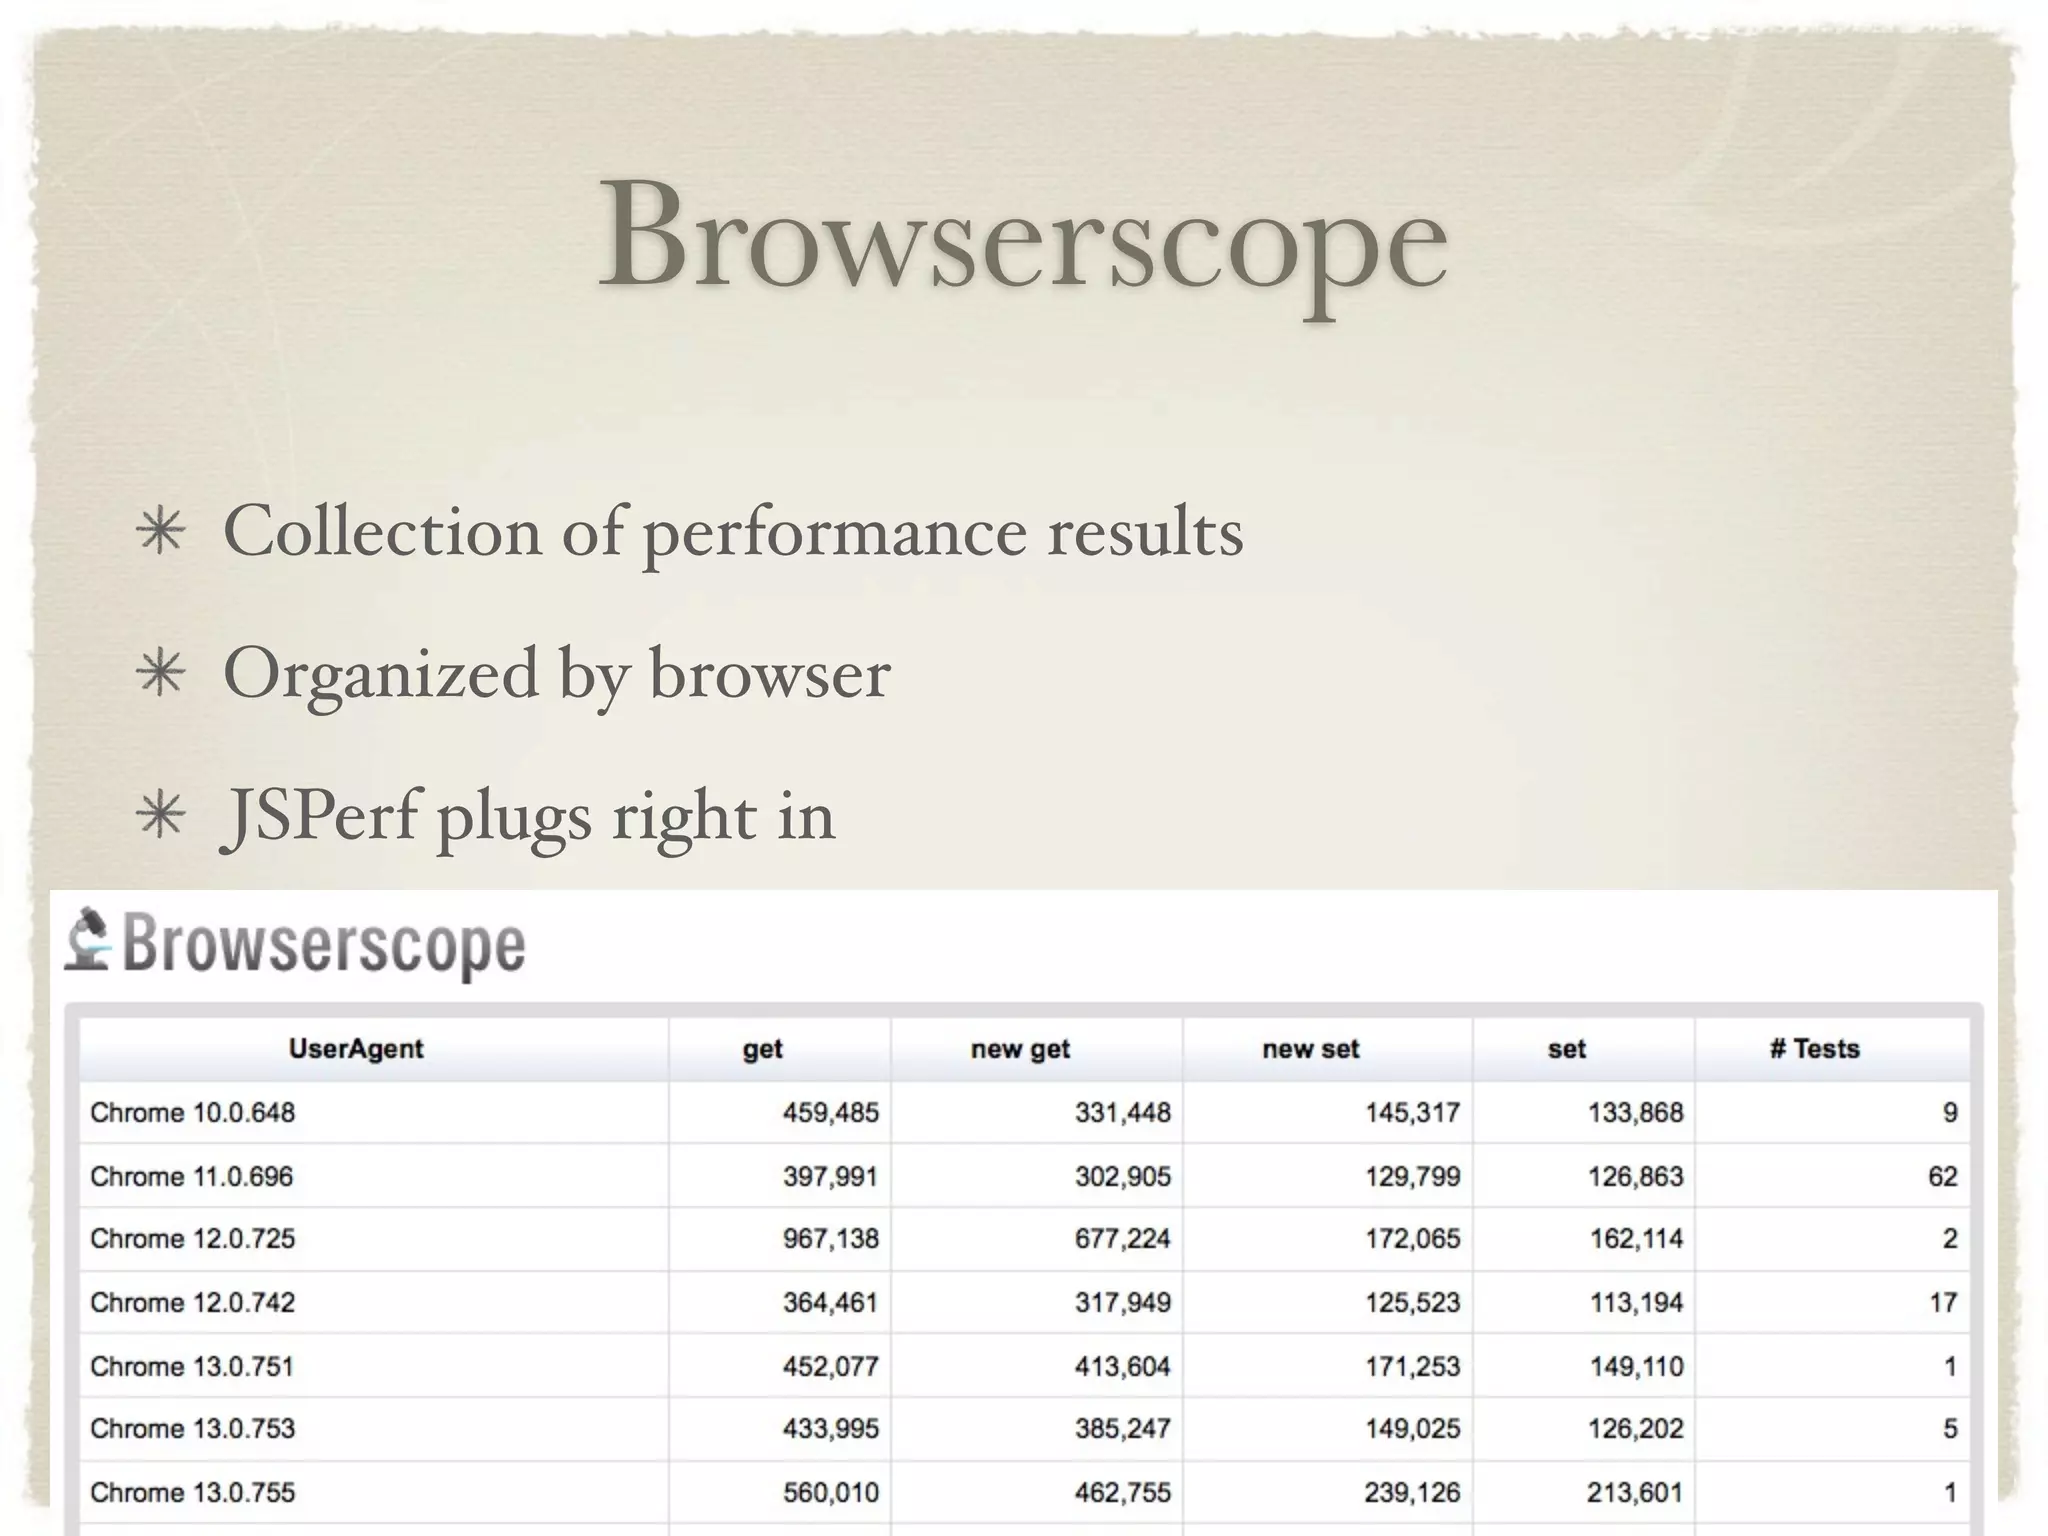
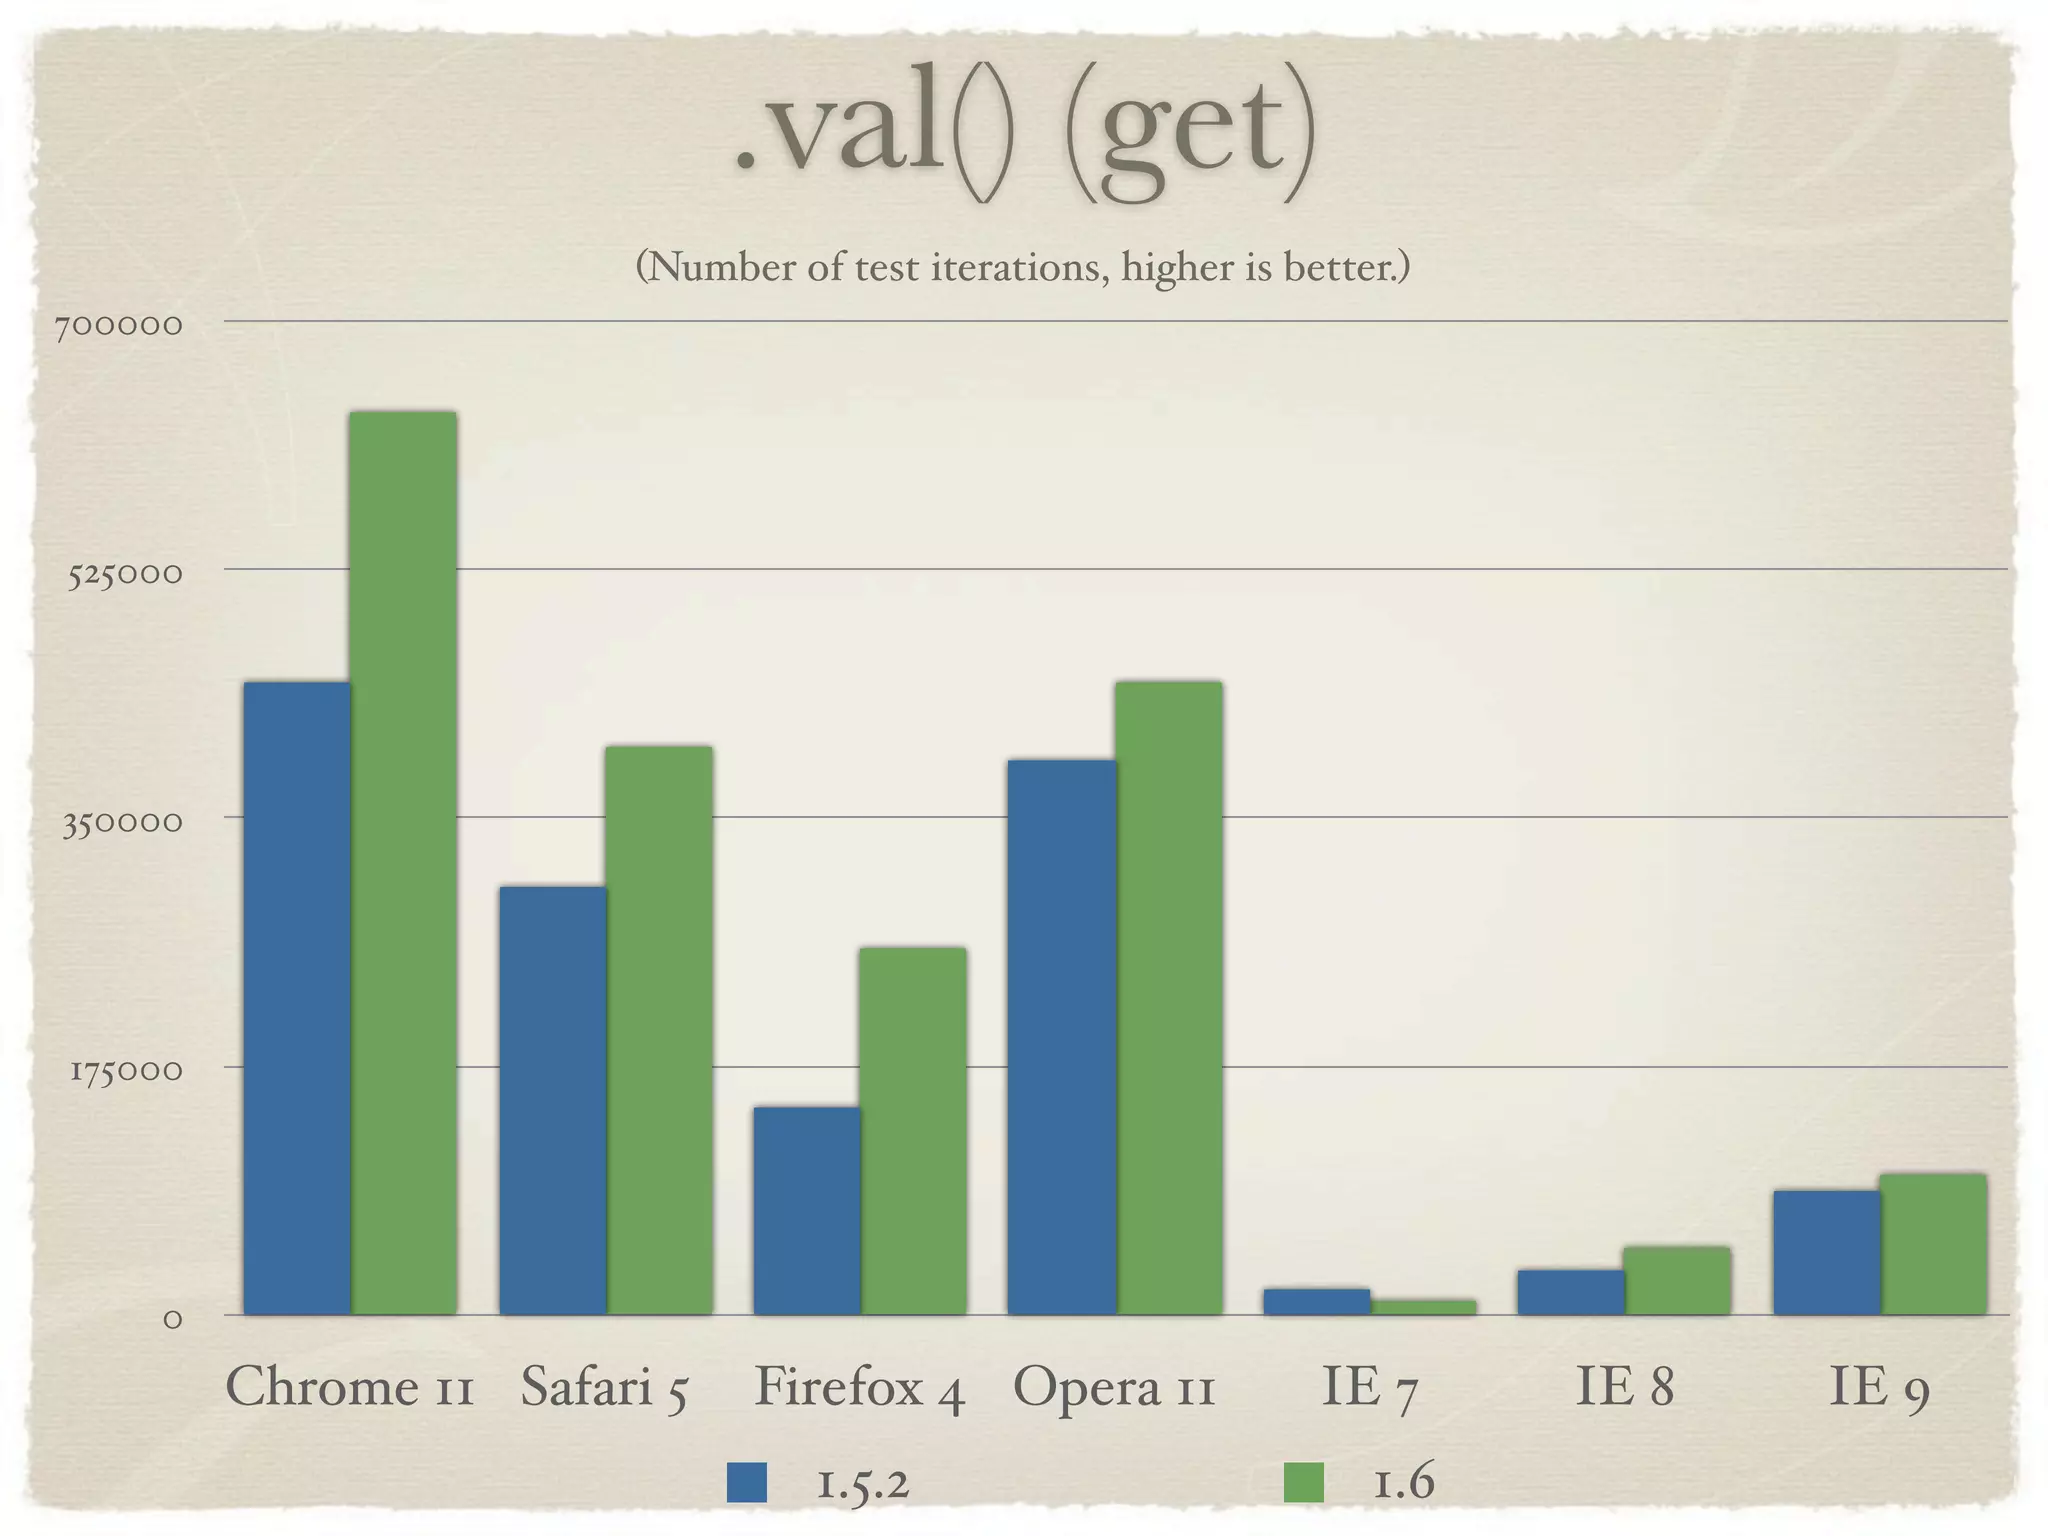
HOLISTIC PERFORMANCE John Resig
Performance Performance analysis is amazingly complex There is no, single, silver-bullet Don’t want to compromise quality in favor of performance Also want to communicate the changes in a realistic way
Analyzing Performance Wall-clock time Time in different browsers CPU consumption Memory consumption Memory leaks Bandwidth consumption Parse time Battery consumption (Mobile!)
Dictionary Lookups in JavaScript An interesting example for looking at performance. Most frequent concern: File Size Many solutions only optimize for file size Disregard parse time, or other performance aspects
Naïve Solution Pull in a raw list of words Push it into an object for fast property lookups Uses a lot of file size Very fast lookups
Trie A compact structure for storing dictionaries Optimizes heavily for file size Can be rather expensive to parse Can also use a lot of memory
File Size of Dictionaries 1100KB 825KB 550KB 275KB 0KB Plain String Binary String Simple Trie Optimized Trie Suffix Trie Succinct Trie Normal Gzipped
Load Speed of Dictionaries Time to load the dictionary once in Node.js on a 2.8 GHz Core i7. 150ms 112.5ms 75ms 37.5ms 0ms Plain String Binary String Hash Trie Succinct Trie
Search Speed of Dictionaries Time to look up one word. 6ms 4.5ms 3ms 1.5ms 0ms Plain String Binary String Hash Trie Succinct Trie Found Missing
Private Memory Usage of Dictionaries After loading the dictionary once. 11MB 8.25MB 5.5MB 2.75MB 0MB Plain String Binary String Hash Trie Succinct Trie
dynaTrace
dynaTrace One of the best tools available for analyzing the full browser stack Dig into CPU usage, bandwidth usage, and even performance of browser-internal methods Works in both IE and Firefox
Practical Performance Think about the larger context Pre-optimization is dangerous Code quality Importance Cross-browser compatibility
Performance in the jQuery Project
Rule 1: Prove it.
Prove it. Any proposed performance optimization must be undisputedly proven. Show us the proposed changes and how it’ll affect performance across all platforms. How? JSPerf. http://jsperf.com/
JSPerf JSPerf is a great tool Makes it very easy to build a reproducible test: http://jsperf.com/valhooks-vs-val/2
JSPerf JSPerf builds on some of the earlier analysis I did in 2008 http://ejohn.org/blog/javascript-benchmark-quality/ Runs tests the maximum number of times in 5 seconds Even does optimization to make sure there is less loop overhead Also uses a Java Applet for even better timer accuracy
Rule 2: See the Big Picture.
See the Big Picture. Micro-optimizations are death. Doesn’t matter how much you unroll a loop if that loop is doing DOM manipulation. Most crippling web app performance is from DOM performance issues. Pure JS performance is rarely an issue.
Prove the use case. If you’re proposing an optimization you must prove what it’ll help. Show real world applications that’ll benefit from the change. This is especially important as it’ll help stop you from wasting time on performance issues that don’t matter.
Rule 3: Clean Code.
Clean Code. We won’t compromise our code quality in exchange for performance. Almost all code quality compromises come from needless micro-optimizations. ~~(1 * string) vs. parseInt( string ) +new Date vs. (new Date).getTime() Don’t even get me started on loop unrolling.
Rule 4: Don’t Slow IE.
Don’t Slow IE. Just because performance gets better in one browser doesn’t mean it’ll get faster in all browsers. You shouldn’t compromise performance in other browsers for the sake of one. (Unless that browser is IE, always improve IE performance.)
Communicating the Results Creating realistic tests Communicating in an effective manner
Creating Realistic Tests
Realism It’s incredibly hard to create realistic test cases It’s important to look at actual applications We frequently use Google Code Search to find out how people are using our APIs (This gives us the knowledge that we need when we want to deprecate an API as well.)
Communicating the Results
Browserscope Collection of performance results Organized by browser JSPerf plugs right in
Creating Results Pull the results directly from BrowserScope Best: Compare old versions to new versions Within the context of all browsers
.val() (get) (Number of test iterations, higher is better.) 700000 525000 350000 175000 0 Chrome 11 Safari 5 Firefox 4 Opera 11 IE 7 IE 8 IE 9 1.5.2 1.6
Competition You might be inclined to compare performance against other frameworks, libraries, applications, etc. This tends to create more problems than it’s worth And the comparison isn’t always one-to-one If competing, agree on some tests first Work with your competition to create realistic tests
Compete Against Yourself In the jQuery project we work to constantly improve against ourselves Every release we try to have some performance improvements Always compare against our past releases Rewriting API internals is a frequent way of getting good performance results
More Information Thank you! http://ajax.dynatrace.com/ajax/en/ http://jsperf.com http://www.browserscope.org http://ejohn.org/blog/javascript-benchmark-quality/ http://ejohn.org/

Holistic JavaScript Performance

  • 1.
  • 2.
    Performance Performance analysis isamazingly complex There is no, single, silver-bullet Don’t want to compromise quality in favor of performance Also want to communicate the changes in a realistic way
  • 3.
    Analyzing Performance Wall-clock time Time in different browsers CPU consumption Memory consumption Memory leaks Bandwidth consumption Parse time Battery consumption (Mobile!)
  • 4.
    Dictionary Lookups in JavaScript An interesting example for looking at performance. Most frequent concern: File Size Many solutions only optimize for file size Disregard parse time, or other performance aspects
  • 5.
    Naïve Solution Pull ina raw list of words Push it into an object for fast property lookups Uses a lot of file size Very fast lookups
  • 6.
    Trie A compact structurefor storing dictionaries Optimizes heavily for file size Can be rather expensive to parse Can also use a lot of memory
  • 7.
    File Size ofDictionaries 1100KB 825KB 550KB 275KB 0KB Plain String Binary String Simple Trie Optimized Trie Suffix Trie Succinct Trie Normal Gzipped
  • 8.
    Load Speed ofDictionaries Time to load the dictionary once in Node.js on a 2.8 GHz Core i7. 150ms 112.5ms 75ms 37.5ms 0ms Plain String Binary String Hash Trie Succinct Trie
  • 9.
    Search Speed ofDictionaries Time to look up one word. 6ms 4.5ms 3ms 1.5ms 0ms Plain String Binary String Hash Trie Succinct Trie Found Missing
  • 10.
    Private Memory Usageof Dictionaries After loading the dictionary once. 11MB 8.25MB 5.5MB 2.75MB 0MB Plain String Binary String Hash Trie Succinct Trie
  • 11.
  • 12.
    dynaTrace One of thebest tools available for analyzing the full browser stack Dig into CPU usage, bandwidth usage, and even performance of browser-internal methods Works in both IE and Firefox
  • 13.
    Practical Performance Think aboutthe larger context Pre-optimization is dangerous Code quality Importance Cross-browser compatibility
  • 14.
    Performance in the jQuery Project
  • 15.
  • 16.
    Prove it. Any proposedperformance optimization must be undisputedly proven. Show us the proposed changes and how it’ll affect performance across all platforms. How? JSPerf. http://jsperf.com/
  • 17.
    JSPerf JSPerf is agreat tool Makes it very easy to build a reproducible test: http://jsperf.com/valhooks-vs-val/2
  • 20.
    JSPerf JSPerf builds onsome of the earlier analysis I did in 2008 http://ejohn.org/blog/javascript-benchmark-quality/ Runs tests the maximum number of times in 5 seconds Even does optimization to make sure there is less loop overhead Also uses a Java Applet for even better timer accuracy
  • 21.
    Rule 2: Seethe Big Picture.
  • 22.
    See the BigPicture. Micro-optimizations are death. Doesn’t matter how much you unroll a loop if that loop is doing DOM manipulation. Most crippling web app performance is from DOM performance issues. Pure JS performance is rarely an issue.
  • 23.
    Prove the usecase. If you’re proposing an optimization you must prove what it’ll help. Show real world applications that’ll benefit from the change. This is especially important as it’ll help stop you from wasting time on performance issues that don’t matter.
  • 24.
  • 25.
    Clean Code. We won’tcompromise our code quality in exchange for performance. Almost all code quality compromises come from needless micro-optimizations. ~~(1 * string) vs. parseInt( string ) +new Date vs. (new Date).getTime() Don’t even get me started on loop unrolling.
  • 26.
  • 27.
    Don’t Slow IE. Justbecause performance gets better in one browser doesn’t mean it’ll get faster in all browsers. You shouldn’t compromise performance in other browsers for the sake of one. (Unless that browser is IE, always improve IE performance.)
  • 28.
    Communicating the Results Creatingrealistic tests Communicating in an effective manner
  • 29.
  • 30.
    Realism It’s incredibly hardto create realistic test cases It’s important to look at actual applications We frequently use Google Code Search to find out how people are using our APIs (This gives us the knowledge that we need when we want to deprecate an API as well.)
  • 31.
  • 32.
    Browserscope Collection of performanceresults Organized by browser JSPerf plugs right in
  • 33.
    Creating Results Pull theresults directly from BrowserScope Best: Compare old versions to new versions Within the context of all browsers
  • 34.
    .val() (get) (Number of test iterations, higher is better.) 700000 525000 350000 175000 0 Chrome 11 Safari 5 Firefox 4 Opera 11 IE 7 IE 8 IE 9 1.5.2 1.6
  • 35.
    Competition You might beinclined to compare performance against other frameworks, libraries, applications, etc. This tends to create more problems than it’s worth And the comparison isn’t always one-to-one If competing, agree on some tests first Work with your competition to create realistic tests
  • 36.
    Compete Against Yourself Inthe jQuery project we work to constantly improve against ourselves Every release we try to have some performance improvements Always compare against our past releases Rewriting API internals is a frequent way of getting good performance results
  • 37.