Download to read offline
![International Research Journal of Engineering and Technology (IRJET) e-ISSN: 2395-0056 Volume: 04 Issue: 07 | July -2017 www.irjet.net p-ISSN: 2395-0072 © 2017, IRJET | Impact Factor value: 5.181 | ISO 9001:2008 Certified Journal | Page 658 IMAGE RETRIEVAL USING GRAPH BASED VISUAL SALIENCY Chesti Altaff Hussain1 B.Saraswathi2 1Assistant Professor, Department of ECE, Bapatla Engineering College, Bapatla, Andhra Pradesh, INDIA 2Scholar, Department of ECE, Bapatla Engineering College, Bapatla, Andhra Pradesh, INDIA ---------------------------------------------------------------------***---------------------------------------------------------------------- Abstract: Saliency methods are recent trends in content based image retrieval usually saliency detection are categorized into bottom-up and top-down approaches. A bottom-up visual saliency model, known as Graph-Based Visual Saliency (GBVS), proposed by Jonathan Harel, It consists of two steps: first forming activation maps on certain feature channels, and then normalizing them in a way which highlights conspicuity parts of an image. The model is simple, and biologically plausible insofar as it is naturally parallelized. The purpose of our project is to verify the performance of GBVS using some of the statistical parameters such as precision, recall and ROC curves and to adopt genetic algorithms to in GBVS in order to improve the performance of the system Key words: content based image retrieval, saliency, Precision-recall, ROC curve 1.Introduction 1.1 What is saliency Saliency is a conspicuous or important region of an image. It is a part of image segmentation. Image segmentation means process of partitioning an image into multiple segments. The goal of segmentation is to simplify and/or change the representation of an image into something that is more meaningful and easier to analyze. Image segmentation is generally used to locate objects and boundaries in images. The Saliency Map is a graphically arranged map that represents visual saliency of a corresponding visual scene. The goal of a saliency map is to simplify and/or change the representation of an image into something that is more meaningful and easier to analyze. Like a pixel has a high grey level or other unique color quality sees in color image, each pixel's quality will show in the saliency map. 1.2 Different Saliency Approaches Top-Down Saliency Maps [1] Gao et al. propose a top-down saliency algorithm by selecting discriminant features from a pre-defined filter bank. The discriminant features are characterized by the statistical difference based on the presence or absence of features in the object class of interest. With the selected features, the saliency values of interest points can be computed based on their mutual information. Instead of using pre-defined filter bank, Kanan et al. propose to learn filter responses with independent component analysis (ICA) from natural images. They thus build the top-down component of their saliency model by training a support vector machine (SVM) on ICA features. In our model, the discriminant features are selected from a learned dictionary by sparse coding. In the top-down saliency map is formulated as contextual guidance for object search. This contextual prior performs well when there is a strong correlation between the target locations and holistic scenes, such as cars in urban scenes. However, as target objects are likely to appear anywhere in a scene, this contextual prior is less effective (e.g., images from the Graz-02 and PASCAL VOC datasets). In contrast, we compute the saliency map by using CRF model, which is more effective to leverage the local context information. Mathe and Sminchisescu propose a dynamic top-down saliency algorithm to predict human eye movements when looking at actions and contexts A Nonparametric Approach to Bottom-Up Visual Saliency [2] The authors address the bottom-up influence of local image information on human eye movements. Most existing computational models use a set of biologically plausible linear filters, e.g., Gabor or Difference-of- Gaussians filters as a front-end, the outputs of which are nonlinearly combined into a real number that indicates visual saliency. Unfortunately, this requires many design parameters such as the number, type, and size of the front-end filters, as well as the choice of nonlinearities, weighting and normalization schemes etc., for which biological plausibility cannot always be justified. As a result, these parameters have to be chosen in a more or less and hoc way. Here, we propose a method to learn a visual saliency model directly from human eye movement data. The model is rather simplistic and essentially parameter-free, and therefore contrasts recent developments in the field that usually aim at higher prediction rates at the cost of additional parameters and increasing model complexity. Experimental results show that—despite the lack of any biological prior knowledge—our model performs comparably to existing approaches, and in fact learns](https://image.slidesharecdn.com/irjet-v4i7116-170828072720/75/Image-Retrieval-using-Graph-based-Visual-Saliency-1-2048.jpg)
![International Research Journal of Engineering and Technology (IRJET) e-ISSN: 2395-0056 Volume: 04 Issue: 07 | July -2017 www.irjet.net p-ISSN: 2395-0072 © 2017, IRJET | Impact Factor value: 5.181 | ISO 9001:2008 Certified Journal | Page 659 image features that resemble findings from several previous studies. In particular, its maximally excitatory stimuli have center-surround structure, similar to receptive fields in the early human visual system. In 1985 the authors Koch and Ullman introduced a concept of a saliency map. It was used to model the human attention and the shifting focus connected with sight and visual stimuli. The saliency map for a given image represents how distinctive the image regions are and in what order the eye and the nervous system process them. In their paper, Koch and Ullman explain that saliency is a measure of difference of the image regions from their surroundings in terms of elementary features such as colour, orientation, movement or distance from the eye. A model of saliency-based visual attention for rapid scene analysis (Itti/Koch algorithm)[3] The authors present a draft of an algorithm examining the differences of colors, saturation and orientation on a given image. The saliency value is dependent on detected local spatial discontinuities of those features. The algorithm measures relative positions of isolated fragments and attach less saliency values of elements to lying close to each other and more to those far apart Region enhanced scale-invariant saliency detection (“scale-free”) [4] The approach described in this paper is a hybrid method combining pixel-based saliency detection with region information from the segmentation algorithm. The output saliency map is built by averaging the saliency value of all pixels in the resulting segments. The saliency itself is calculated using multiple scaled weighted contrast maps, as the contrast is the only feature taken into account in this algorithm Saliency, Attention and Visual Search: Saliency, attention, and visual search: An information theoretic approach (AIM)[5] In this paper the authors present a theoretic formulation of a human visual attention model and a visual saliency algorithm basing on those formulae, named Attention based on Information Maximization (AIM). The paper itself is focused on explaining the AIM as a model of human saliency determination, with the algorithm itself presented only in a draft form. A Bayesian Framework for Saliency Using Natural Statistics (SUN) [6] The authors of this paper propose a probabilistic formula for saliency. The algorithm can be based on both difference of Gaussians (DoG) feature selection known from Itti/Koch and similar methods (called by authors “biologically plausible linear filters”), or the IC A algorithm known from AIM method Image Signature: Highlighting Sparse Salient Regions [7] In this work the authors present a simple yet powerful algorithm to approximate the decomposition of the image into foreground and background parts using Discrete Cosine Transform (DCT). This approximation is in turn used to generate a saliency map. Additionally, the authors present the experimental results of correlating this saliency map with reaction time of subjects in the change blindness experiment. 1.3 What is Graph Based Visual Saliency Graph Based Visual Saliency is mainly of three stages: extraction of features to feature vectors, generating activation maps from feature vectors and normalization and combination of activation maps into a single saliency map. Both activation and normalization phases use Markov chain interpretation of the image. Advantages: 1) Accurate saliency map 2) Detects salient objects as well as its surroundings 3) Procedure is computationally efficient 4) It is easy to implement. 5) The procedure is fast enough to be useful for real time applications 6) Achieves lower reconstruction error rate. Applications: 1) Psychology 2) Neurobiology 3) Object recognition, 4) Image segmentation, 5) Image retrieval, adaptive image display, 6) Forms one of the most effective diagnostic tools in medicine 7) Several imaging technologies: PET, MRI, X-ray, Nuclear medicine, Ultrasound etc… 1.4 LITERATURE SURVEY In [1]Itti, Koch and Niebur proposed a visual attention model in which image features such as color, intensity, and orientation for LDR images are combined to form a single saliency map. It makes use of Gaussian based approach in which a Gaussian pyramid is formed in each channel by subsampling the input image. Each feature is computed by a set of linear center-surround operations.](https://image.slidesharecdn.com/irjet-v4i7116-170828072720/75/Image-Retrieval-using-Graph-based-Visual-Saliency-2-2048.jpg)
![International Research Journal of Engineering and Technology (IRJET) e-ISSN: 2395-0056 Volume: 04 Issue: 07 | July -2017 www.irjet.net p-ISSN: 2395-0072 © 2017, IRJET | Impact Factor value: 5.181 | ISO 9001:2008 Certified Journal | Page 660 Centre-surround is implemented in the model as the difference between fine and coarse scales. The across- scale subtraction is obtained by interpolation to the center scale and point-by-point subtraction. Afterwards, all feature maps are combined into a “conspicuity map” in each channel. Conspicuity maps from all channels one master saliency map, which topographically represents the local saliency In [2] Chenlei Guo and Liming Zhang presents a saliency detection model based on high-pass coefficients of the wavelet decomposition. The idea is to create the feature maps by IWT on the multi-level decomposition. First, RGB image is converted into LAB color space. Then, apply wavelet transform decomposition on the noise removed version to find scaling coefficients. In addition to it, it focuses on creating the feature maps by IWT on the multi-level decomposition. Two saliency maps are created: local and global saliency maps. Finally, the local and global maps are combined to yield the final saliency map. The final saliency map represents both the In [3] Zhixiang Ren, Shenghua Gao, Liang-Tien Chia, and Ivor Wai-Hung Tsang presents a region-based solution for saliency detection applicable to better encode the image features for solving object recognition task. First use the adaptive mean shift algorithm to extract super pixels from the input image. Then apply Gaussian mixture model (GMM) to cluster super pixels based on their color similarity. Finally, calculate the saliency value for each cluster using spatial compactness metric together with modified PageRank propagation local contrast of each location on the scene and the global distribution of the features as an amplifier for local saliency values. In [4] Nevrez mamolu, Weisi Lin, and Yuming Fang suggested a saliency detection model in which image is represented as quaternionic and developed a multi resolution spatiotemporal saliency detection model called phase spectrum of quaternion Fourier transform (PQFT) to compute the spatiotemporal saliency map from the images quaternion representation. First, each pixel of the image is represented by a quaternion that consists of color, intensity and motion feature. Then, the phase spectrum of QFT is used to calculate the spatiotemporal saliency map, which considers not only salient spatial features like color, orientation and others in a single frame and temporal features are also frames like motion. In [5] Qi Zhao, Christof Koch suggested a novel unified method for Learning saliency-based visual attention that Explain the detection process of visual saliency. i.e., Humans and other primates shift their gaze to allocate processing resources to a subset of the visual input. Understanding and emulating the way that human observers free view a natural scene has both scientific and economic impact. It has therefore attracted the attention from researchers in a wide range of science and engineering disciplines. With the increasing computational power, machine learning has become a popular tool to mine human data in the exploration of how people direct their gaze when inspecting a visual scene. In [6] Yuanyuan Dong, Mahsa T. Pourazad, and Panos Nasiopoulos proposed a saliency detection method that detects the saliency of HDR images and HDR video frames. The spatial and temporal cues are taken into account, leading to two saliency maps: the spatial saliency map and the temporal saliency map. First, to obtain the spatial saliency map, use the HVS model to decompose feature channels from an HDR input and then follow the procedure of the classical bottom-up method in [22]. Then to compute the temporal saliency map, an optical flow based method is used to estimate motion. Finally, a dynamic fusion method is proposed to combine both the spatial and temporal saliency maps. In [7] Wonjun Kim, Chanho Jung, and Changick Kim suggested a novel unified method for detecting salient regions in both images and videos based on a discriminant center surround hypothesis that the salient region stands out from its surroundings. First of all, a set of visual features composed of edge and color orientations and temporal gradients are computed. Then, compute the spatiotemporal saliency at each scale in which the spatial saliency is computed as the distances between ordinal signatures of edge and color orientations obtained from the center and the surrounding regions and the temporal saliency, by simply computing the sum of absolute difference (SAD) between temporal gradients of the center and the surrounding regions. Finally, resize saliency map to the same size of input image to obtain the final saliency. In [8] Yuming Fang, Weisi Lin, Zhenzhong Chen, Chia- Ming Tsai, and Chia-Wen Lin proposed a novel video saliency detection model based on feature contrast in compressed domain. Firstly, three features including luminance, color, and texture are extracted from the discrete cosine transform coefficients for unpredicted frames (I -frames), and the motion feature is extracted from the motion vectors in video bit stream for predicted frames (P and B frames). Then, the static saliency map is obtained based on the features of luminance, color, and texture for unpredicted frames, while the motion saliency map is calculated on the basis of motion feature for predicted frames. Finally, the static saliency map and the motion saliency map are combined to get the final saliency map for each video frame.](https://image.slidesharecdn.com/irjet-v4i7116-170828072720/75/Image-Retrieval-using-Graph-based-Visual-Saliency-3-2048.jpg)
![International Research Journal of Engineering and Technology (IRJET) e-ISSN: 2395-0056 Volume: 04 Issue: 07 | July -2017 www.irjet.net p-ISSN: 2395-0072 © 2017, IRJET | Impact Factor value: 5.181 | ISO 9001:2008 Certified Journal | Page 661 In [9] Qinmu Peng, Yiu-ming Cheung, Xinge You, and Yuan Yan Tang, presents a visual saliency detection approach, which is a hybrid of local feature-based saliency and global feature-based saliency. First, for a given input image, use an automatic selection of smoothing parameter scheme to make the image region more homogeneous. Then, partition the smoothed image into a set of regions and compute the local saliency by measuring the color and texture dissimilarity in the smoothed regions and the original regions, respectively. Furthermore, compute the global saliency by utilizing the global color distribution model embedded with color coherence, together with the multiple edge saliency. Finally, combine the local and global saliencies, and utilize the composition information to obtain the final saliency. 2.Graph Based Visual Saliency (GBVS) 2.1Algorithm Figure-1) Proposed architecture](https://image.slidesharecdn.com/irjet-v4i7116-170828072720/75/Image-Retrieval-using-Graph-based-Visual-Saliency-4-2048.jpg)
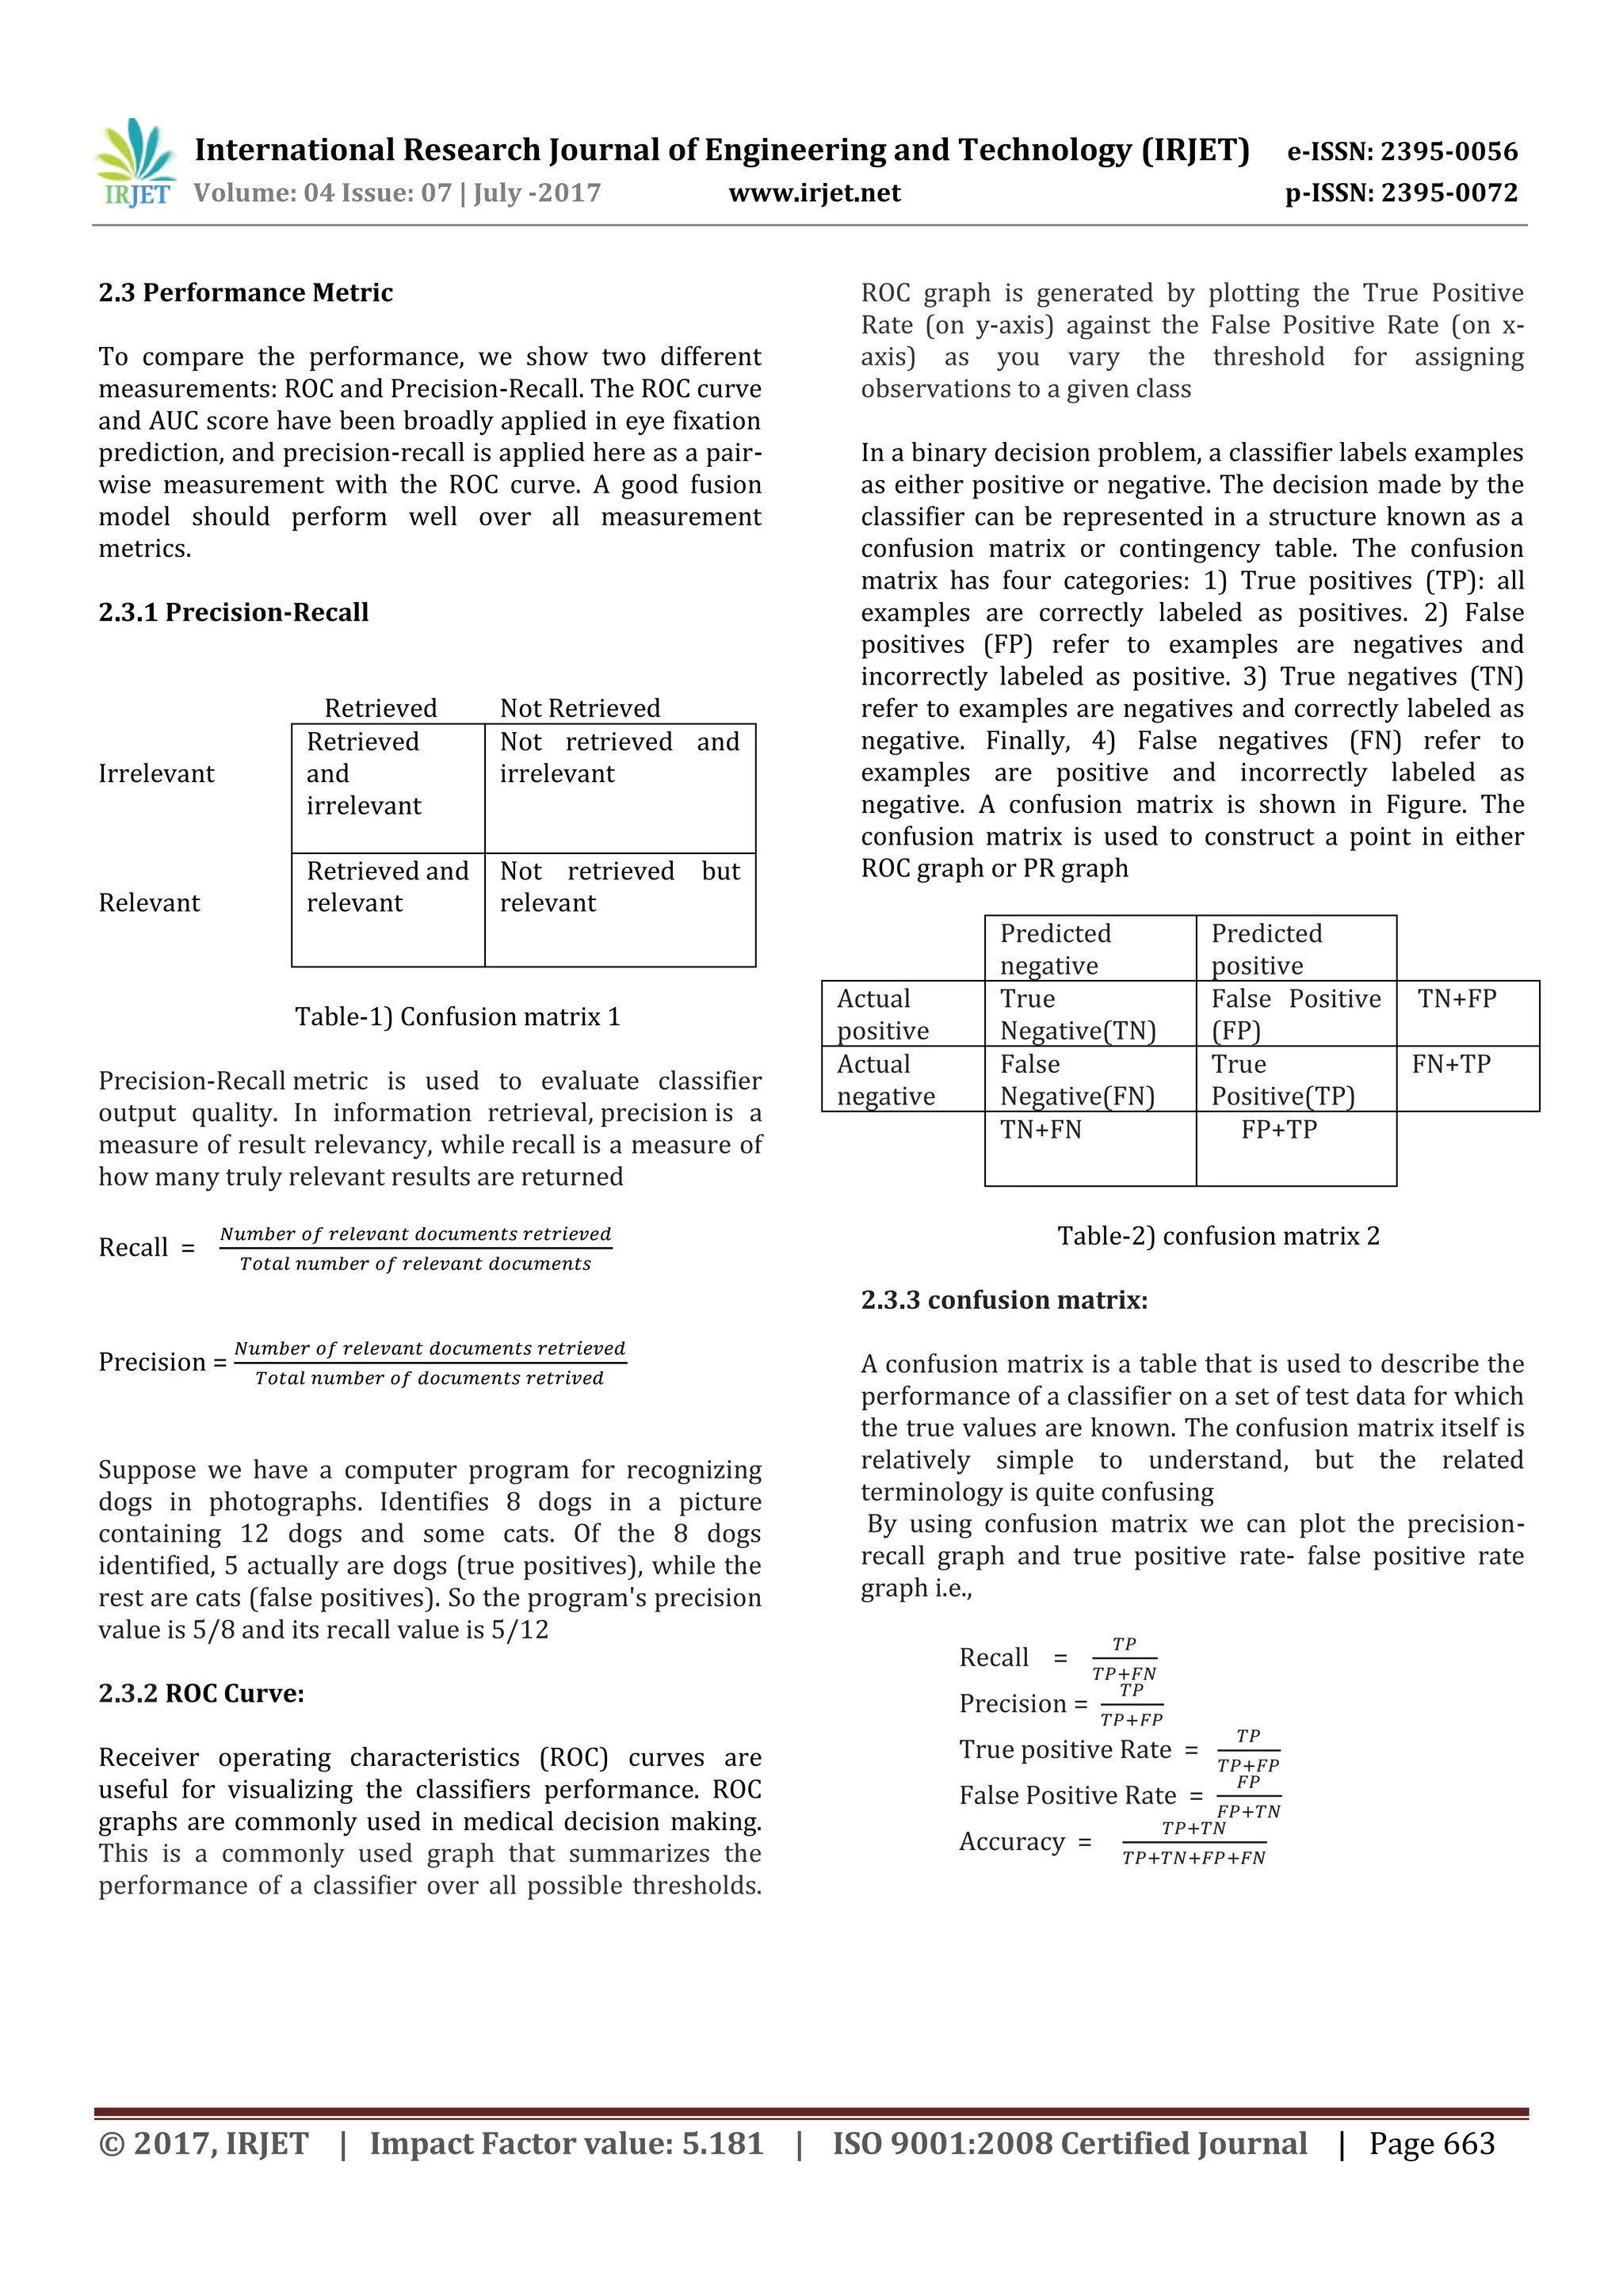
![International Research Journal of Engineering and Technology (IRJET) e-ISSN: 2395-0056 Volume: 04 Issue: 07 | July -2017 www.irjet.net p-ISSN: 2395-0072 © 2017, IRJET | Impact Factor value: 5.181 | ISO 9001:2008 Certified Journal | Page 662 a) Features Extraction The first processing stage in the majority of the models of Graph Based Visual Saliency is feature extraction. Usually, salient regions by decomposing the input image into three different channels, namely, color, intensity and orientation, The color channel consists of two maps, red/green and blue/yellow color opponencies, the intensity channel consists of a gray-scale representation of the input image, and the orientation channel contains four local orientation maps associated with angles of 0, 45, 90, and 135 degrees. For each channel map, nine spatial scales are created by repeatedly low-pass filtering and subsampling the input channel. After that, feature maps are computed by using center-surround operations, The center-surround operations are defined as the difference between fine and coarse scales. b) Measurement of visual saliency The following points are considered to predict the Saliency part from an image 1.Scale: it is crucial importance in the prediction of salient regions. This also includes consideration of some facets of computation common to models involved in fixation prediction, including post-processing of raw saliency maps in the form of Gaussian blurring and implications for neural information processing. 2.Border effects: The lack of spatial support for a filter positioned at the boundary of an image, and the spatial support among cells that represent visual input in the far periphery is important in its implications for behavior and benchmarking. We provide demonstrations of the importance of border effects, with emphasis on implications within biological systems. 3.Spatial bias: In considering spatial bias, there has been much debate as to the most appropriate means of evaluating models that target prediction of gaze data. One important factor in this analysis is the observed spatial (central) bias in fixation data 4.Context and scene composition: Some prior efforts in fixation prediction have demonstrated the utility of considering context, with even relatively coarse spatial guidance providing a means of improving performance in characterizing visual saliency. c) Normalization Normalization process is used to increase the intensity of pixels in saliency part of an image by using energy re- allocation method. Due to re-allocating normalized energy in particular frequency region to the whole background, the salient objects are effectively highlighted and the energy of the background is weakened. Considering energy distribution in both spectral domain and color channels, we propose a simple and effective visual saliency model based on Energy Re-allocation mechanism (ER). We combine color energy normalization, spectrum normalization and channel energy normalization to attain an energy re-allocation map. Then, we convert the map to the corresponding saliency map using a low-pass filter. Compared with other state-of-the-art models, experiments on both natural images and psychological images indicate that ER can better detect the salient objects with a competitive computational speed. 2.1 Databases used The database is a subset of 1,000 images. which have been manually selected and which form 5 classes of 200 images each. The database can be considered similar to common stock photo retrieval tasks with several images from each category and a user having an image from a particular category and looking for similar images which have e.g. cheaper royalties or which have not been used by other media. The 5 classes are used for relevance estimation: given a query image, it is assumed that the user is searching for images from the same class, and therefore the remaining 99 images from the same class are considered relevant and the images from all other classes are considered irrelevant Each image of data bases was cropped to 600 *400 pixels and was presented to subjects. so that it took up 76 55 of their visual field. In order to facilitate a fair comparison of algorithms, the first step of the saliency algorithm, feature extraction, was the same for every experiment. Two spatial Scales (1/2,1/4) were used, and for each of these, four orientation maps corresponding to orientations . were computed using Gabor filters, one contrast map was computed using luminance variance in a local neighborhood of size 80*80 , and the last map was simply a luminance map (the gray scale values). "c-s" (center-surround) activation maps were computed by subtracting, from each raw feature map. And finally normalize the activation maps to increase the pixels intensity in an image. We compare the Receiver Operator Characteristic (ROC) curves and precision- recall. In the ROC and precision recall analysis, the values of the measured saliency maps are normalized to [0, 1], and we use 0.5 as the threshold to binarize the saliency maps to salient regions and non-salient ones as the ground truth. To increase effectiveness of the computed saliency maps, we adjust the threshold values from 0 to 1, and identify the false positives and true positives at each threshold, then generate the ROC curves and precision recall curves](https://image.slidesharecdn.com/irjet-v4i7116-170828072720/75/Image-Retrieval-using-Graph-based-Visual-Saliency-5-2048.jpg)
![International Research Journal of Engineering and Technology (IRJET) e-ISSN: 2395-0056 Volume: 04 Issue: 07 | July -2017 www.irjet.net p-ISSN: 2395-0072 © 2017, IRJET | Impact Factor value: 5.181 | ISO 9001:2008 Certified Journal | Page 665 4.conclusion We presented a new bottom-up saliency model. This model powerfully predicts human fixations than the standard algorithms. Nodes are on average closer to a few center nodes than to any particular point along the image. it is an emergent property that GBVS promotes higher saliency values in the center of the image plane the GBVS-induced center bias by activating, then normalizing, a uniform image using our algorithms we find that the standard algorithms predict fixations better, “self info” algorithm has trouble activating salient regions distant from object borders GBVS robustly highlights salient regions, even far away from object borders. The method uses a novel application of ideas from graph theory to concentrate mass on activation maps, and to form activation maps from raw feature. Our model is extensible to multi resolutions for better performance, and it is biologically plausible to the extent that a parallel implementation of the power-law algorithm for Markov chains is trivially accomplished in hardware. A systematic survey of bottom-up saliency models is presented to show the main branches in computing location-based saliency. Moreover a complete overview of benchmarks and evaluation metrics is also presented to quantize the performance of saliency models. With these materials, readers can easily understand how to build and evaluate visual saliency model References [1] Qinmu Peng, Yiu-ming Cheung, Xinge You, and Yuan Yan Tang, “ Hybrid of Local and Global Saliencies for Detecting Image Salient Region and Appearance , "IEEE Transactions On Systems, Man , And Cybernetics: Systems, Aprill 2016. [2] Wenguan Wang, Jianbing Shen, and Ling Shao, “Consistent Video Saliency Using Local Gradient Flow](https://image.slidesharecdn.com/irjet-v4i7116-170828072720/75/Image-Retrieval-using-Graph-based-Visual-Saliency-8-2048.jpg)
![International Research Journal of Engineering and Technology (IRJET) e-ISSN: 2395-0056 Volume: 04 Issue: 07 | July -2017 www.irjet.net p-ISSN: 2395-0072 © 2017, IRJET | Impact Factor value: 5.181 | ISO 9001:2008 Certified Journal | Page 666 Optimization and Global Refinement , " IEEE Transactions On Image Processing, Vol. 24, No. 11, Nov 2015. [3] Yuanyuan Dong, Mahsa T. Pourazad, and Panos Nasiopoulos, “Human Visual System-based Saliency Detection For HDR Content, " IEEE Transactions On Multimedia, Vol. 18, No. 4, April 2016. [4] Yuming Fang, Zhou Wang, and Weisi Lin, “ Saliency Incorporating Spatiotemporal Cues And Uncertainty Weighting , "IEEE Transactions On Image Processing, Vol. 23, No. 9,sept 2014. [5] Zhixiang Ren, Shenghua Gao, Liang-Tien Chia, and Ivor Wai- HungTsang, “ Region-Based Saliency Detection and Its Application in Object Recognition, "IEEE Transactions On Circuits And Systems For Video Technology, [6] Vol. 24, No. 5, May 2014. [10] Zhi Liu, Xiang Zhang, Shuhua Luo, and Olivier Le Meur, “ Superpixel Based Spatiotemporal Saliency Detection, "IEEE Transactions On Circuits And Systems For Video Technology, Vol. 24, No. 9, September 2014. [7] Wonjun Kim, Chanho Jung, and Changick Kim, “Spatiotemporal Saliency Detection and Its Applications in Static and Dynamic Scenes, "IEEE Transactions On Circuits And Systems For Video Technology, Vol. 21, April 2011. [8] Chenlei Guo and Liming Zhang, “A Novel Multi resolution Spatiotemporal Saliency Detection Model and Its Applications in Image and Video Compression,” IEEE Transactions On Image Processing, Vol. 19, No. 1, Jan2010 [9] Nevrez mamolu, Weisi Lin, and Yuming Fang, “A Saliency Detection Model Using Low-Level Features Based on Wavelet Transform, "IEEE Transactions On Multimedia, Vol. 15, No. 1, Jan 2013. [10] S.K Somasundaram, P.Alli,” A Review on Recent Research and Implementation Methodologies on Medical Image Segmentation”, Journal of Computer Science 8(1): 170-174, 2012. [11] Image Segmentation Techniques Rajeshwar Dass, priyanka, Swapna Devi IJECT Vol. 3, Issue 1, Jan. -March 2012 [12] Edge Detection Techniques Evaluations and Comparisons. Ehsan Applied Mathematical Sciences, Vol. 2, 2008, no. 31, 1507 - 1520. [13]J. Li, Y. Tian, T. Huang, and W. Gao, Probabilistic multi-task learning for visual saliency estimation in video, IJCV, 2010 [14] K. E. A. van de Sande, J. R. R. Uijlings, T. Gevers, and A. W. M. Smeulders, “Segmentation as selective search for object recognition,” in ICCV, 2011. [15] A. Garcia-Diaz, V. Leboran, X. R. Fdez-Vidal, and X. M. Pardo, “On the relationship between optical variability, visual saliency, and eye fixations: A computational approach,” Journal of Vision, vol. 12, no. 6, 2012. [16] A. Borji, D. N. Sihite, and L. Itti, “Salient object detection: A benchmark,” in Proc. ECCV, 2012 [17] J. Harel, C. Koch, and P. Perona. Graph-based visual saliency. Advances in neural information processing systems , 2007 [18] W. Einhäuser, W. Kruse, K.P. Hoffmann, & P. König "Differences of Monkey and Human Overt Attention under Natural Conditions", Vision Research 2006 [19] X. Zhang, L. Zhaoping, T. Zhou, and F. Fang. Neural activities in v1 create a bottom-up saliency map. Neuron, 73(1):183–192, 2012. [20] C. Guo and L. Zhang, “A novel multi-resolution spatiotemporal saliency detection model and its applications in image and video compression,” IEEE Trans. Image Process., vol. 19, no. 1, pp. 185–198, Jan. 2010. [21] C. Gilbert and W. Li. Top-down influences on visual processing. Nature Reviews Neuroscience, 14:350–363, 2013. [22] Laurent Itti, Christof Koch, and Ernst Niebur, " A Model of Saliency-Based Visual Attention for Rapid Scene Analysis," IEEE Transactions On Pattern Analysis And Machine Intelligence, Vol. 20, No. 11, Nov 1998](https://image.slidesharecdn.com/irjet-v4i7116-170828072720/75/Image-Retrieval-using-Graph-based-Visual-Saliency-9-2048.jpg)

This document discusses image retrieval using graph-based visual saliency. It begins with an abstract that describes saliency detection methods and graph-based visual saliency (GBVS), which forms activation maps from image features and normalizes them to highlight salient parts. The purpose is to evaluate GBVS using statistical metrics like precision and recall, and to use genetic algorithms to improve its performance. It then provides background on saliency, different saliency approaches, what graph-based visual saliency is, its advantages and applications. Finally, it reviews several related works on visual saliency models.