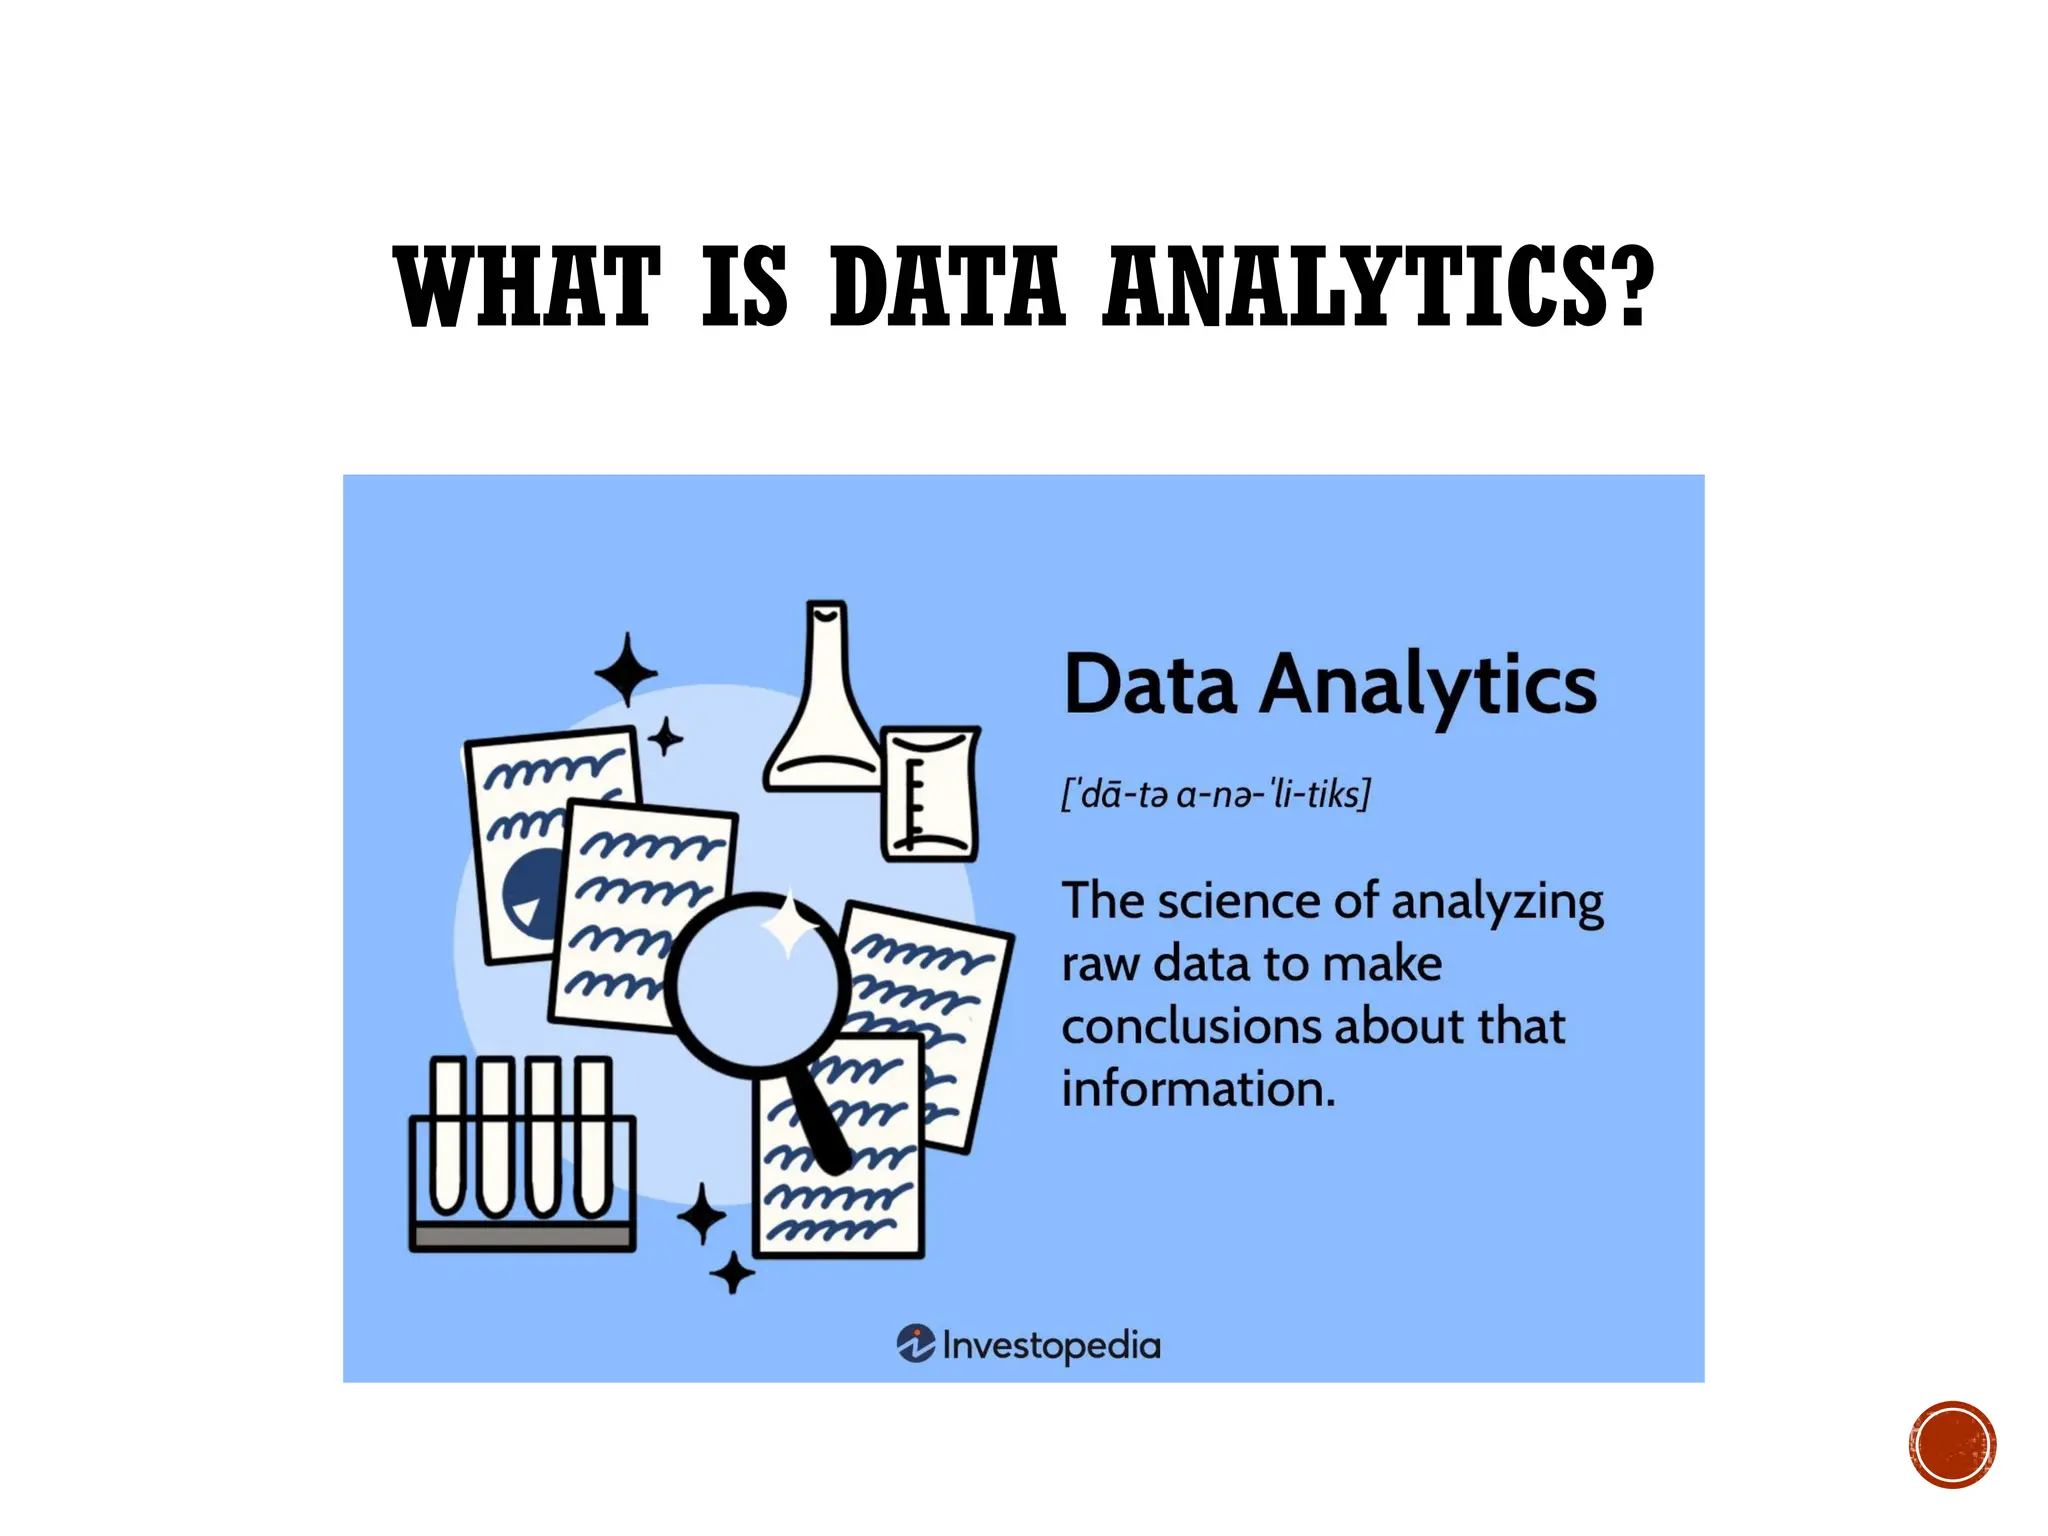
WHAT IS DATAANALYTICS? Data analytics is the process of collecting, transforming, and organizing data in order to draw conclusions, make predictions, and drive informed decision making.
4.
WHAT IS DATAANALYTICS? Data analytics is a multidisciplinary field that employs a wide range of analysis techniques, including math, statistics, and computer science, to draw insights from data sets. Data analytics is a broad term that includes everything from simply analyzing data to theorizing ways of collecting data and creating the frameworks needed to store it.
5.
HOW IS DATAANALYTICS USED? Data is everywhere, and people use data every day, whether they realize it or not. Daily tasks such as measuring coffee beans to make your morning cup, checking the weather report before deciding what to wear, or tracking your steps throughout the day with a fitness tracker can all be forms of analyzing and using data.
6.
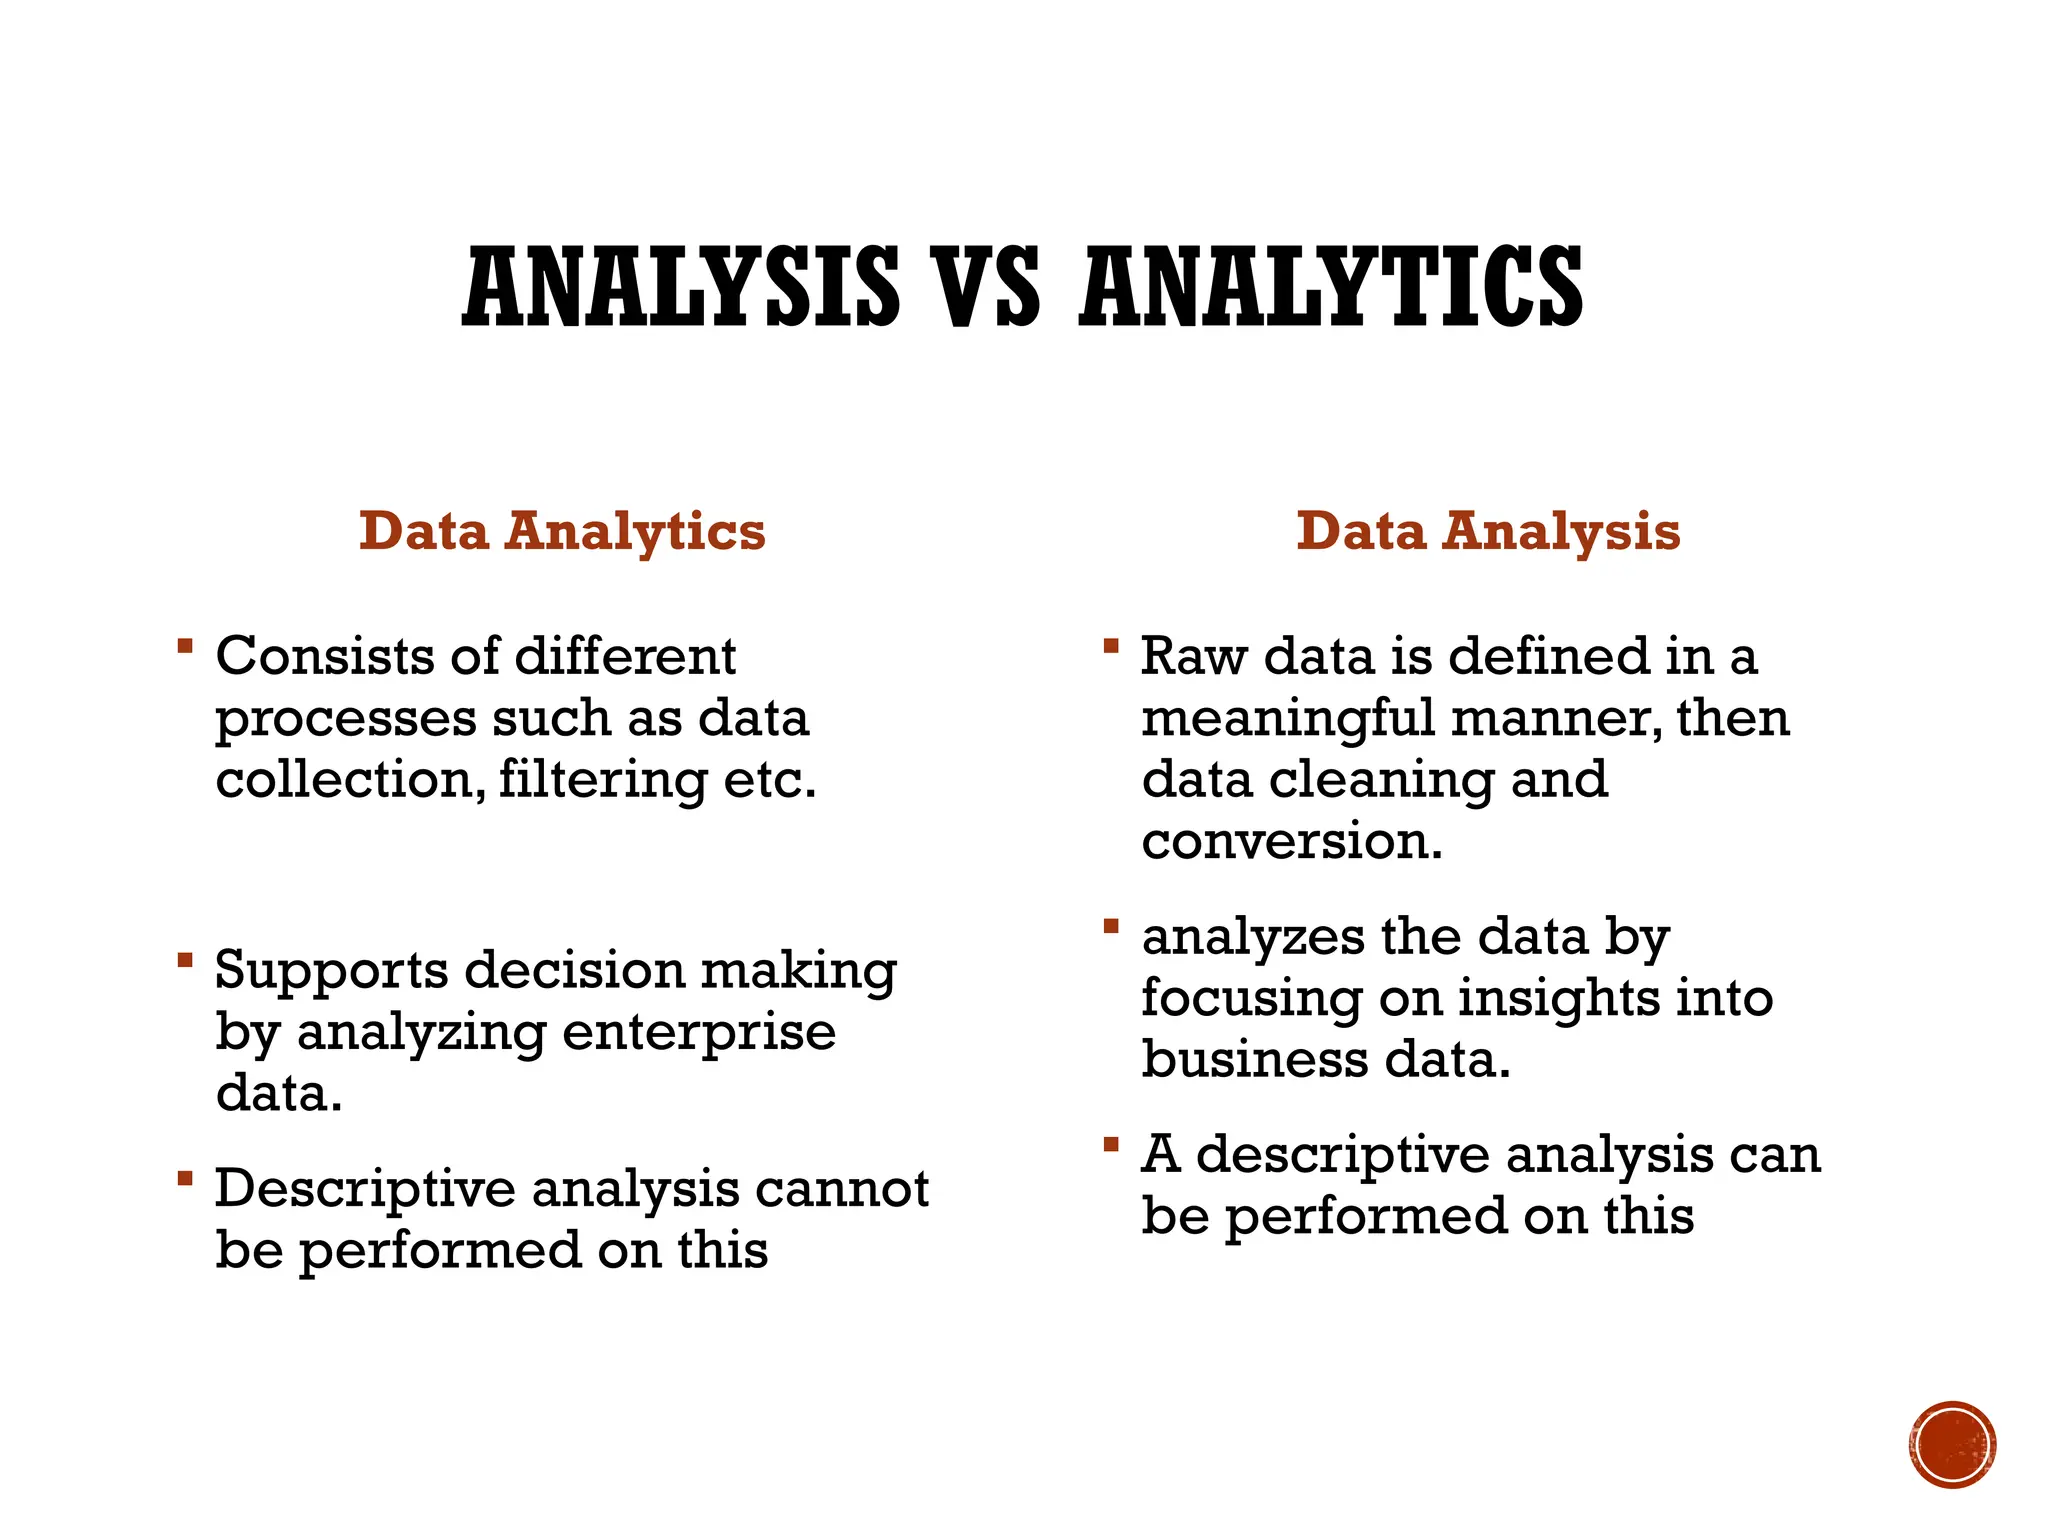
ANALYSIS VS ANALYTICS DataAnalytics Consists of different processes such as data collection, filtering etc. Supports decision making by analyzing enterprise data. Descriptive analysis cannot be performed on this Data Analysis Raw data is defined in a meaningful manner, then data cleaning and conversion. analyzes the data by focusing on insights into business data. A descriptive analysis can be performed on this
7.
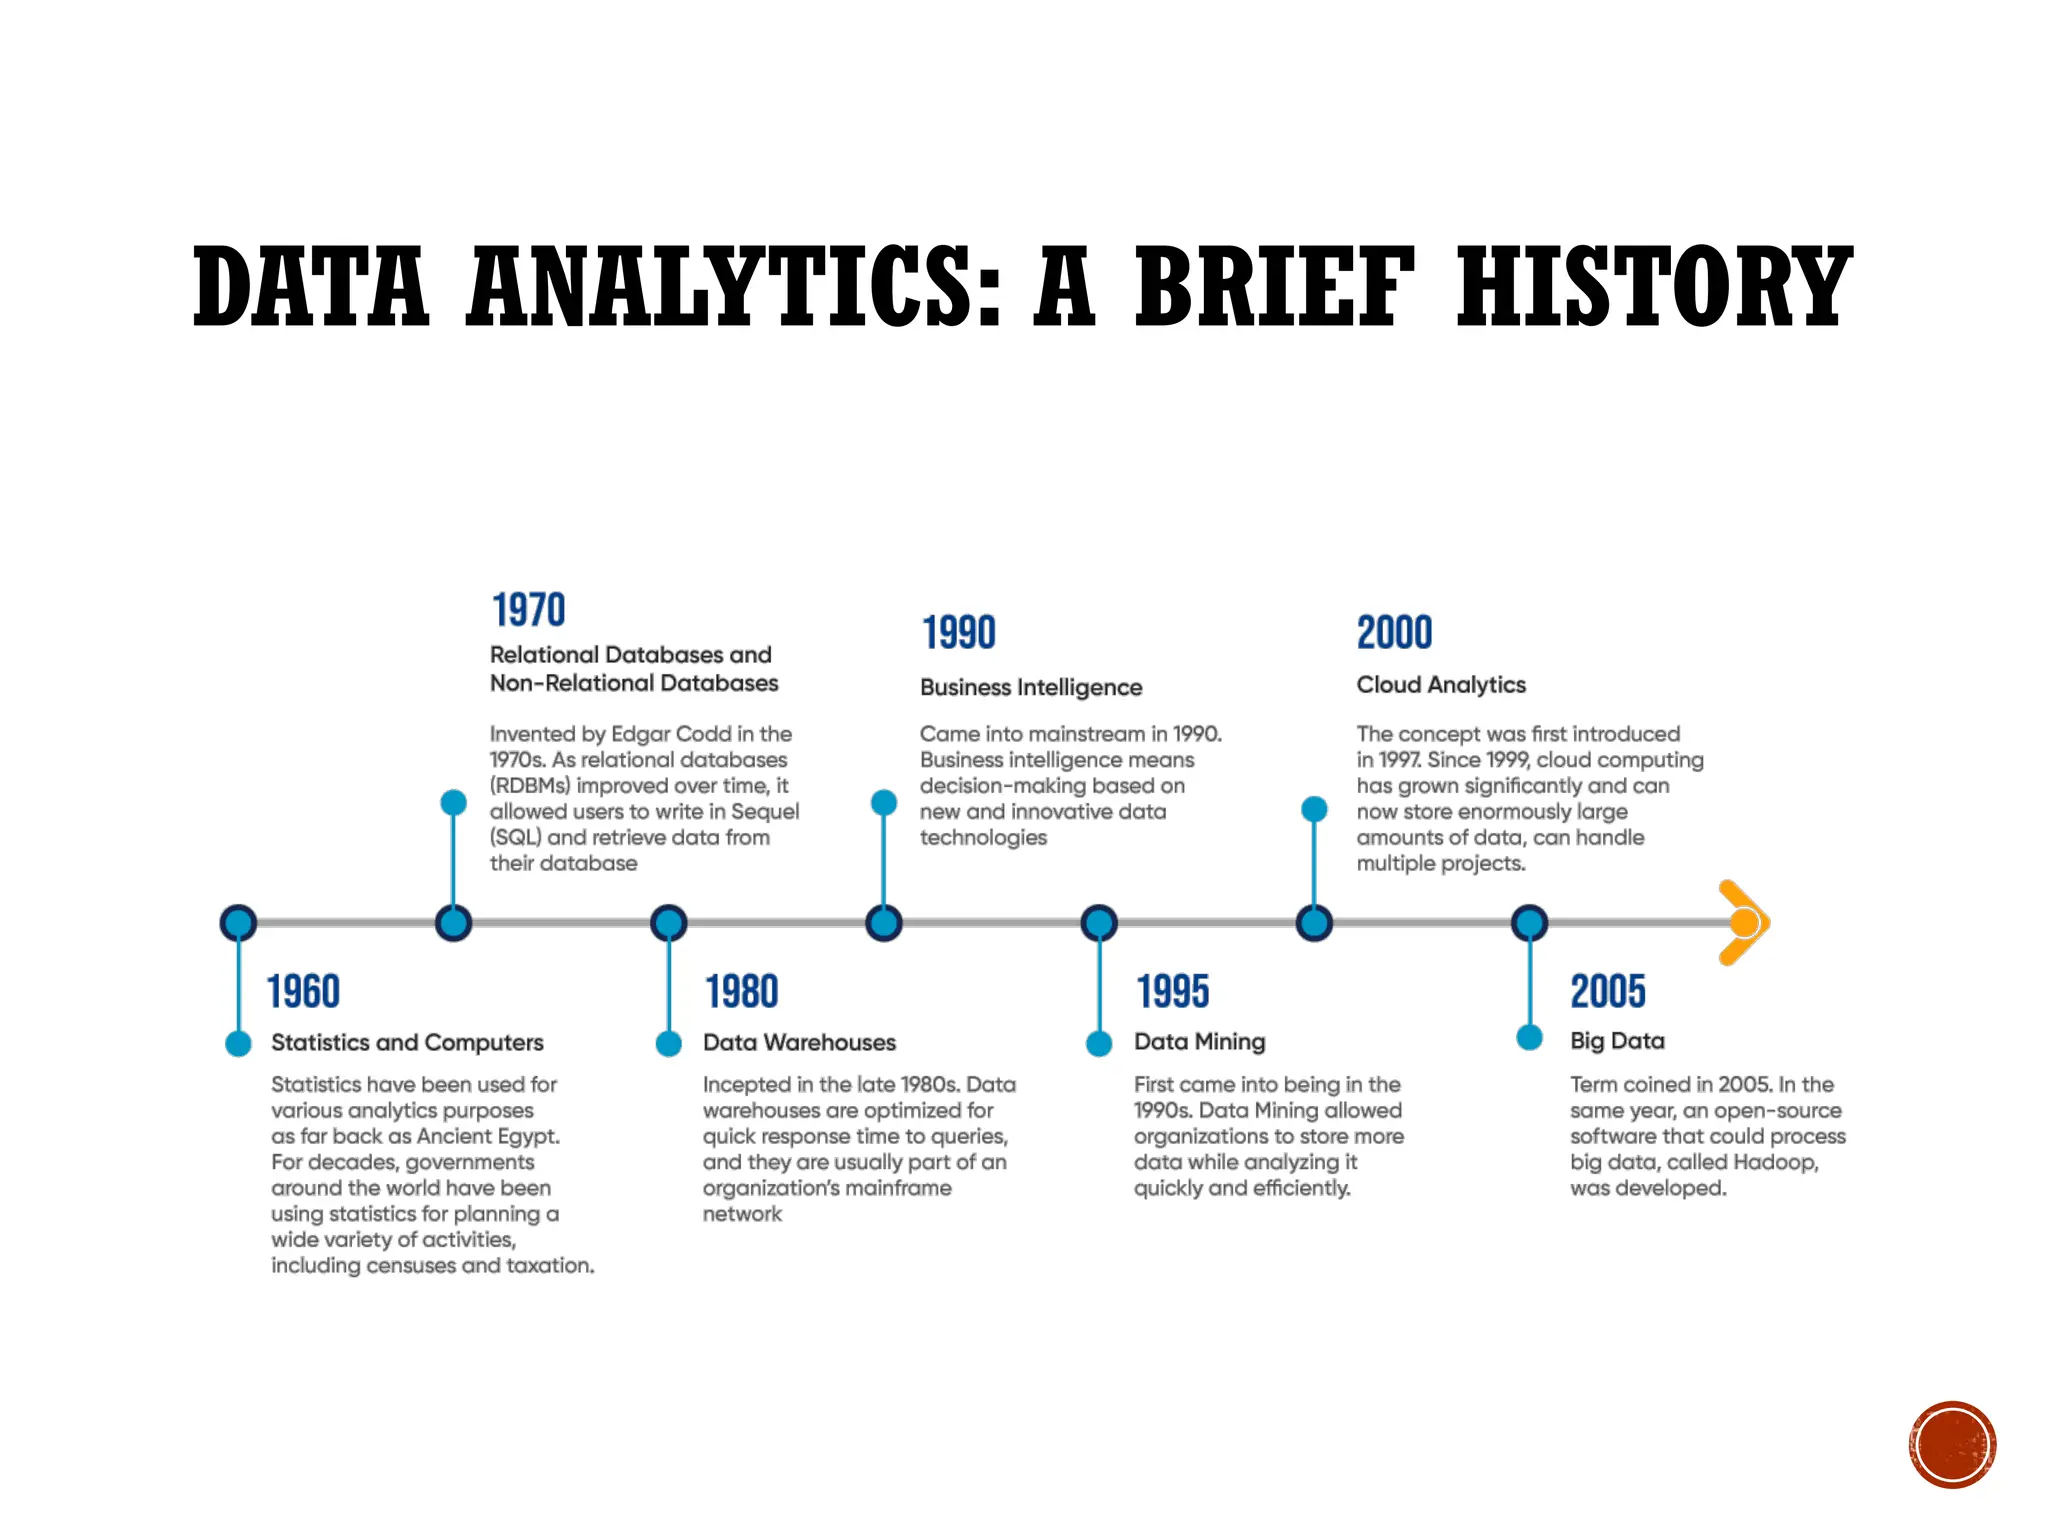
DATA ANALYTICS: ABRIEF HISTORY The use of analytics by business can be found as far back as the 19th century, when Frederick Winslow Taylor initiated time management exercises. Another example is when Henry Ford measured the speed of assembly lines. In the late 1960s, analytics began receiving more attention as computers became decision-making support systems.
8.
DATA ANALYTICS: ABRIEF HISTORY 1. Early Beginnings (1950s – 1970s) 2. Spreadsheet Revolution (1980s – 1990s) 3. Business Intelligence (BI) Emergence (1990s – Early 2000s) 4. Big Data Era (Mid-2000s – Present) 5. Data Visualization and Predictive Analytics (2010s – Present) 6. AI-Powered Analytics (Present – Future)
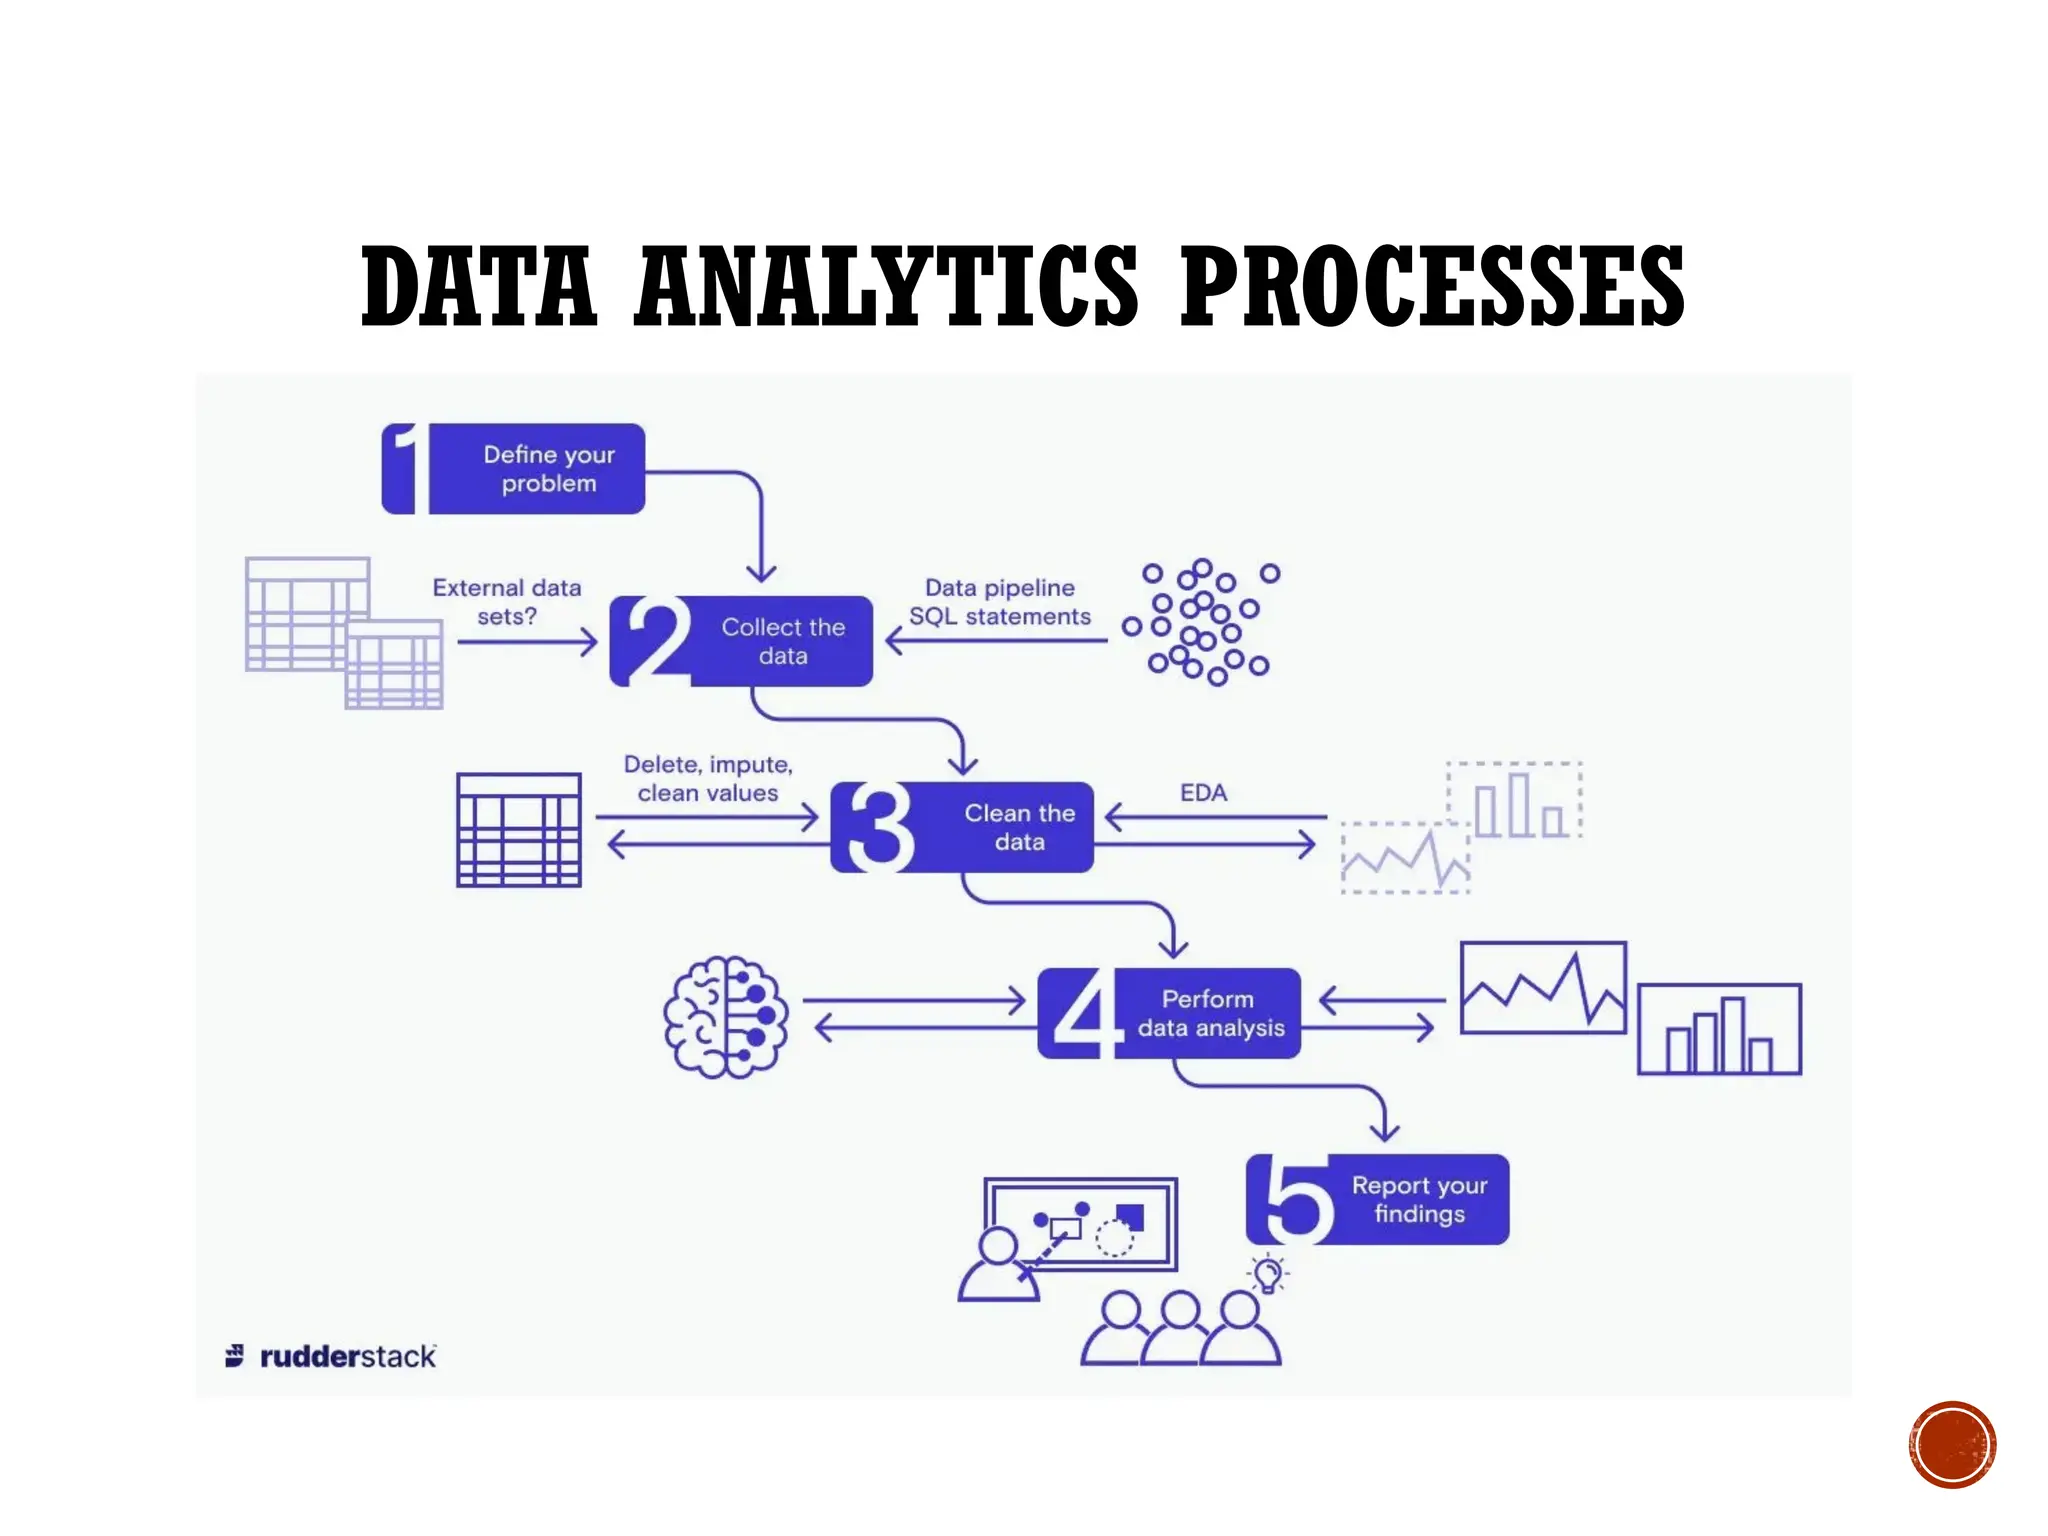
DATA ANALYTICS PROCESSES 1.Data Collection 2. Data Cleaning 3. Data Analysis and Data Interpretation 4. Data Visualisation
12.
DATA ANALYTICS PROCESSES 1.The first step is to collect raw data for analysis. 2. The next step is to clean the quality of the data: removing errors, duplicate entries etc. 3. Analytical models are created using software and other tools which interpret the data and understand it. 4. Creating visual representation of data using the plots, charts and graphs which helps to analyze the patterns, trends and get the valuable insights of the data.
13.
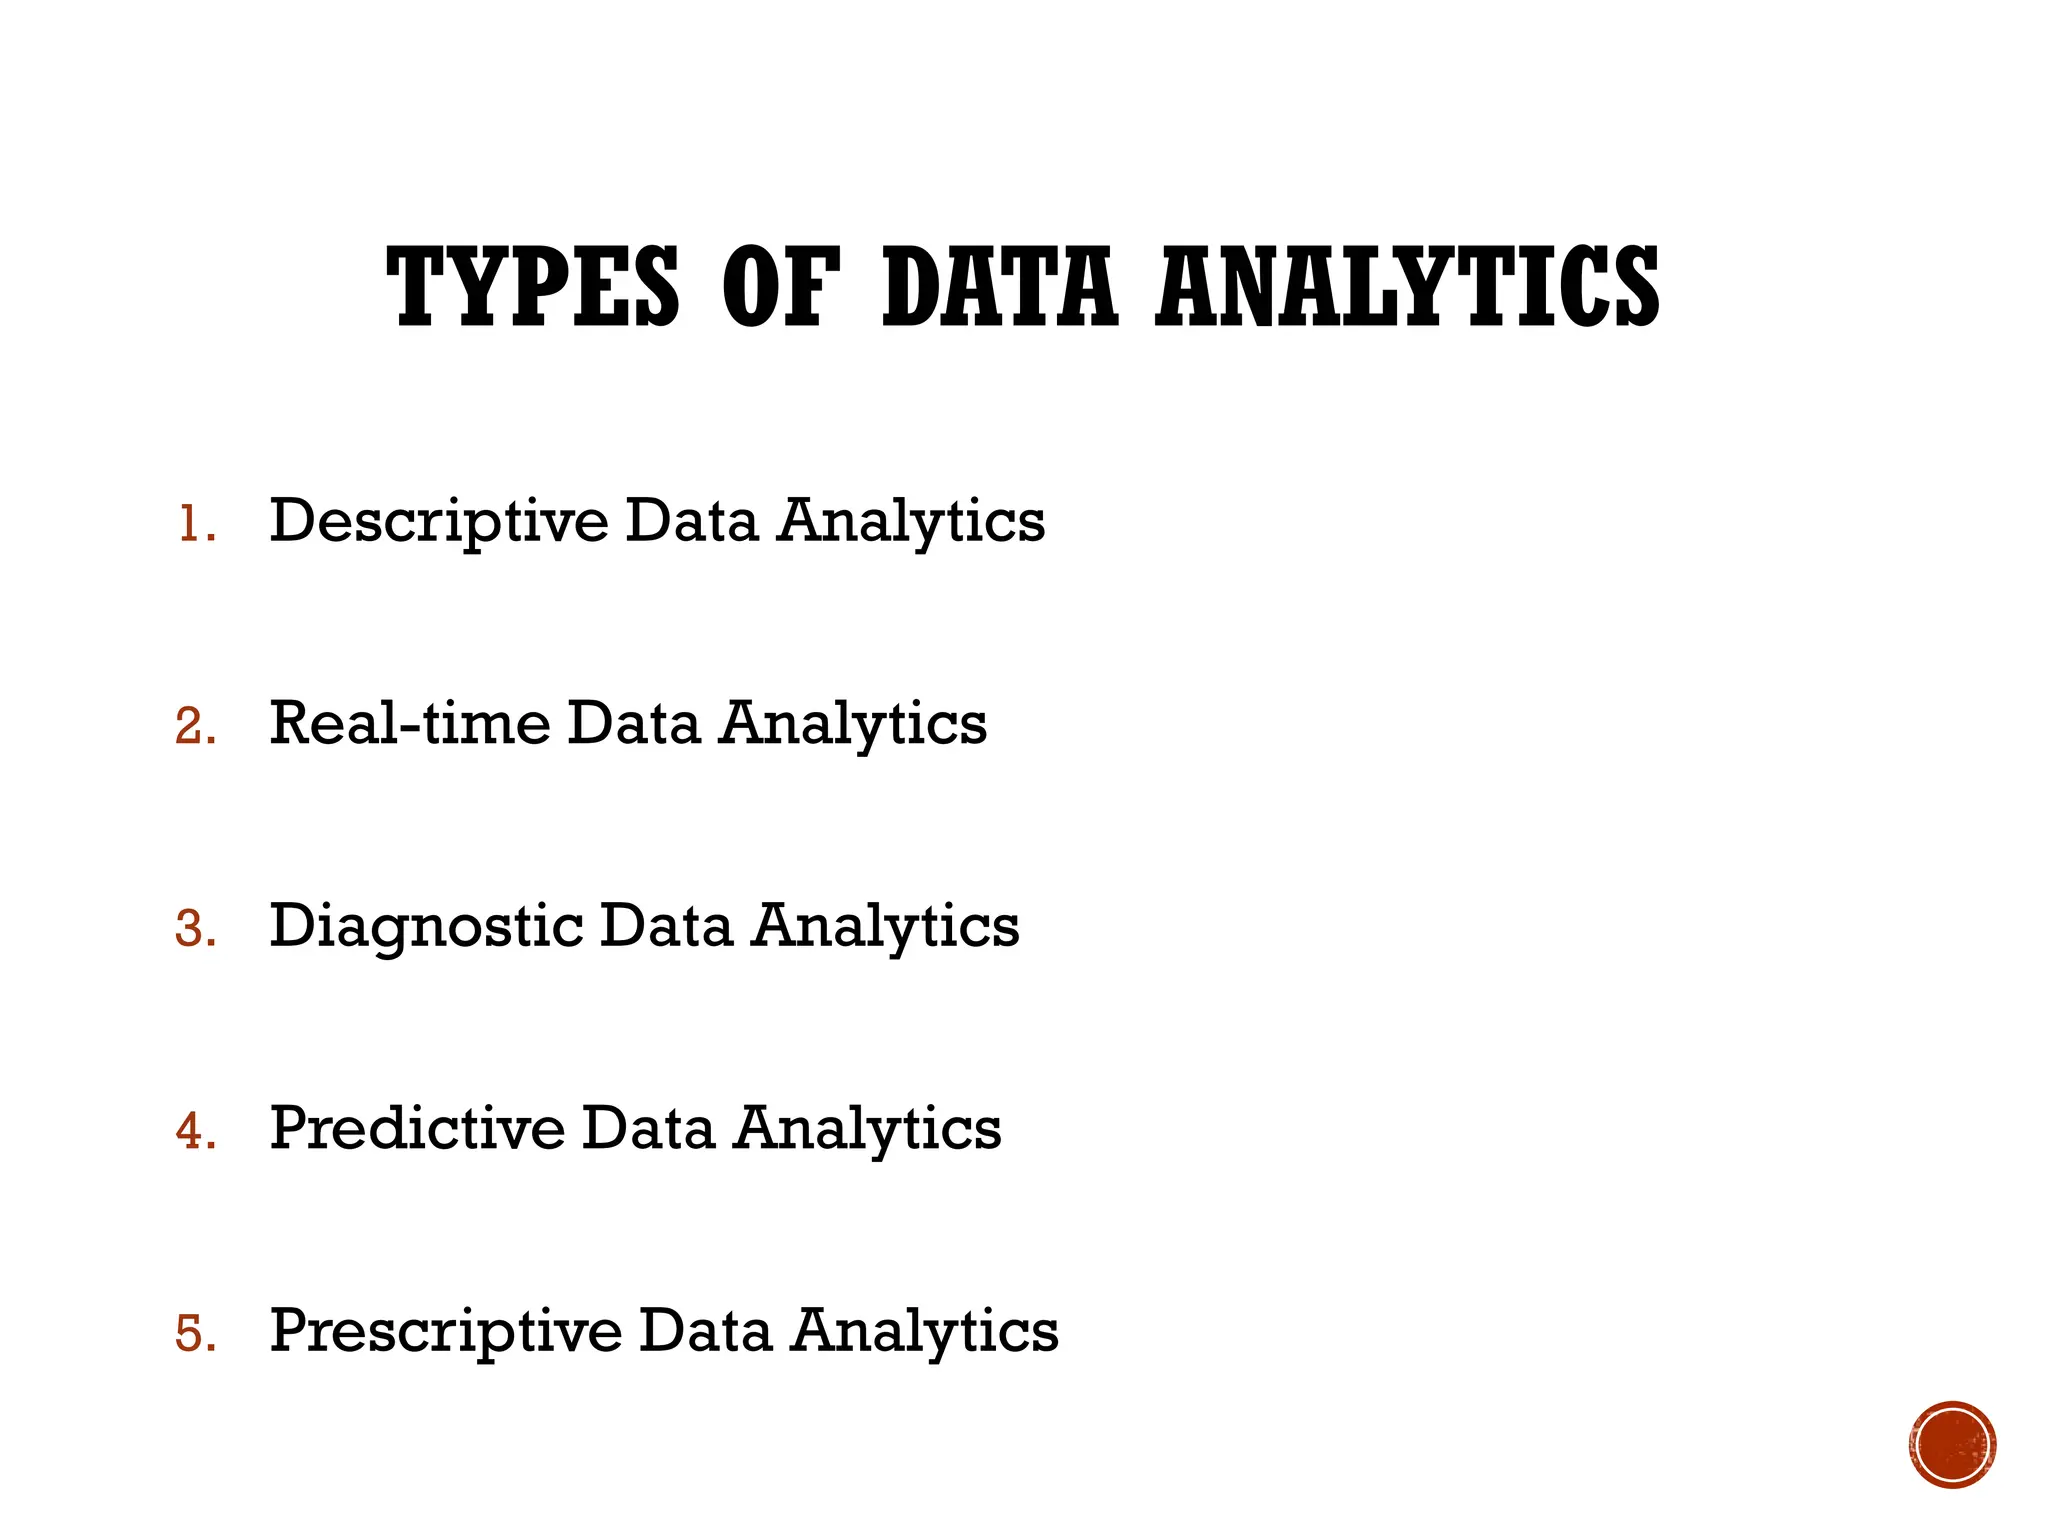
TYPES OF DATAANALYTICS 1. Descriptive Data Analytics 2. Real-time Data Analytics 3. Diagnostic Data Analytics 4. Predictive Data Analytics 5. Prescriptive Data Analytics
14.
TYPES OF DATAANALYTICS The different analytics types leverage different techniques and analysis algorithms. This implies that there may be varying data, data storage, and processing requirements to facilitate the delivery of multiple types of analytic results.
15.
DESCRIPTIVE DATA ANALYTICS Summarizes the data set and is used to compare the past results. Differentiates between the weakness and strength, and identify the anomalies. Used by the companies to identify the problems in the data set as it helps in identifying the patterns.
16.
DESCRIPTIVE DATA ANALYTICS Samplequestions can include: What was the sales volume over the past 12 months? What is the total number of support calls received as categorized by severity and geographic location? What is the monthly commission earned by each sales agent?
17.
REAL-TIME DATA ANALYTICS Doesn’t use data from past events. It involves using the data when the data is immediately entered in the database. Used by the companies to identify the trends and track the competitors’ operations.
18.
DIAGNOSTIC DATA ANALYTICS Uses past data sets to analyse the cause of an anomaly. Some of the techniques used in diagnostic analysis are correlation analysis, regression analysis and analysis of variance.
19.
DIAGNOSTIC DATA ANALYTICS Samplequestions can include: Why were Q2 sales less than Q1 sales? Why have there been more support calls originating from the Eastern region than from Western region? Why was there an increase in patient re-admission rates over the past three months?
20.
PREDICTIVE DATA ANALYTICS Analytics is done in the current data to predict future outcomes. Uses machine learning algorithms, statistical model techniques to identify the trends and patterns. Used in sales forecasting, to estimate the risk and to predict customer behaviour.
21.
PREDICTIVE DATA ANALYTICS Samplequestions can include: What are the chances that a customer will default a loan if they have missed a monthly payment? What will be the patient survival rate if Drug B is administered instead of Drug A? If a customer has purchased Products A and B, what are the chances that they will also purchase Product C?
22.
PRESCRIPTIVE DATA ANALYTICS An analysis of selecting best solutions to problems. Used in loan approval, pricing models, machine repair scheduling, analysing the decisions and so on. To automate decision making, companies use prescriptive data analysis.
23.
PRESCRIPTIVE DATA ANALYTICS Samplequestions may include: Among three drugs, which one provides the best results? When is the best time to trade a particular stock?
24.
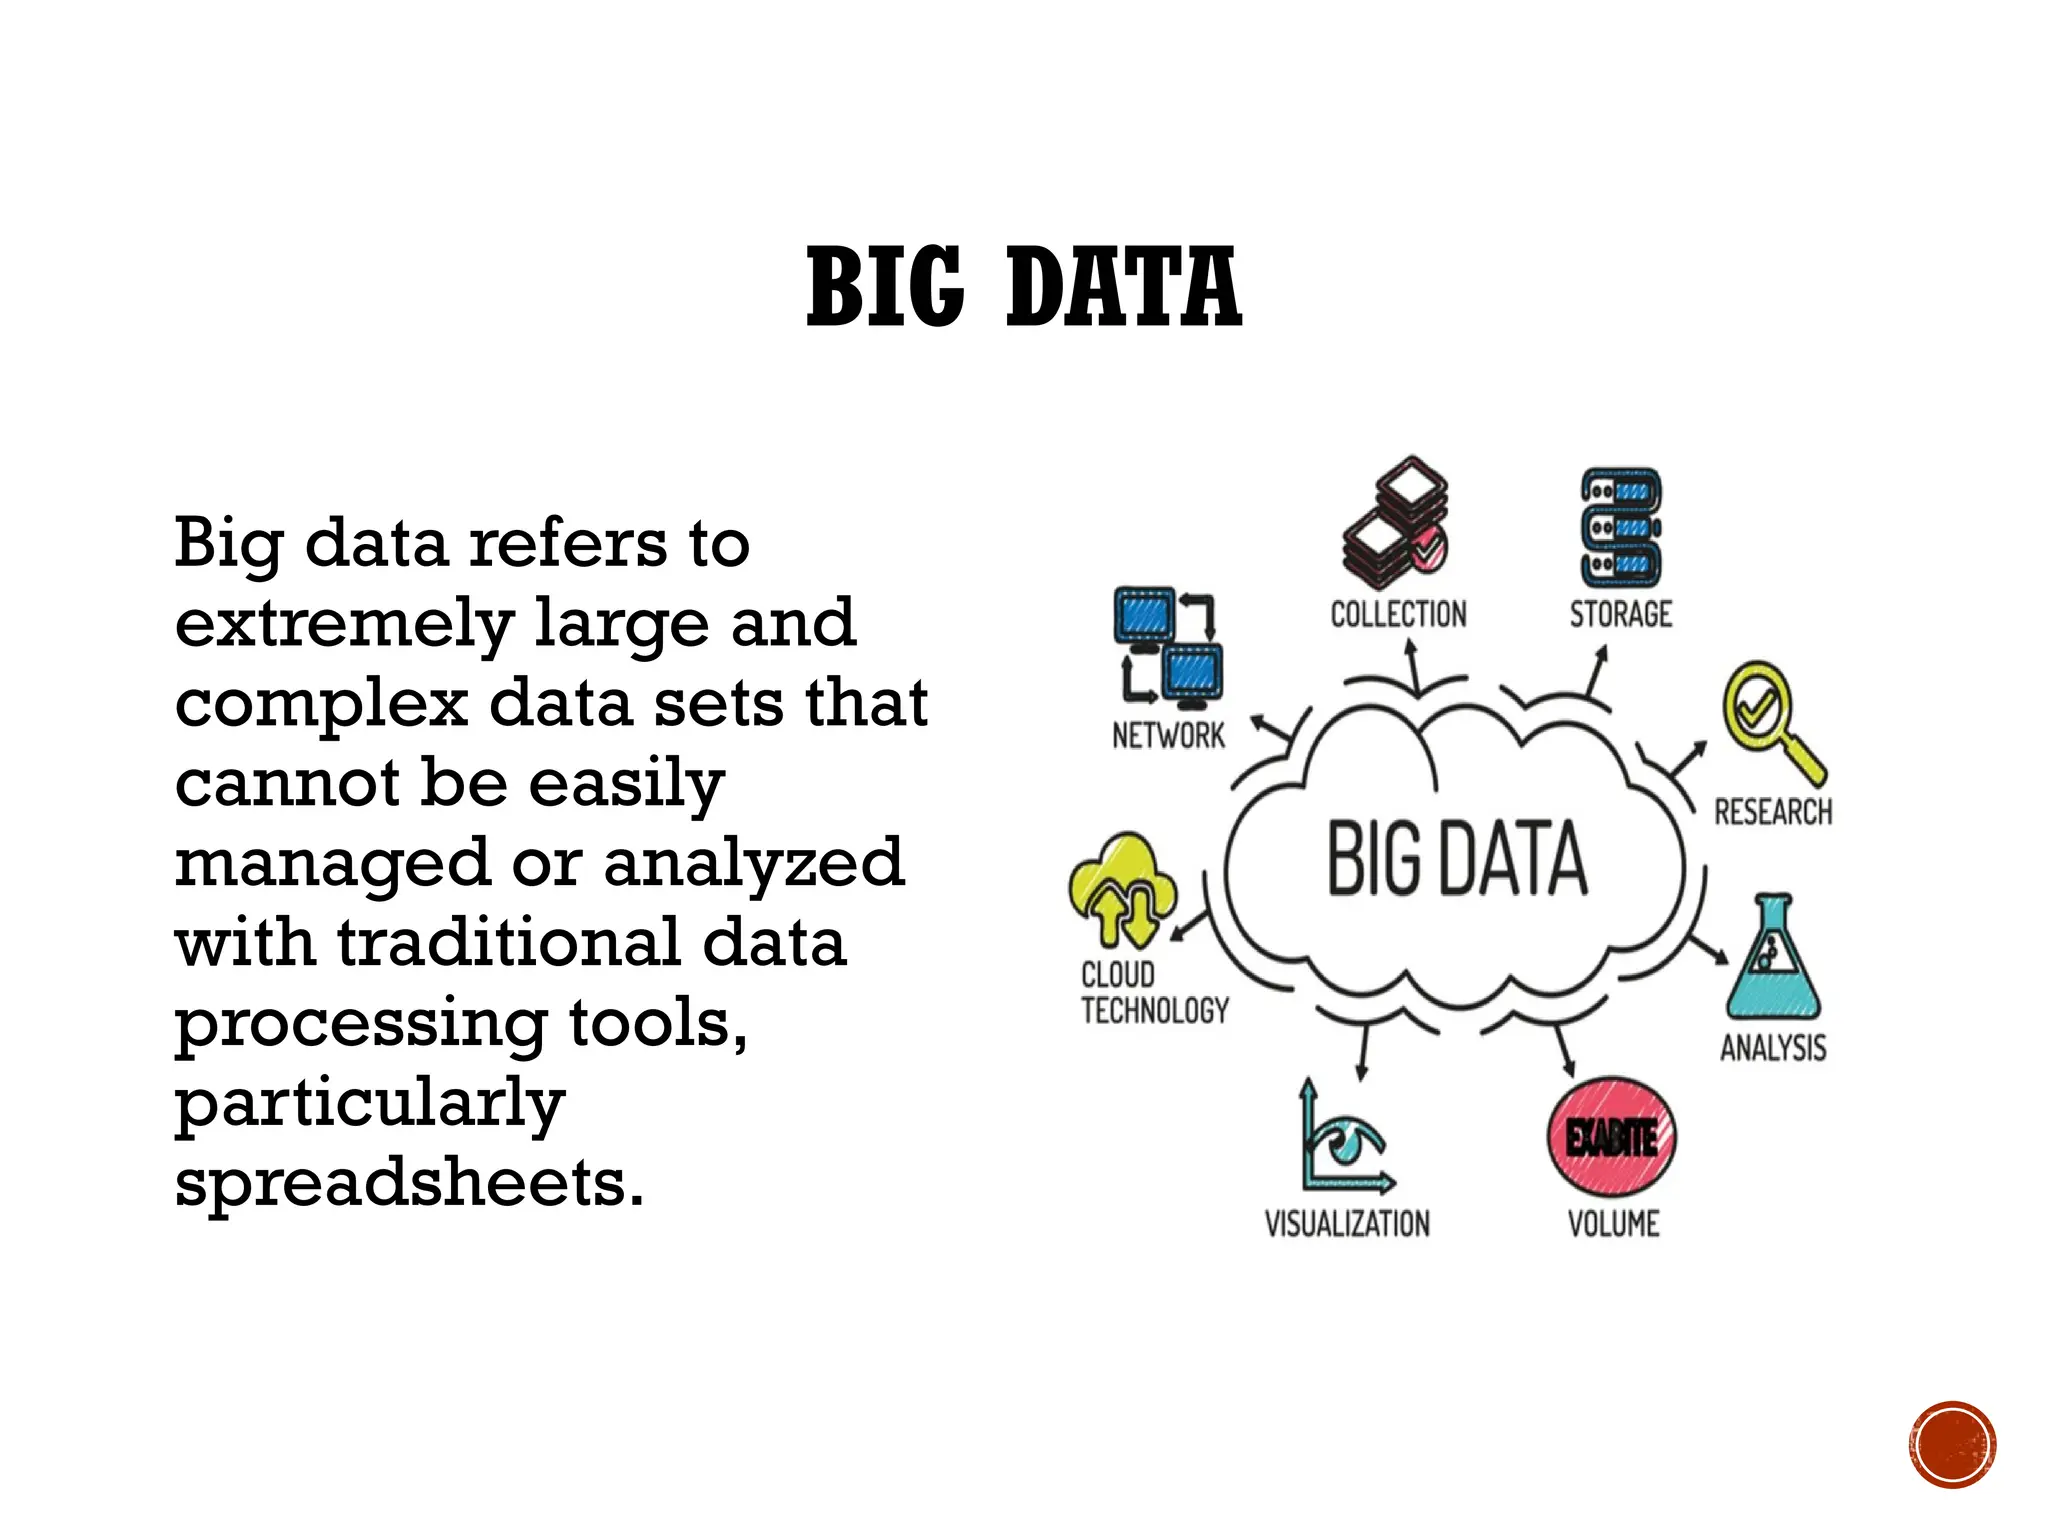
BIG DATA Big datarefers to extremely large and complex data sets that cannot be easily managed or analyzed with traditional data processing tools, particularly spreadsheets.
25.
BIG DATA Bigdata includes structured data, like an inventory database or list of financial transactions; unstructured data, such as social posts or videos; and mixed data sets, like those used to train large language models for AI. These data sets might include anything from the works of Shakespeare to a company’s budget spreadsheets for the last 10 years.
26.
BIG DATA EXAMPLES The New York Stock Exchange generates about one terabyte of new trade data per day. 500+terabytes of new data get ingested into the databases of social media site Facebook, every day, mainly generated in terms of photo and video uploads, message exchanges, putting comments etc. A single Jet engine can generate 10+terabytes of data in 30 minutes of flight time.With many thousand flights per day, generation of data reaches up to many Petabytes.
27.
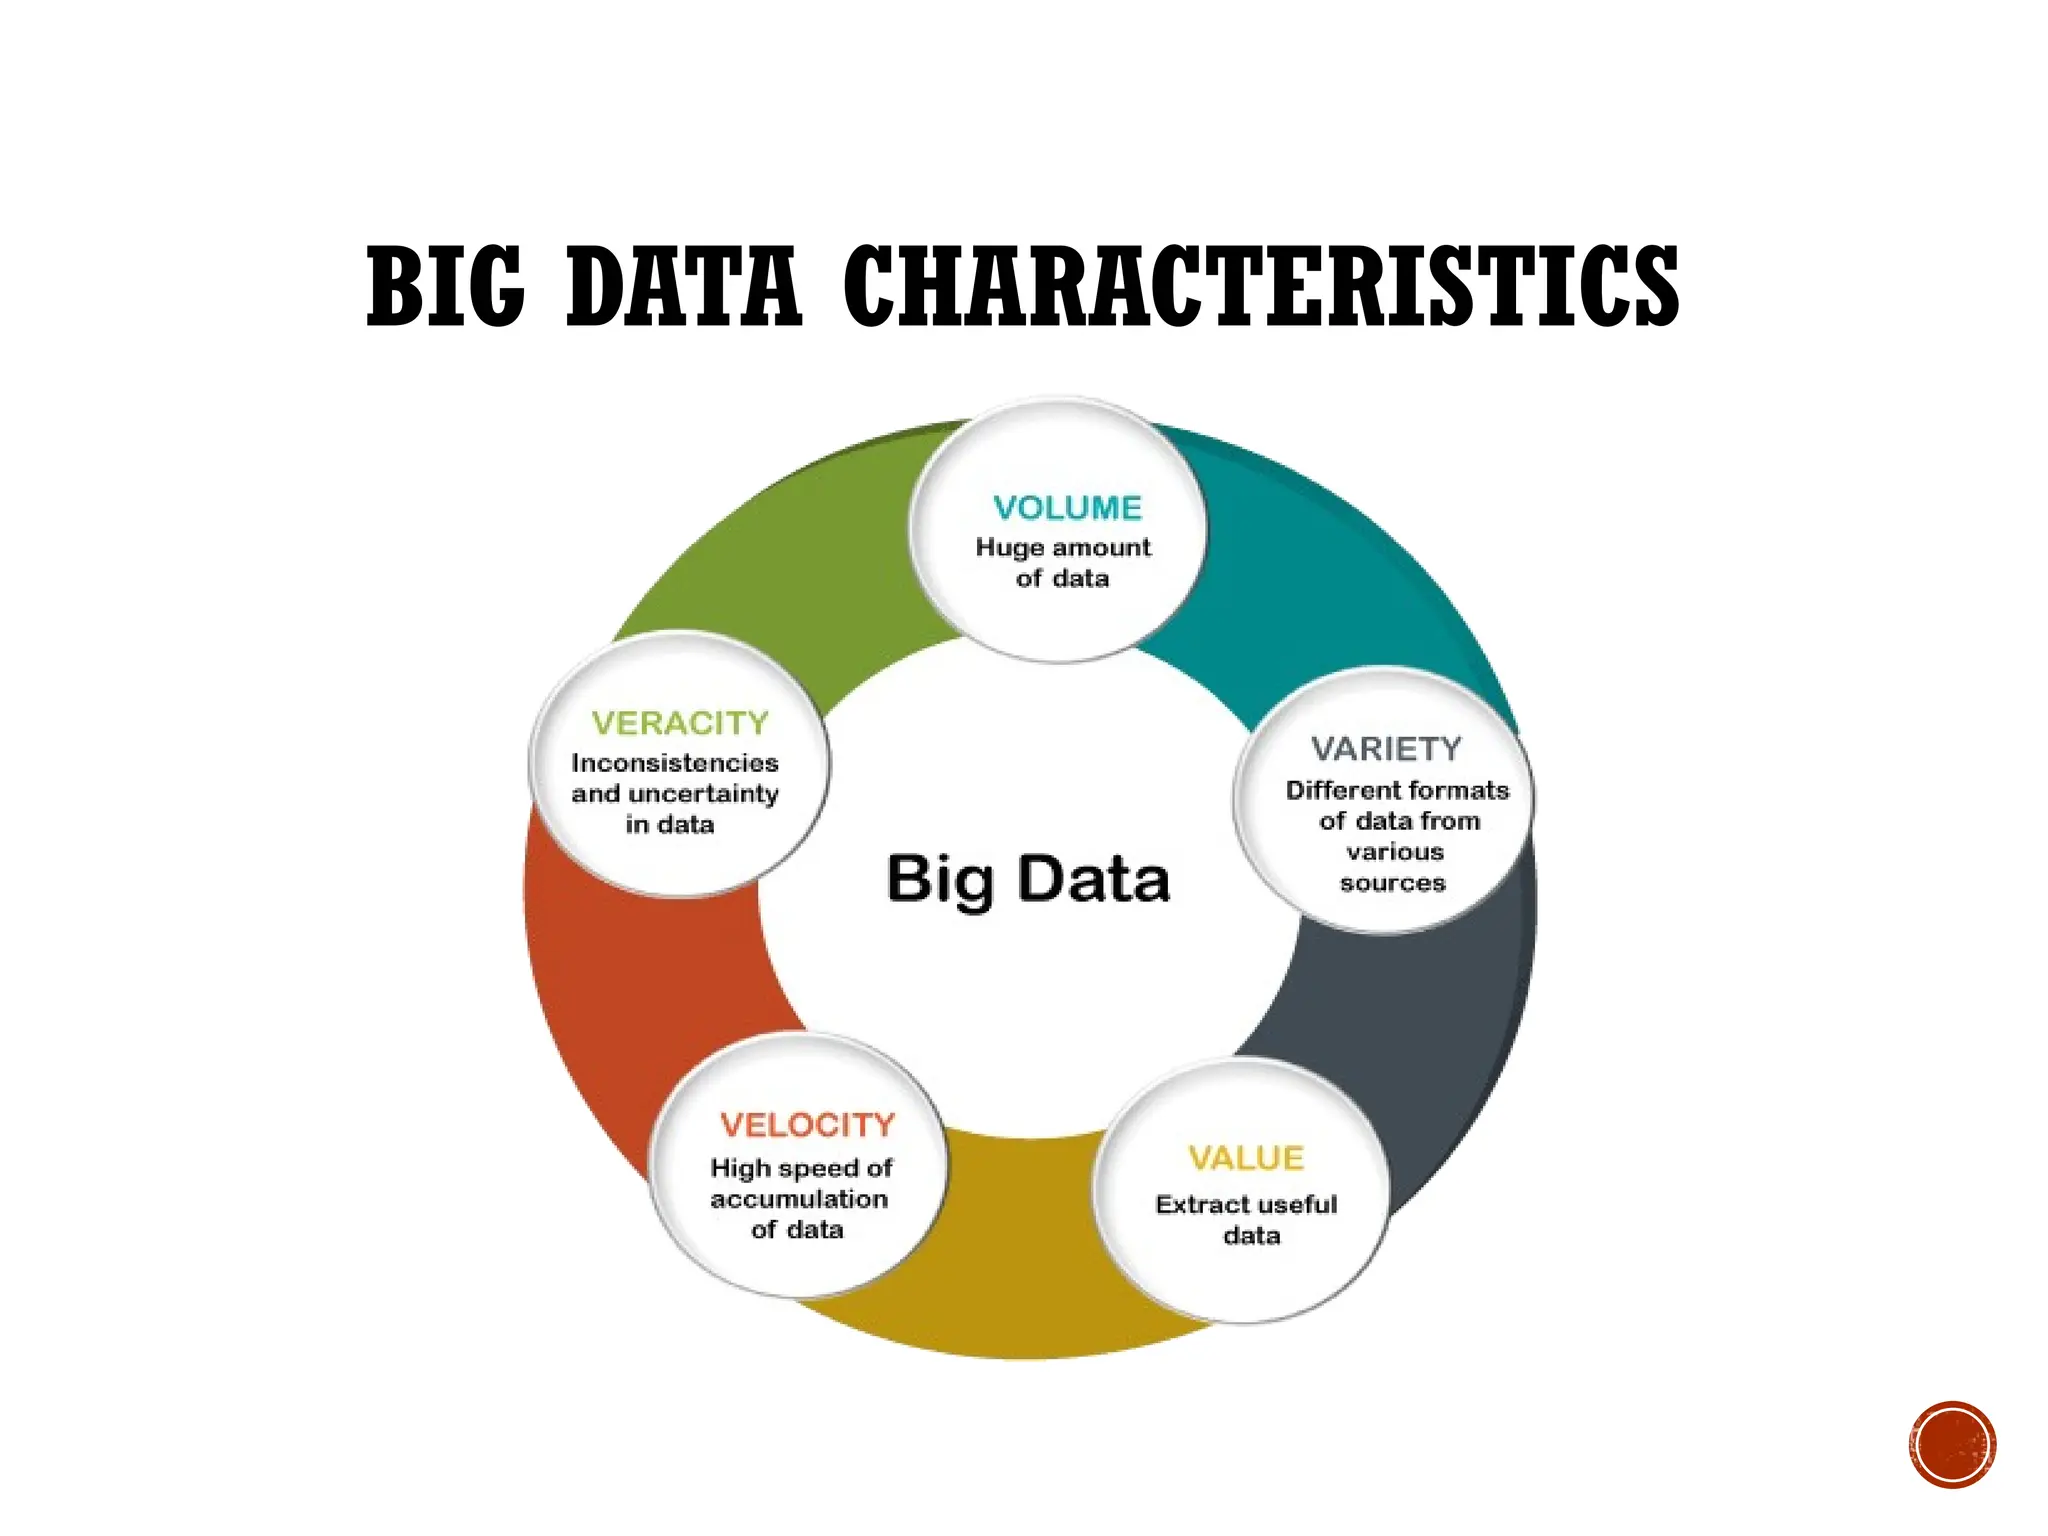
BIG DATA CHARACTERISTICS For a dataset to be considered Big Data, it must possess one or more characteristics that require accommodation in the solution design and architecture of analytic environment. There are primarily five characteristics that can help differentiate data characterised as “Big” from other forms of data.
BIG DATA CHARACTERISTICS Volume The anticipated volume of data that is processed by big data solutions is substantial and ever-growing. Higher volumes impose distinct data storage and processing demands, as well as additional data preparation, curation and management processes.
30.
BIG DATA CHARACTERISTICS Velocity- Data can arrive at fast speeds, and enormous dataset can accumulate within very short span of time. The velocity of data translates into the amount of time it takes for the data to be processed once it enters the enterprise’s perimeter.
31.
BIG DATA CHARACTERISTICS Variety- Refers to multiple formats and types of data that need to be supported by Big Data solutions. It brings challenges for enterprises in terms of data integration,, transformation, processing, and storage.
32.
BIG DATA CHARACTERISTICS Veracity- Refers to quality of data. Data that enters the big data environments need to be assessed for quality, which can lead to data processing activities to resolve invalid data and remove noise.
33.
BIG DATA CHARACTERISTICS Value- Defined as usefulness of data for an enterprise. Higher the data quality, the more value it holds for the business. The longer it takes for data to be turned into meaningful information, the less value it has for a business.
34.
BIG DATA CHARACTERISTICS Twomore ‘Vs’ Variability- Refers to establishing if the contextualizing structure of the data stream is regular and dependable even in conditions of extreme unpredictability. It defines the need to get meaningful data considering all possible circumstances. Visualization- Using charts and graphs to visualize large amounts of complex data is much more effective in conveying meaning than spreadsheets and reports full of numbers and formulas.
NATURE OF DATA Data generated by big data solutions can be human- generated or machine-generated. It is ultimately the responsibility of machines to generate analytic results.
39.
NATURE OF DATA Human generated data is the result of human interaction with systems. E.g. online services and digital services
40.
NATURE OF DATA Machine generated data is generated by software programs and hardware devices in response to real- world events. E.g. a log file captures an authorization decision made by a security service, information conveyed from the numerous sensors in a cellphone that may be reporting information, including position and cell tower signal strength.
41.
NATURE OF DATA Primarytypes of data are- 1. Structured 2. Unstructured 3. Semi-structured
42.
STRUCTURED DATA Confirmsto a data model or schema and is often stored in tabular form. Used to capture relationships between different entities and is therefore most often stored in a relational database.
43.
UNSTRUCTURED DATA Doesnot confirm to a data model or data schemas. This form of data is either textual or binary and often conveyed via files that are self-contained and non- relational.
44.
UNSTRUCTURED DATA Makesup 80% of the data within any given enterprise. Has a faster growth rate than structured data.
45.
SEMI-STRUCTURED DATA Ithas a defined level of structure and consistency, but is not relational in nature. Instead, it is hierarchical or graph-based.
46.
SEMI-STRUCTURED DATA Thiskind of data is commonly stored in files that contain text. Due to textual nature of this data and its conformance to some level of structure, it is more easily processed than unstructured data. XML and SON files are common forms of semi- structured data
47.
SOURCES OF BIGDATA 1. Social networks 2. Traditional business systems 3. Internet of Things
48.
SOURCES OF BIGDATA Social networks- Social networking sites Blogs and comments Personal documents Pictures: Instagram, Flickr, Picasa etc. Videos:YouTube etc. Internet searches Mobile data content: text messages User-generated maps E-Mail
49.
SOURCES OF BIGDATA Traditional business systems- Data produced by Public Agencies Medical records Data produced by businesses Commercial transactions Banking/stock records E-commerce Credit cards
50.
SOURCES OF BIGDATA Internet of Things- Data from sensors Fixed sensors Home automation Weather/pollution sensors Traffic sensors/webcam Scientific sensors Security/surveillance videos/images Mobile sensors (tracking) Mobile phone location Cars Satellite images
51.
DATA SCIENCE Data sciencecombines Mathematics and Statistics, specialized programming, Advanced Analytics, Artificial Intelligence (AI) and Machine Learning with specific subject matter expertise to uncover actionable insights hidden in an organization’s data. These insights can be used to guide decision making and strategic planning.
52.
DATA SCIENCE Datascience is the study of data to extract meaningful insights for business. It is a multidisciplinary approach that combines principles and practices from the fields of mathematics, statistics, artificial intelligence, and computer engineering to analyze large amounts of data. This analysis helps data scientists to ask and answer questions like what happened, why it happened, what will happen, and what can be done with the results.
53.
HOW DATA SCIENCEIS APPLIED? Data science incorporates tools from multiple disciplines to gather a data set, process, and derive insights from the data set, extract meaningful data from the set, and interpret it for decision-making purposes. The disciplinary areas that make up the data science field include mining, statistics, machine learning, analytics, and programming.
54.
DATA SCIENCE LIFECYCLE The data science lifecycle involves various roles, tools, and processes, which enables analysts to glean actionable insights. Typically, a data science project undergoes the following stages: 1. Data ingestion 2. Data storage and processing 3. Data analytics 4. Communicate
55.
DATA SCIENTIST Adata scientist is an analytics professional who is responsible for collecting, analyzing and interpreting data to help drive decision-making in an organization. The data scientist role combines elements of several traditional and technical jobs, including mathematician, scientist, statistician and computer programmer. It involves the use of advanced analytics techniques, such as machine learning and predictive modeling, along with the application of scientific principles.
56.
DATA ANALYTIC TOOLS Data Analysis Tools are there to help Data Analysts make sense of Data and perform necessary actions accordingly. This Software helps the company improve by increasing efficiency and profits. There are various tools for Data Analytics, and each one is different and provides some exciting features.
57.
DATA ANALYTIC TOOLS 1.Tableau 2. Power BI 3. Apache Spark 4. TensorFlow 5. Hadoop 6. R 7. Python 8. SAS 9. QlikSense 10. KNIME