Downloaded 3,948 times


![Box plot >par(mfrow=c(1,2)) > plot(iris$Petal.Length) >boxplot(iris$Petal.Length~ iris$Species) > par(mfrow=c(2,2)) # to draw four figs in one window > for(i in 1:4) boxplot(iris[,i] ~ Species, data=iris, main=names(iris)[i])](https://image.slidesharecdn.com/irisdataanalysiswithr-140801203600-phpapp02/75/Iris-data-analysis-example-in-R-13-2048.jpg)
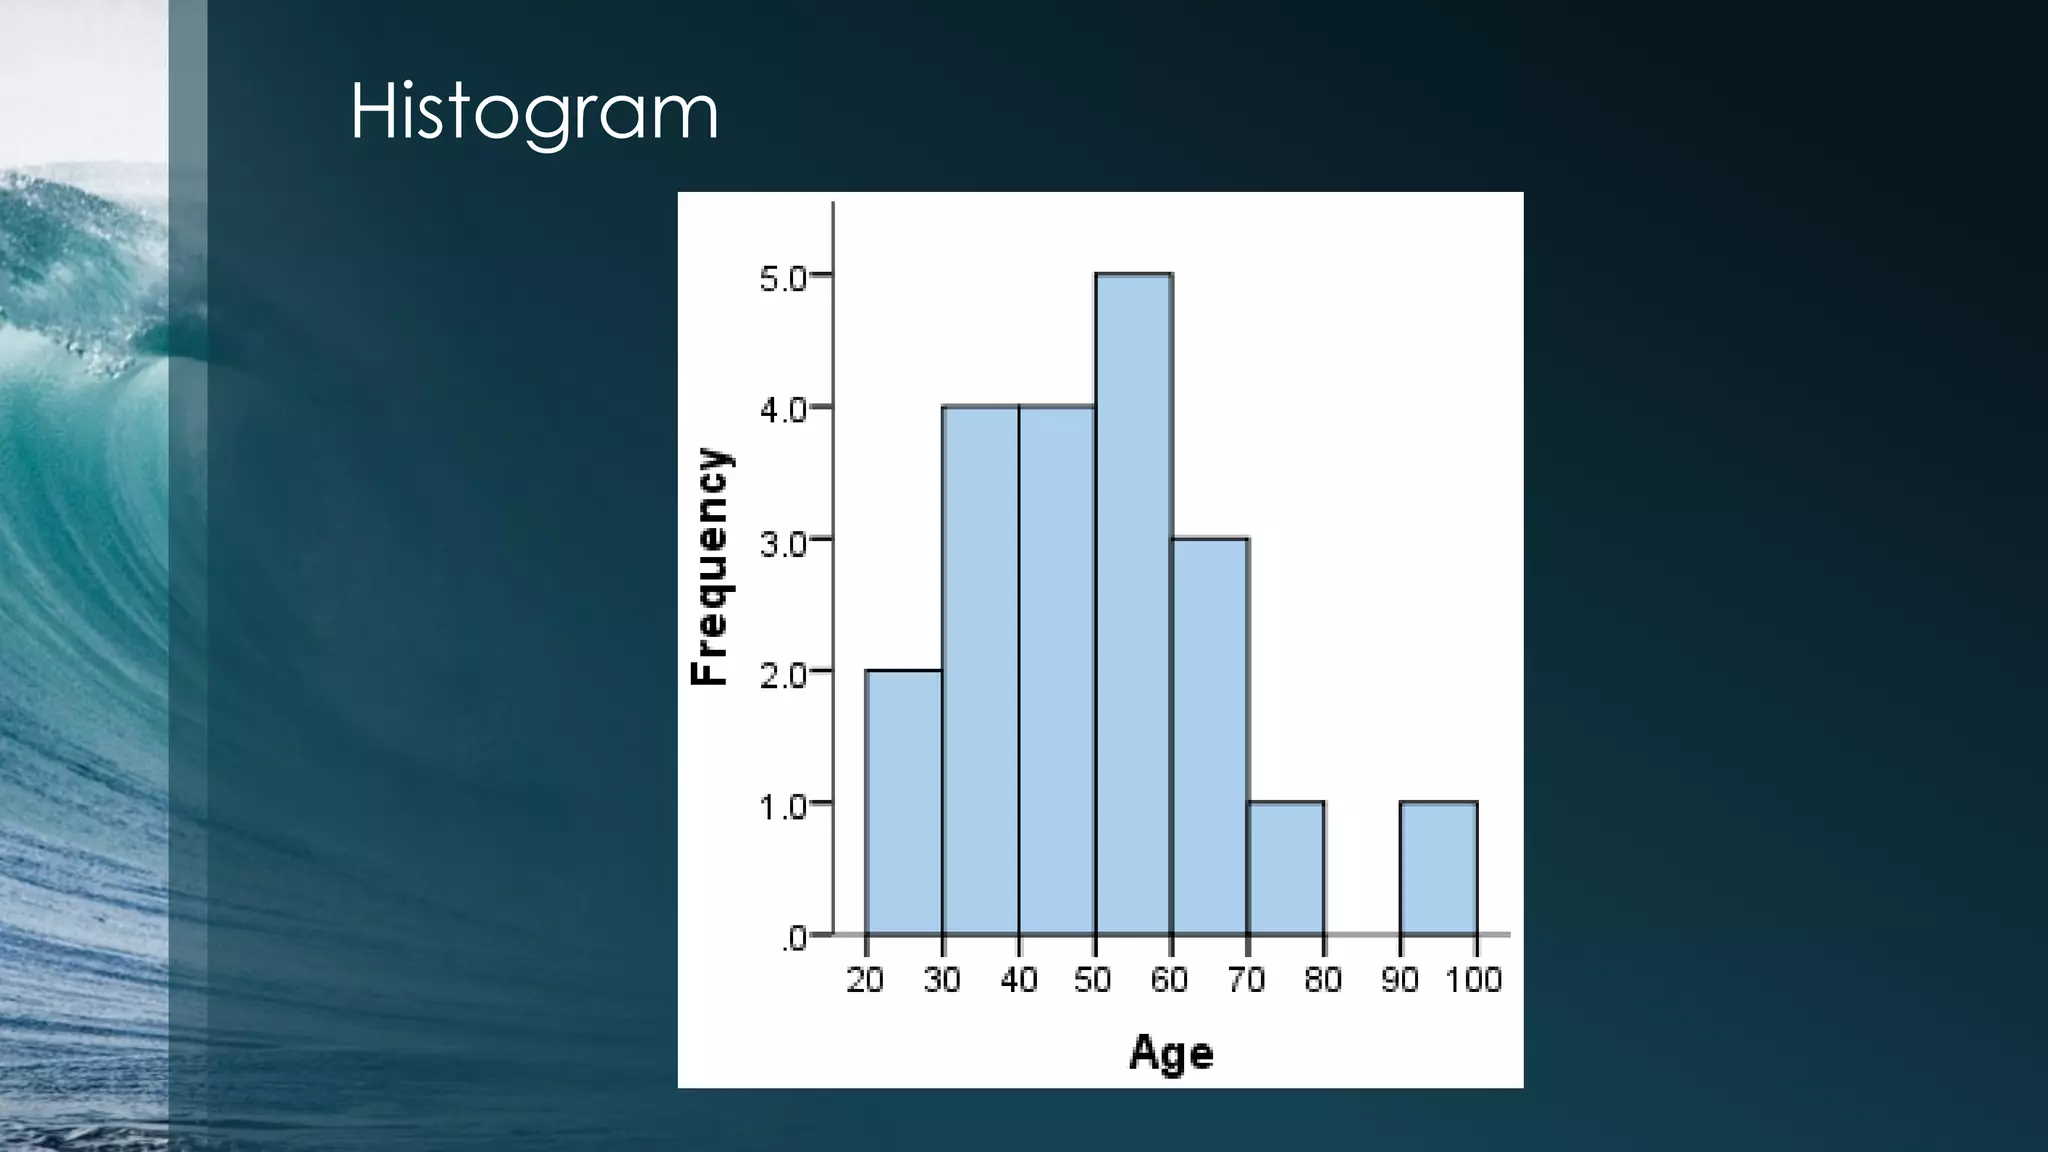


![Histogram > par(mfrow=c(1,1)) >hist(iris$Petal.Length[1:50]) Subsetting: >iris$Sepal.Length[1:50] >iris$Sepal.Length[-(1:50)] Select by name: >iris$Sepal.Length[iris$Species == "setosa"] Change the order of data frame: >iris.ordered<-iris[order(iris$Sepal.Length),]](https://image.slidesharecdn.com/irisdataanalysiswithr-140801203600-phpapp02/75/Iris-data-analysis-example-in-R-18-2048.jpg)


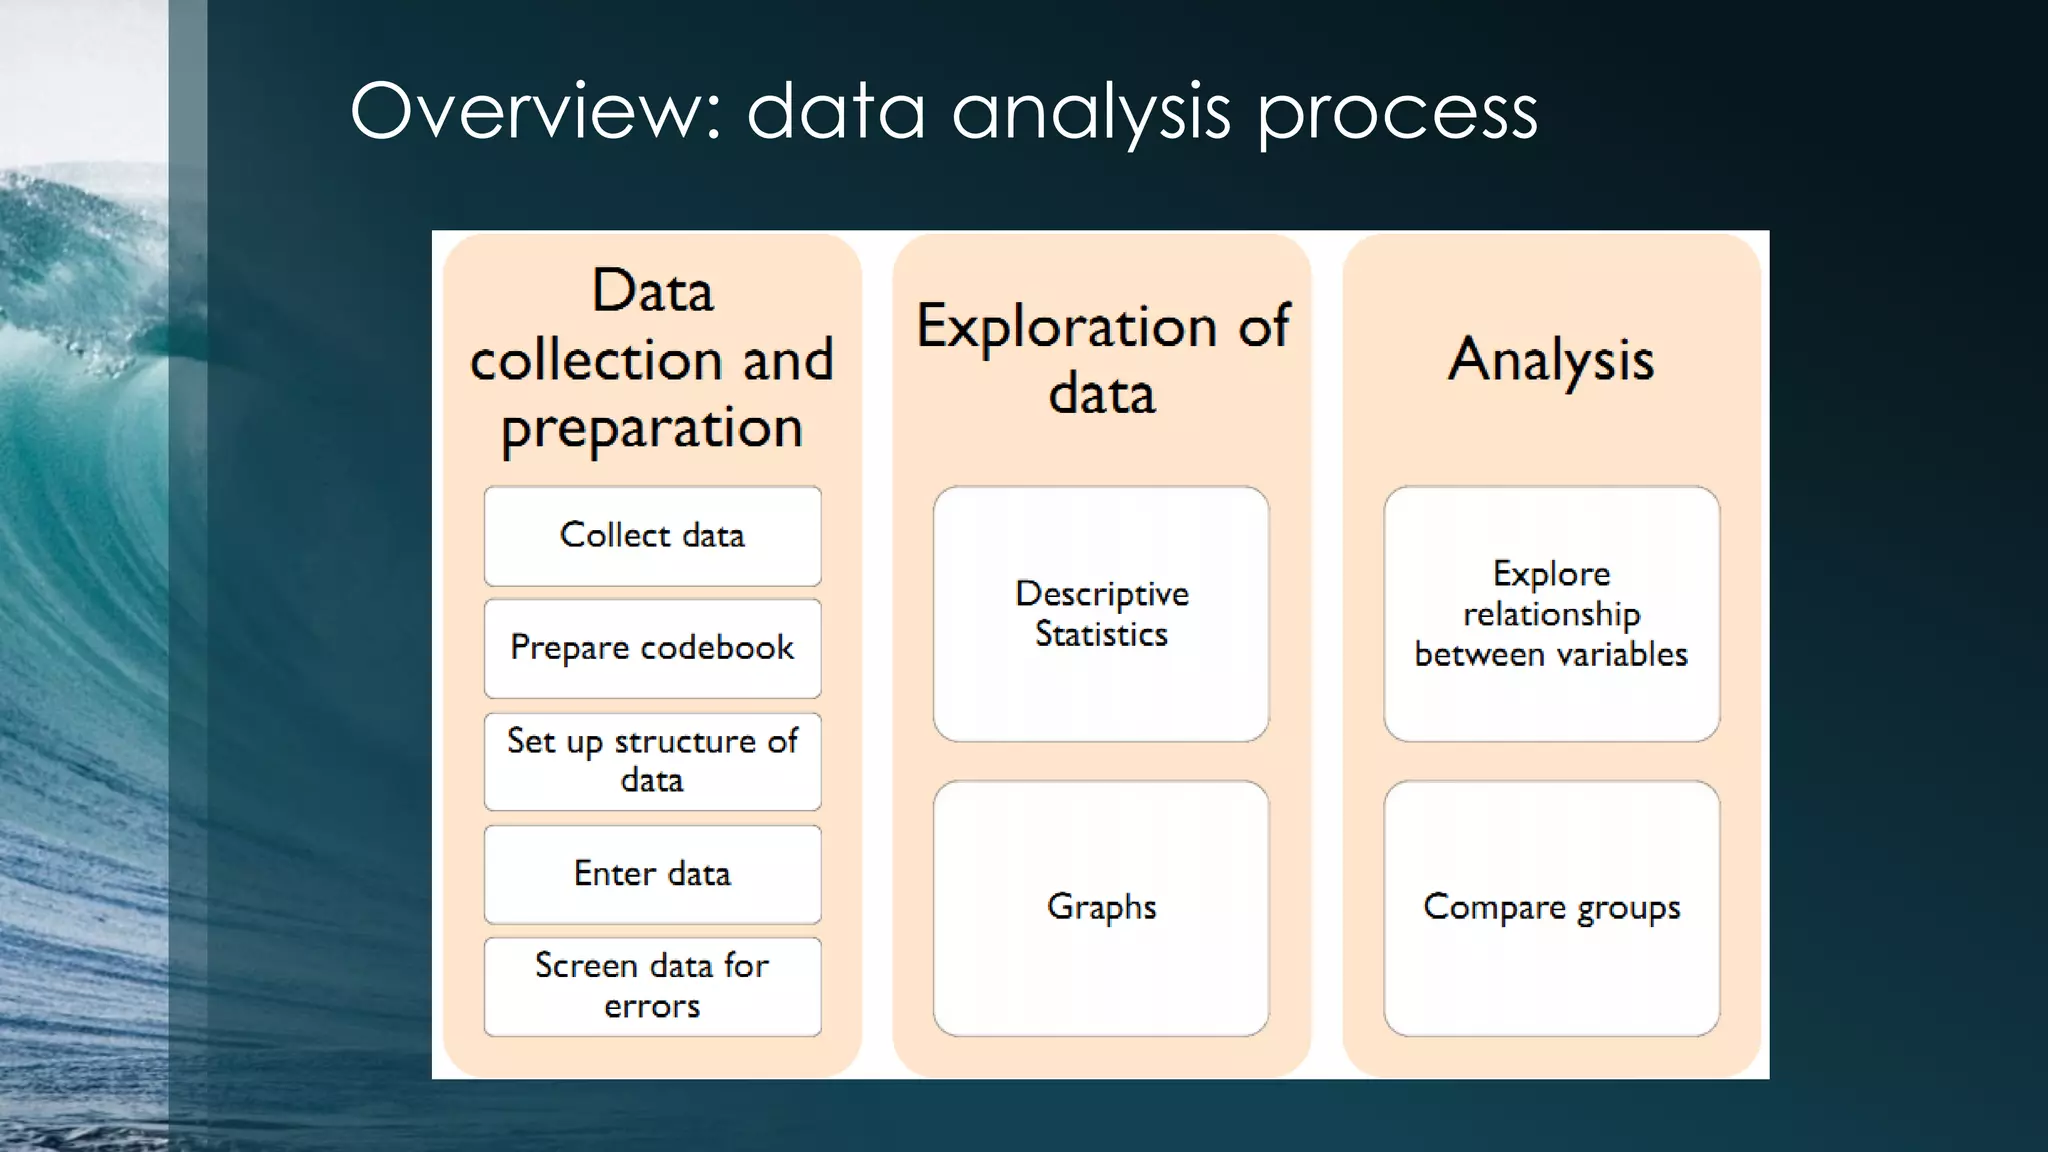
This document discusses analyzing the Iris flower data set using R. It provides an overview of the Iris data, which contains measurements of Iris flowers from three species. Various data exploration techniques are demonstrated, including scatter plots, box plots, histograms and outlier detection. Clustering, classification and regression algorithms are explored, such as k-means clustering, Fisher's linear discriminant analysis, and linear regression. The document serves as a tutorial for analyzing a sample data set using common statistical and machine learning methods in R.