![Copyright © 2017, Oracle and/or its affiliates. All rights reserved. | Oracle Enterprise Manager : One Tool to Manage Them All! • Manage hardware – Servers – Network switches/hubs – Storage appliances • Manage Virtualization – Oracle VM – VMware vSphere • Manage Cloud – Oracle Cloud – OpenStack – AWS • Manage databases – Oracle Database • Including full DBaaS functionality – SQL Server Plugin – DB2 Plugin – Sybase Plugin – Postgres Plugin – Times Ten Plugin – New MySQL Plugin! • Manage applications – Apache [Tomcat], IIS – Weblogic, Websphere – Oracle Directory Server, Windows Active Directory – JVM, Microsoft .NET – Siebel, Peoplsoft – Oracle Fusion • Manage BI tools • Manage networks – F5, Dell Force10, … 9](https://image.slidesharecdn.com/mysqlinoracleenvironmentspartiimysqlenterprisemonitororacleenterprisemonitorintegrated-171003104006/75/MySQL-in-oracle_environments-Part-2-MySQL-Enterprise-Monitor-Oracle-Enterprise-monitor-integrated-9-2048.jpg)
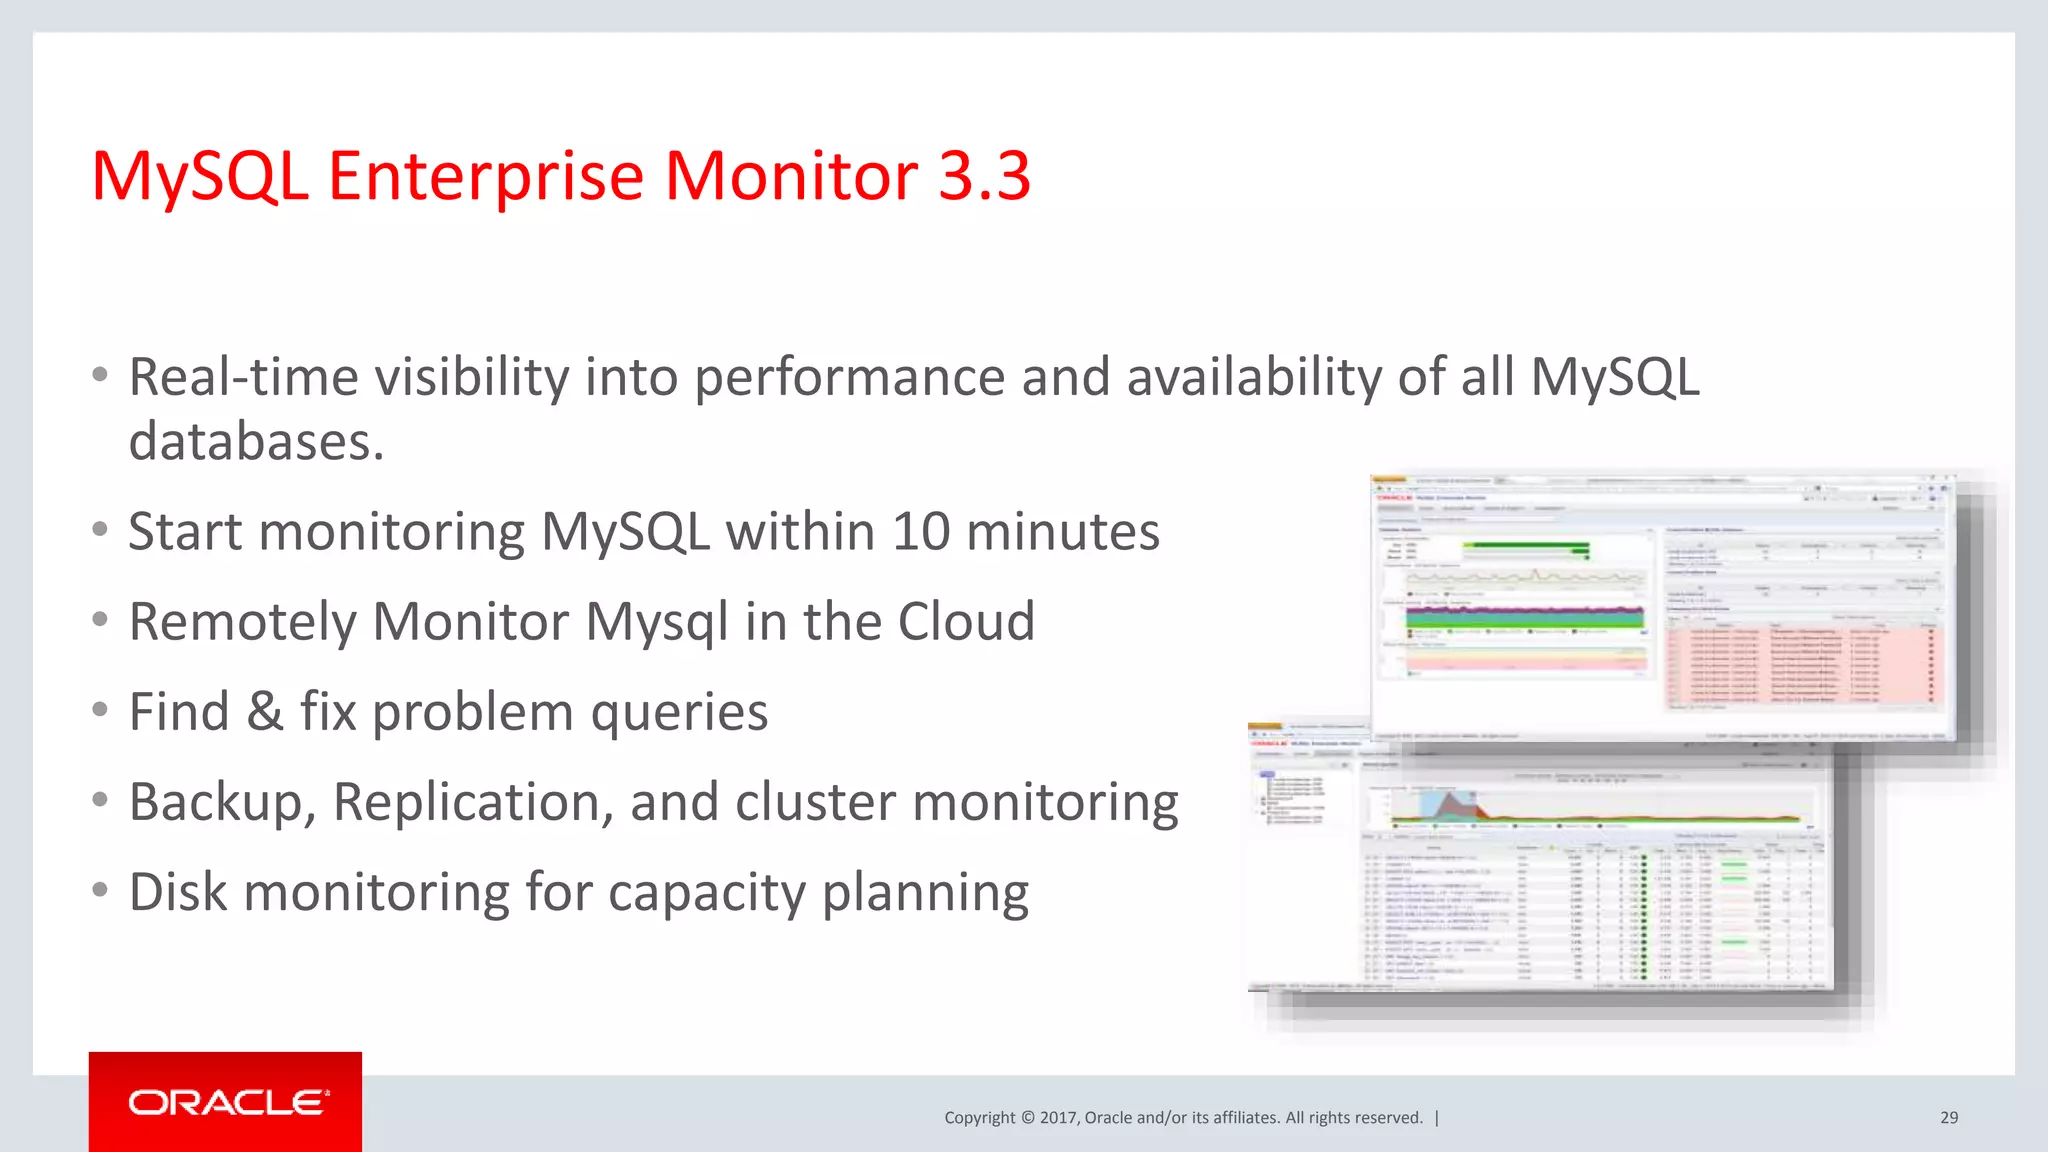
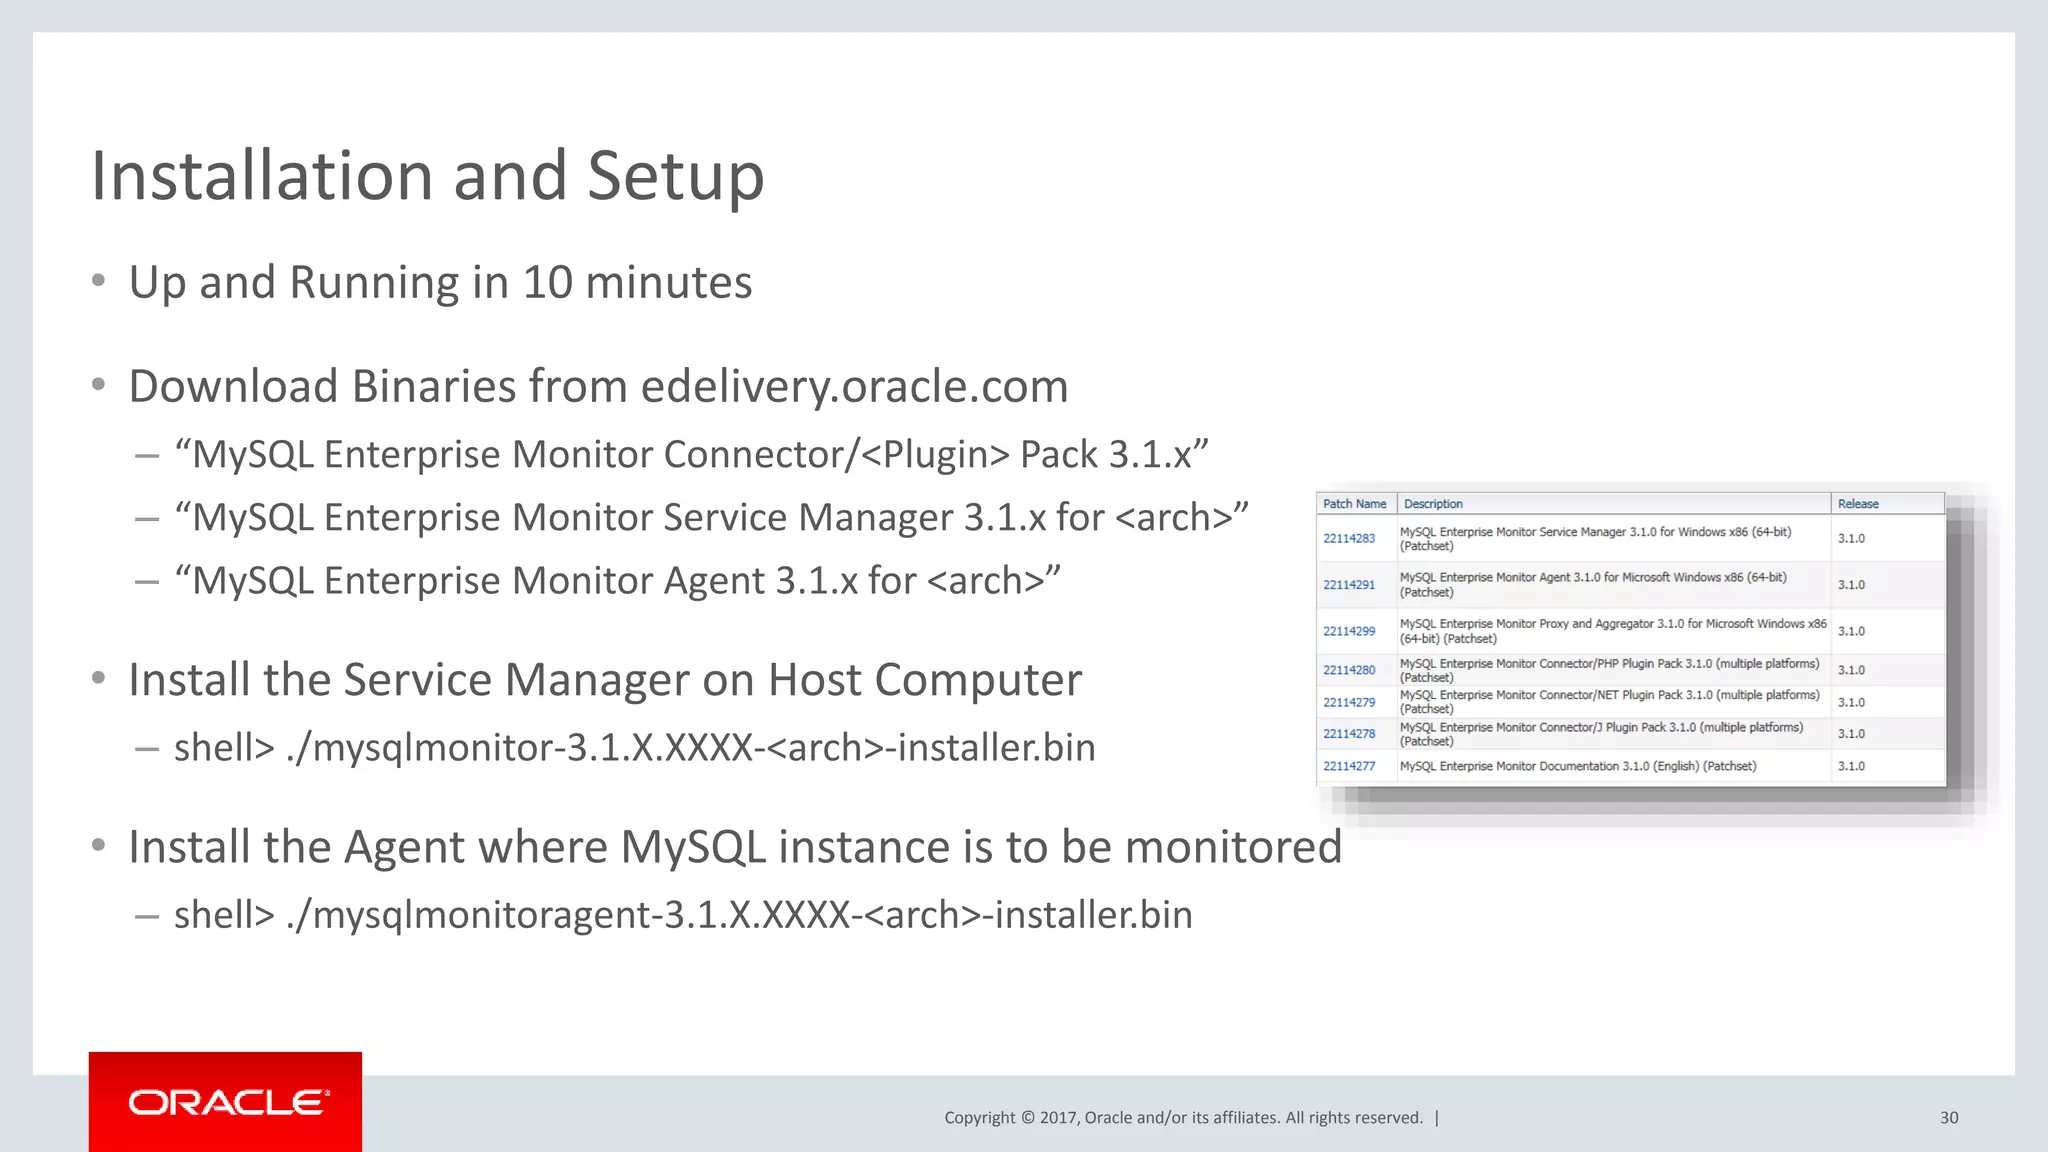
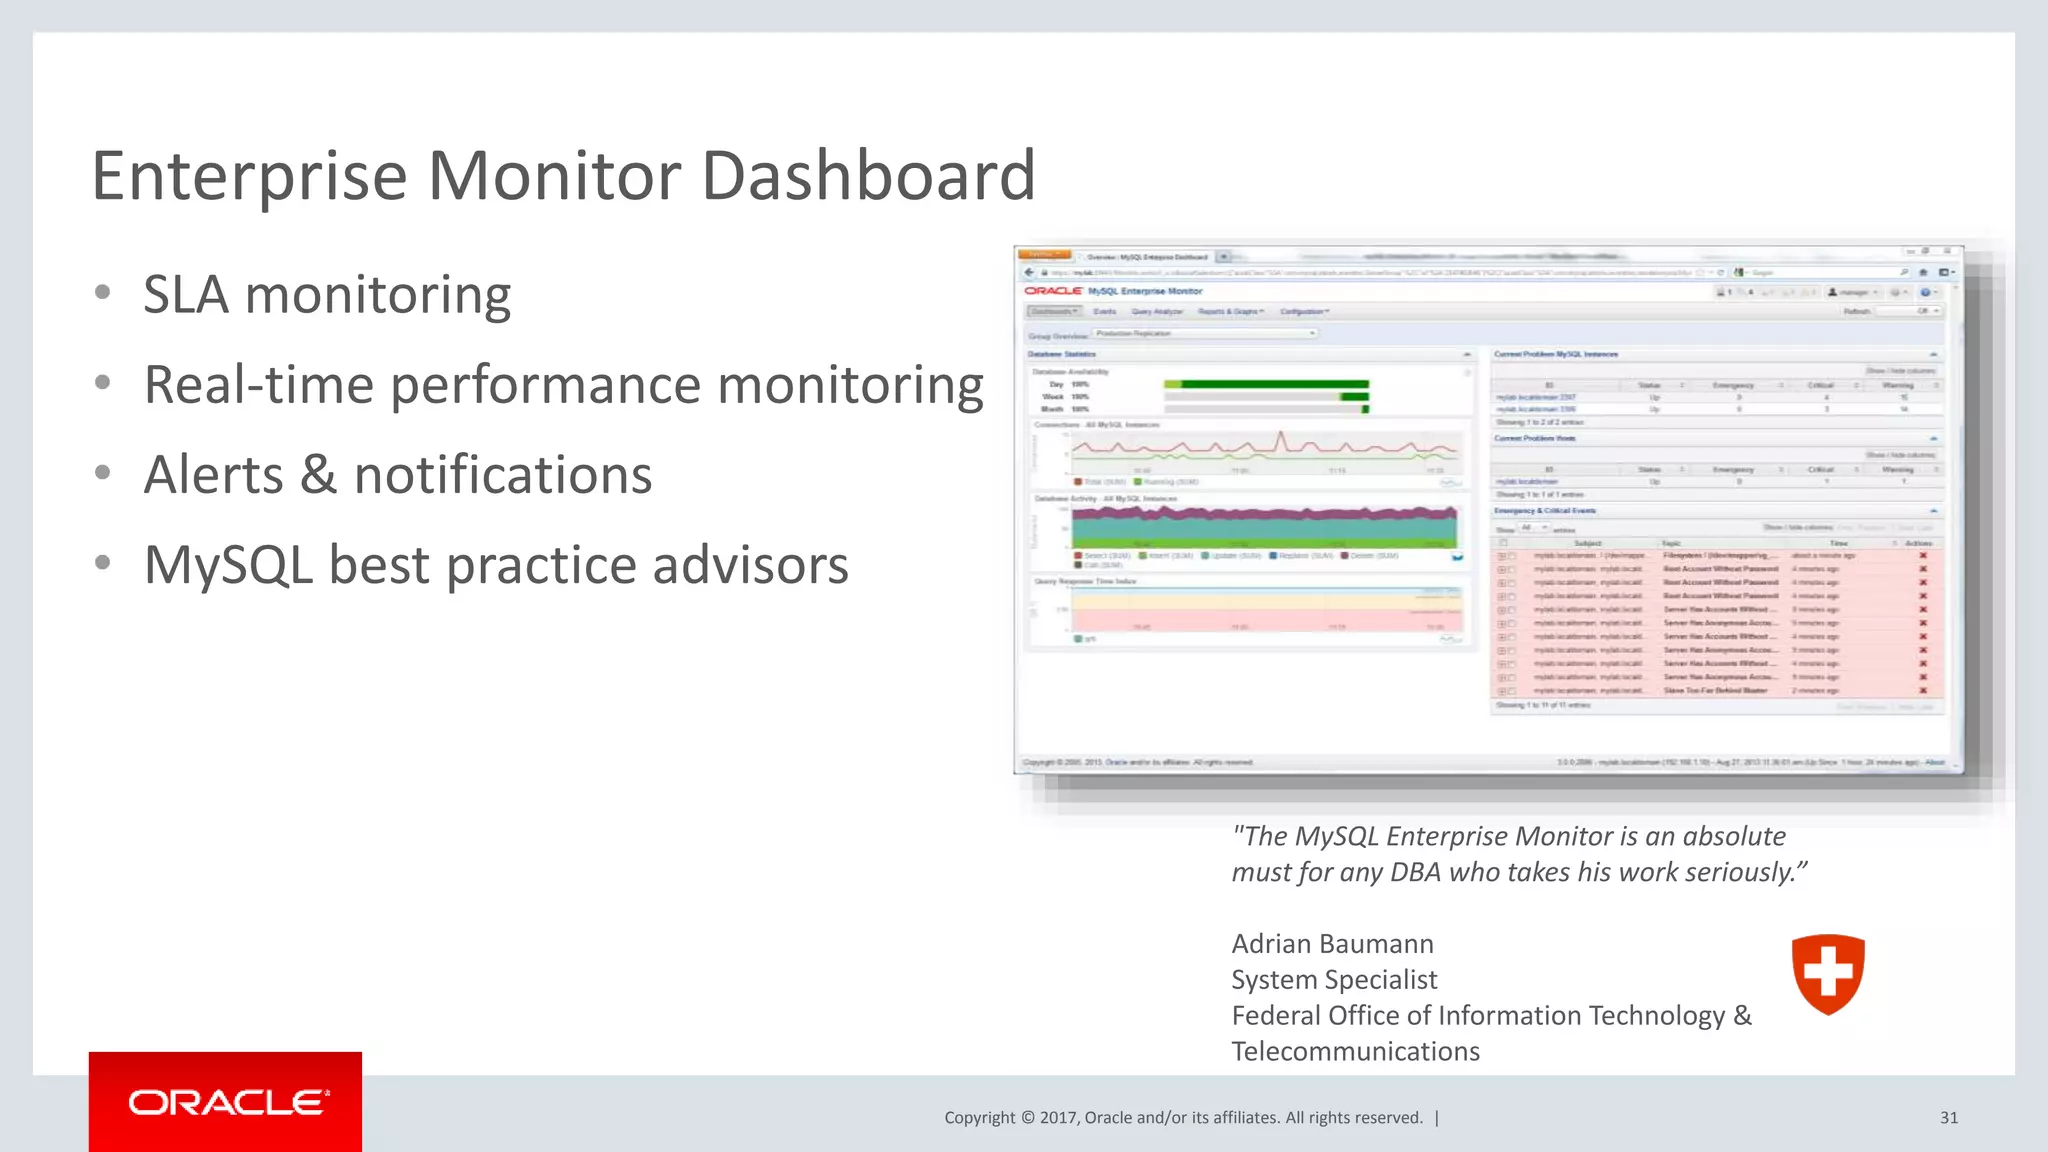
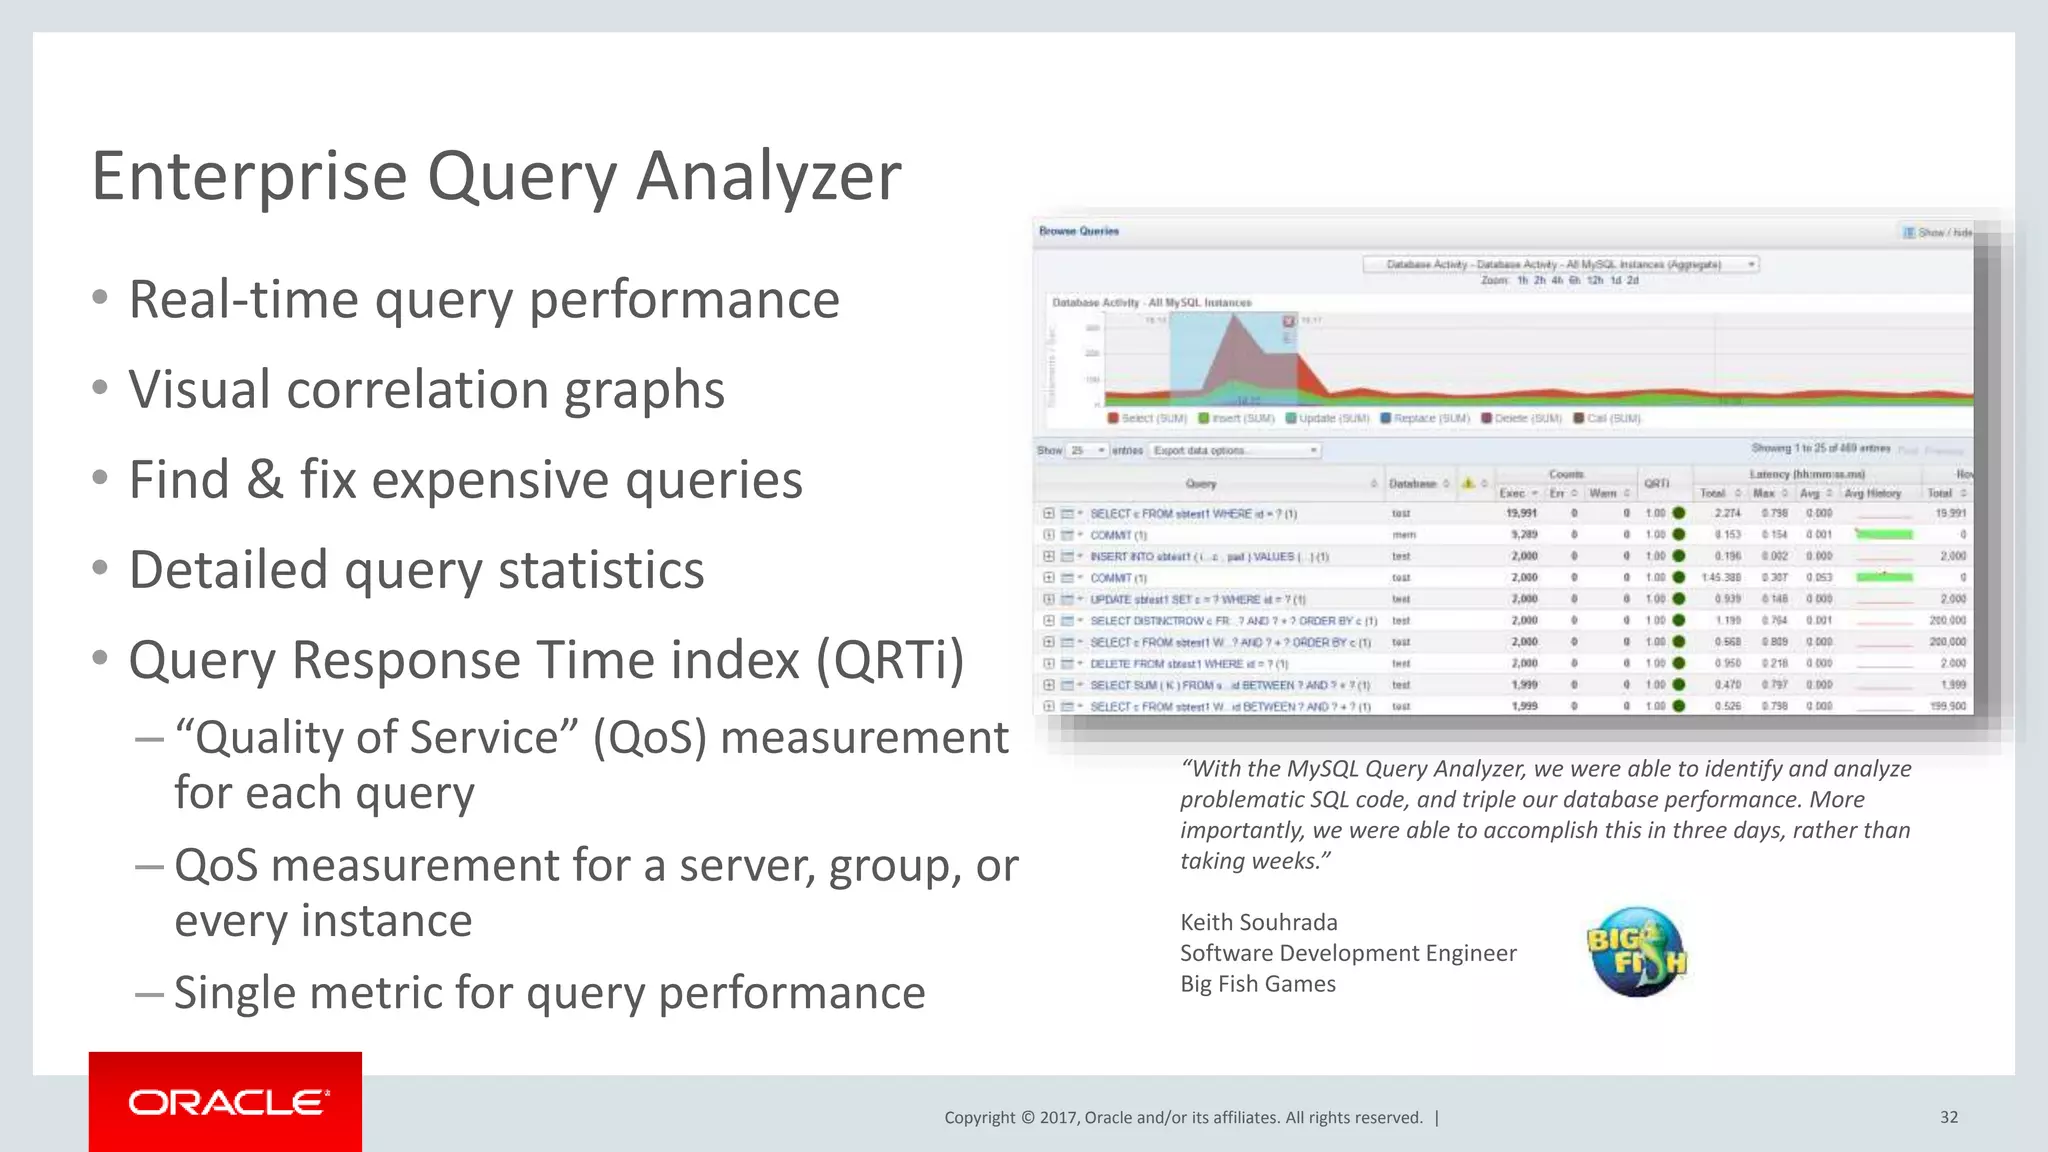
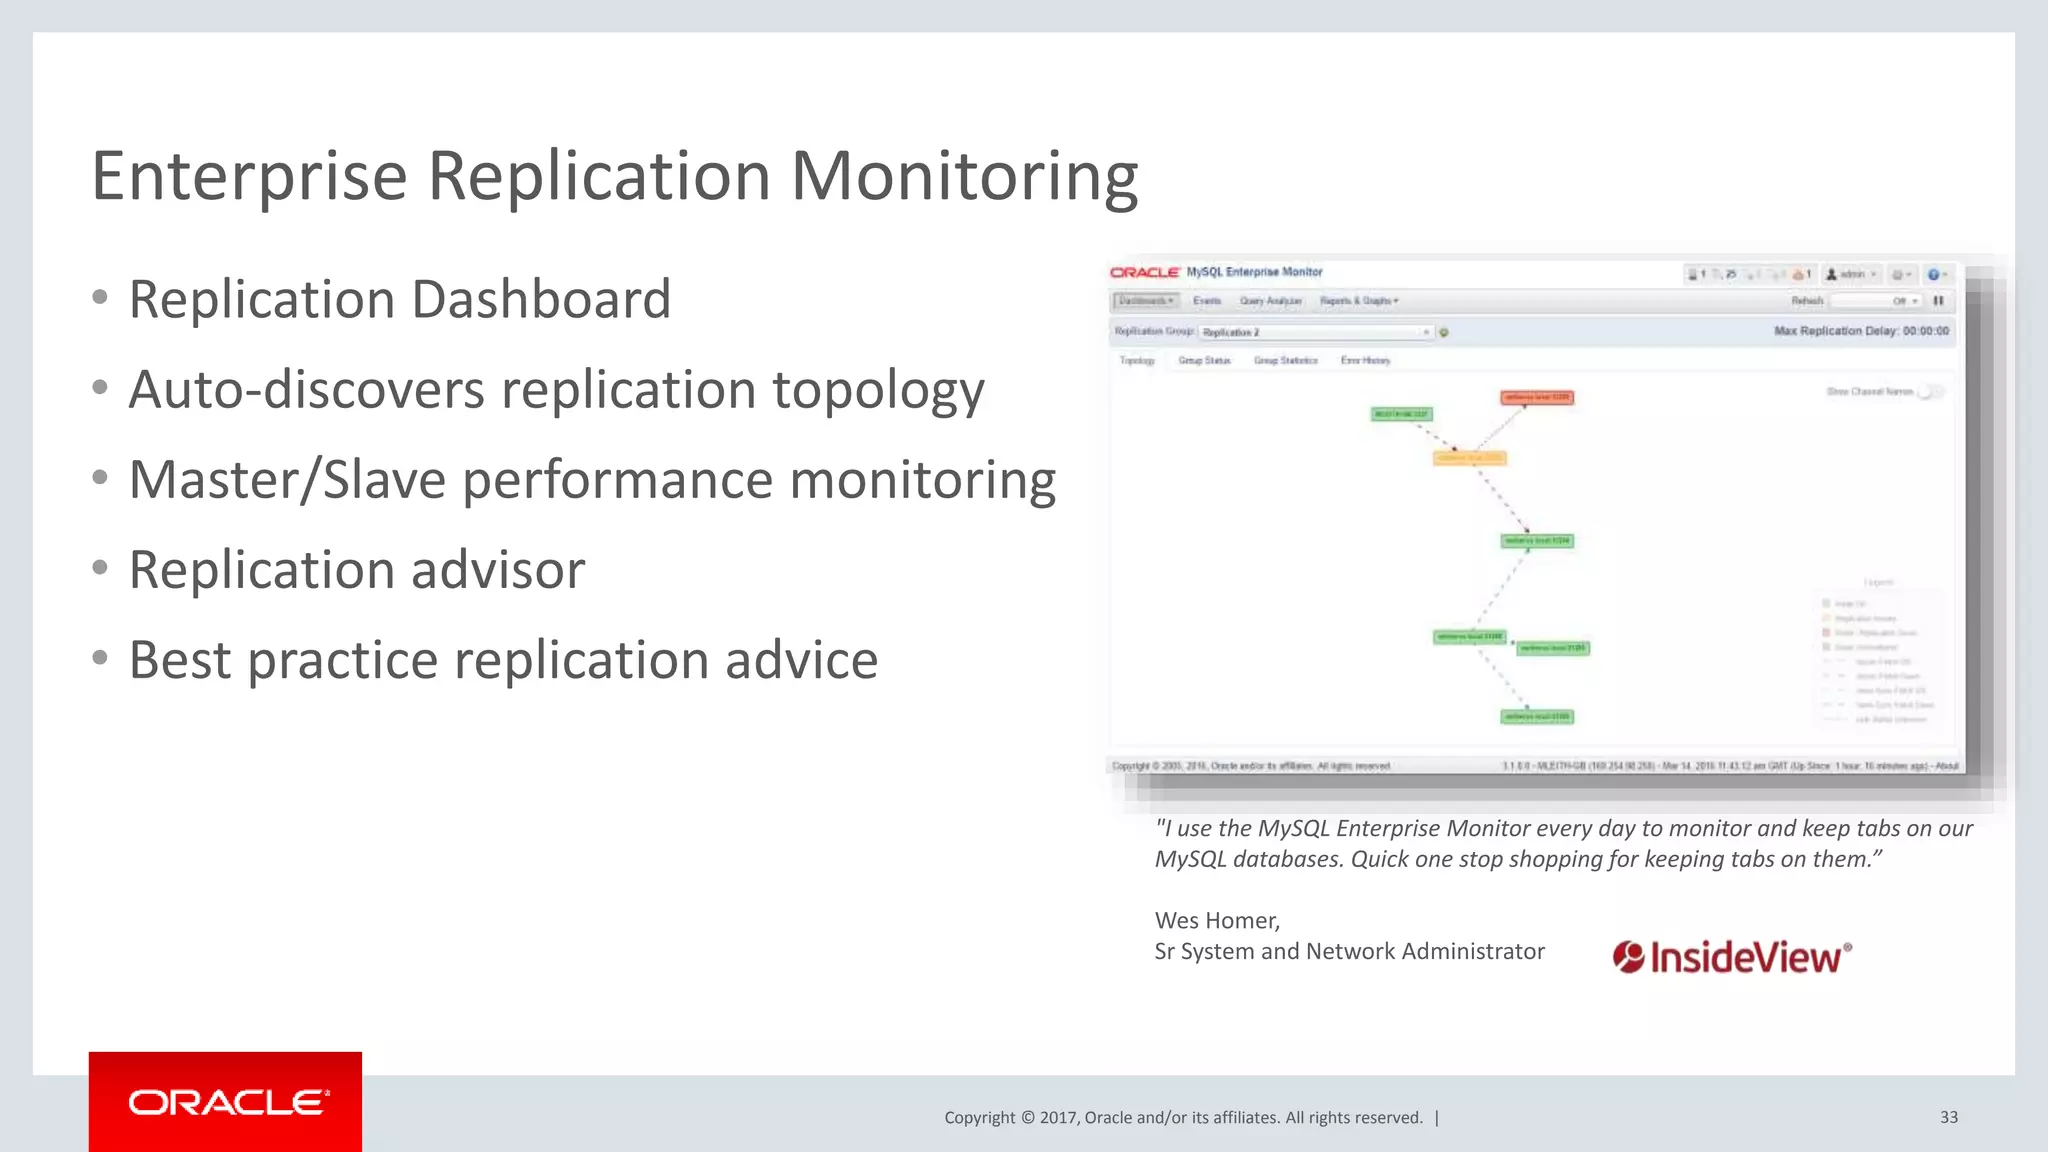

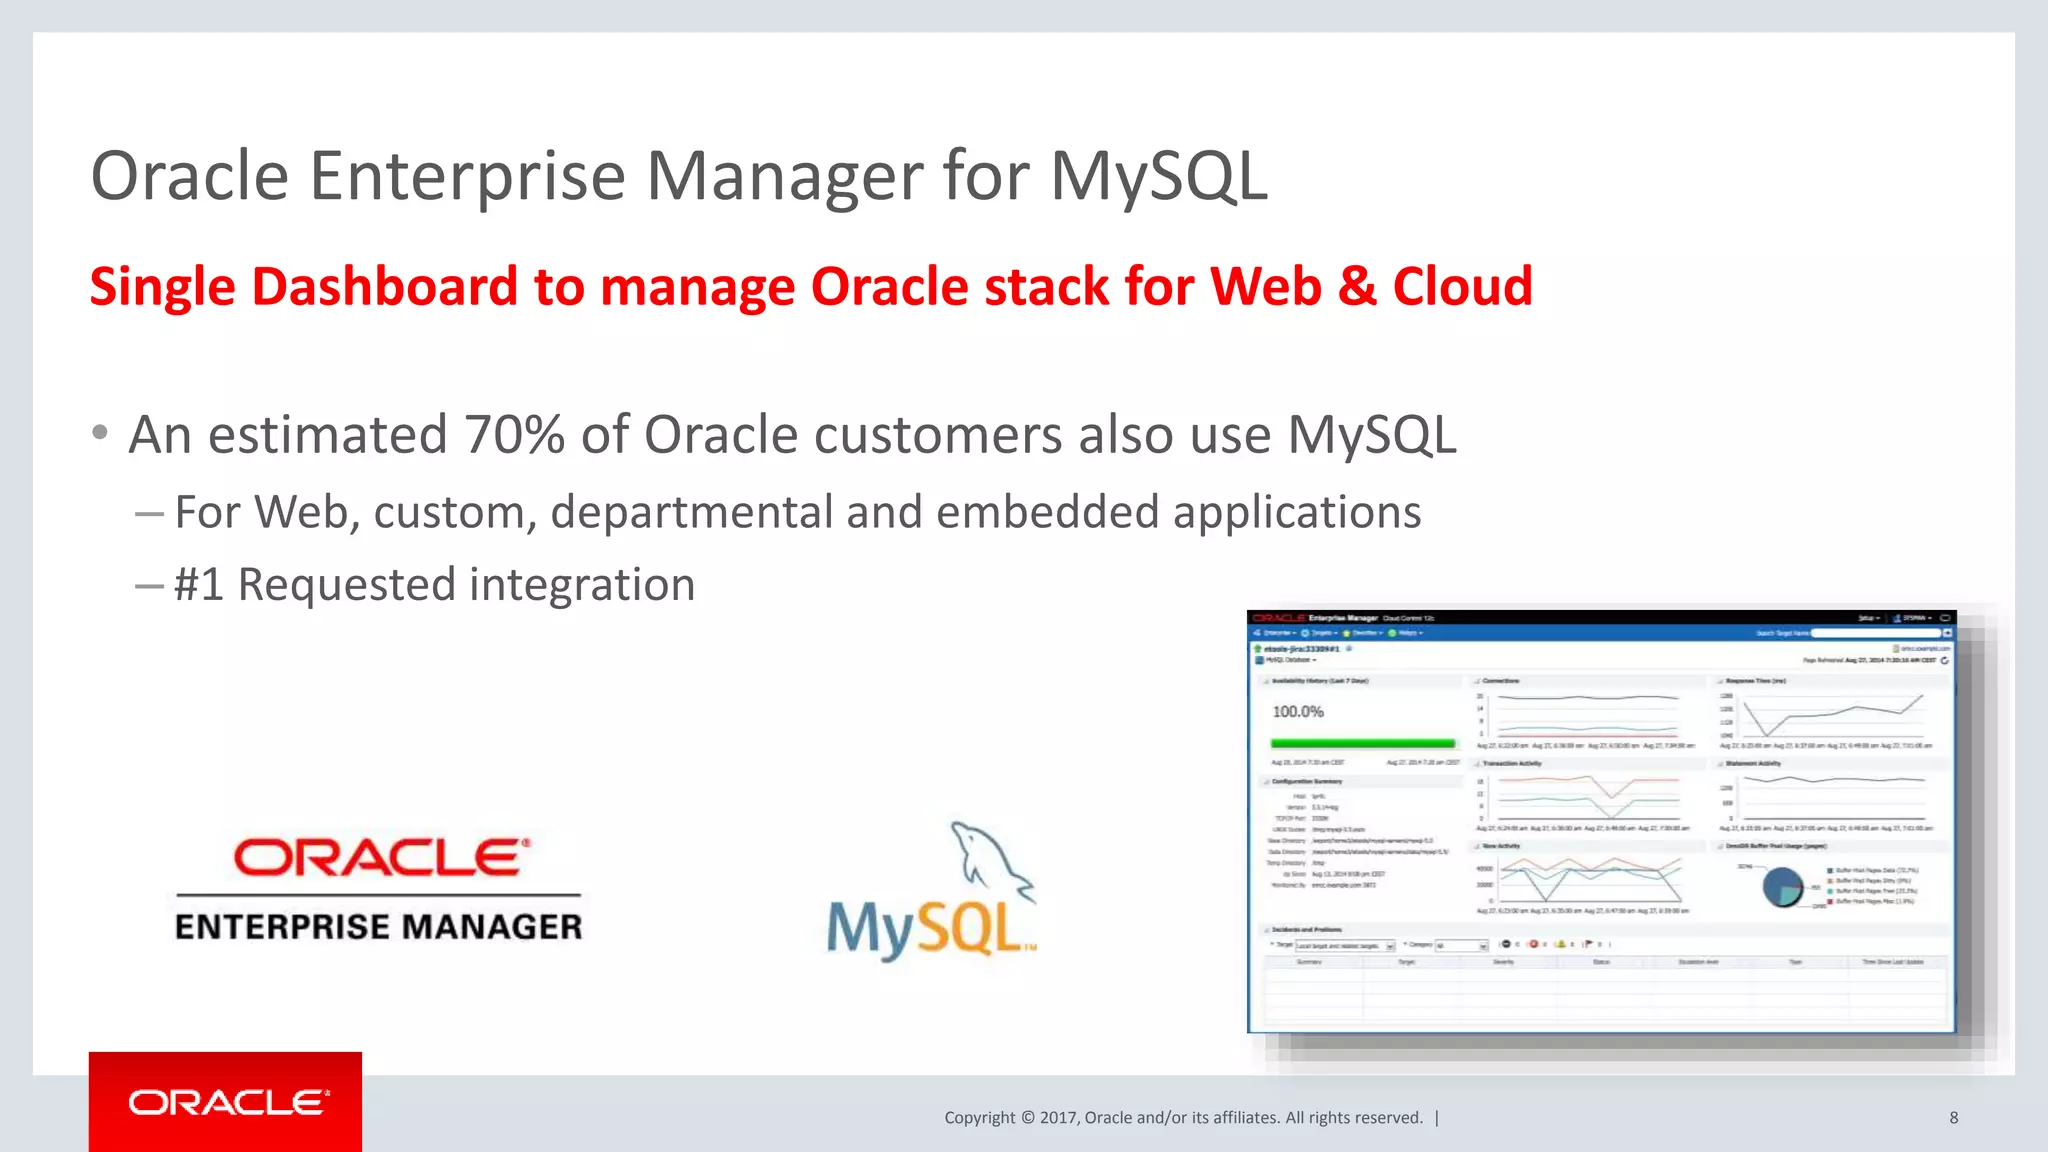
This document discusses how Oracle Enterprise Manager can be used to manage MySQL databases. It provides an overview of how MySQL Enterprise Monitor and Oracle Enterprise Manager integrate to provide monitoring of MySQL performance metrics, configuration monitoring, replication monitoring, query analysis, security management, and other capabilities from a single dashboard. It also discusses how to install and set up both MySQL Enterprise Monitor and the Oracle Enterprise Manager MySQL plugin.