Performance Monitoring with Java Flight Recorder on OpenJDK [DEV2406] Sep 19, 2019 Hirofumi Iwasaki Hiroaki Nakada Rakuten Card Co., Ltd.
2 Agenda Part 1 • Our Company & Our Challenges with Java • JDK Flight Recorder(JEP 328) Part 2 • JDK Flight Recorder (JFR) for Business Process Monitoring • Our concerns • Custom Event/Benchmark • Pipeline and Visualization • Conclusion
3 Part 1
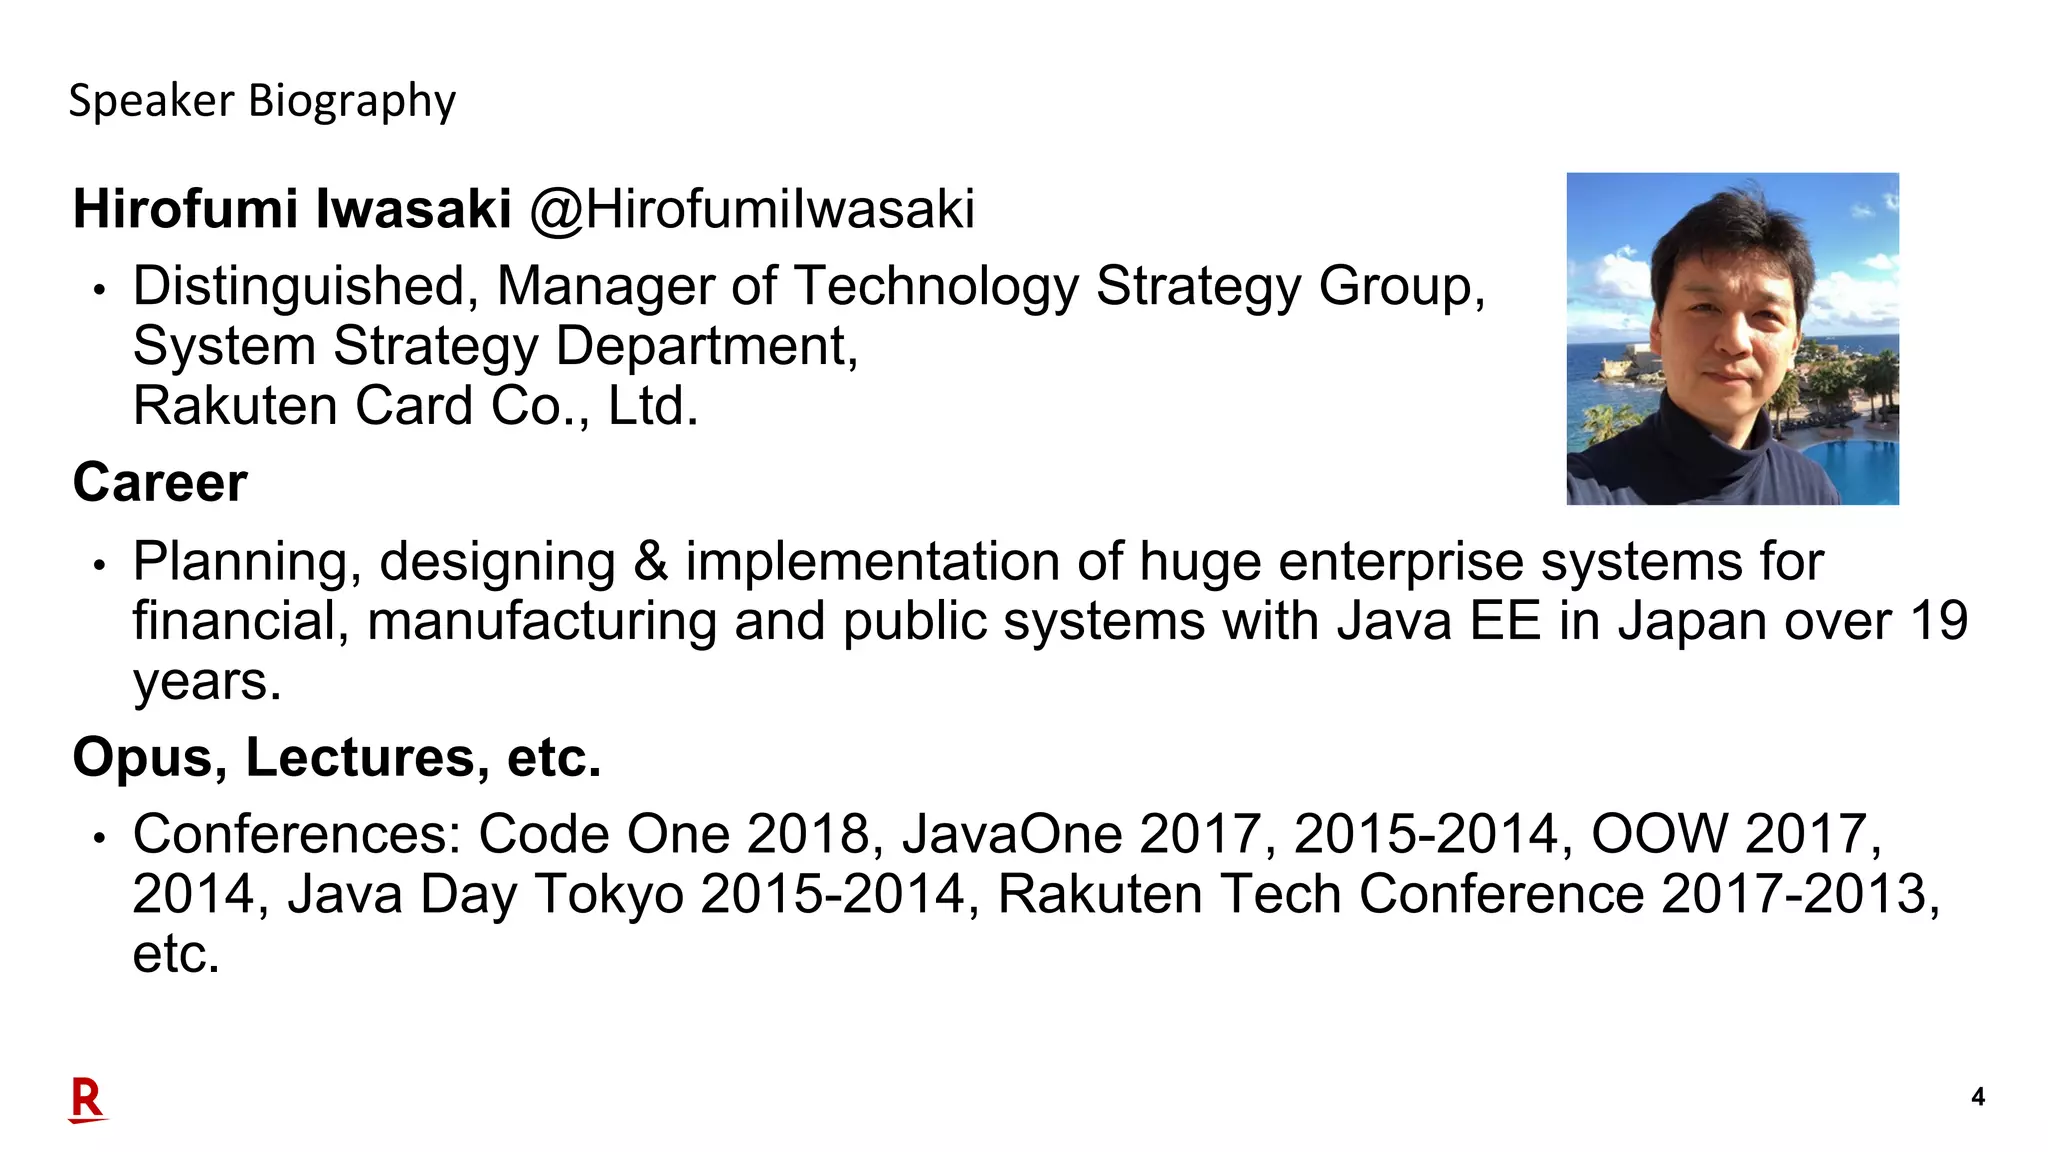
4 Speaker Biography Hirofumi Iwasaki @HirofumiIwasaki • Distinguished, Manager of Technology Strategy Group, System Strategy Department, Rakuten Card Co., Ltd. Career • Planning, designing & implementation of huge enterprise systems for financial, manufacturing and public systems with Java EE in Japan over 19 years. Opus, Lectures, etc. • Conferences: Code One 2018, JavaOne 2017, 2015-2014, OOW 2017, 2014, Java Day Tokyo 2015-2014, Rakuten Tech Conference 2017-2013, etc.
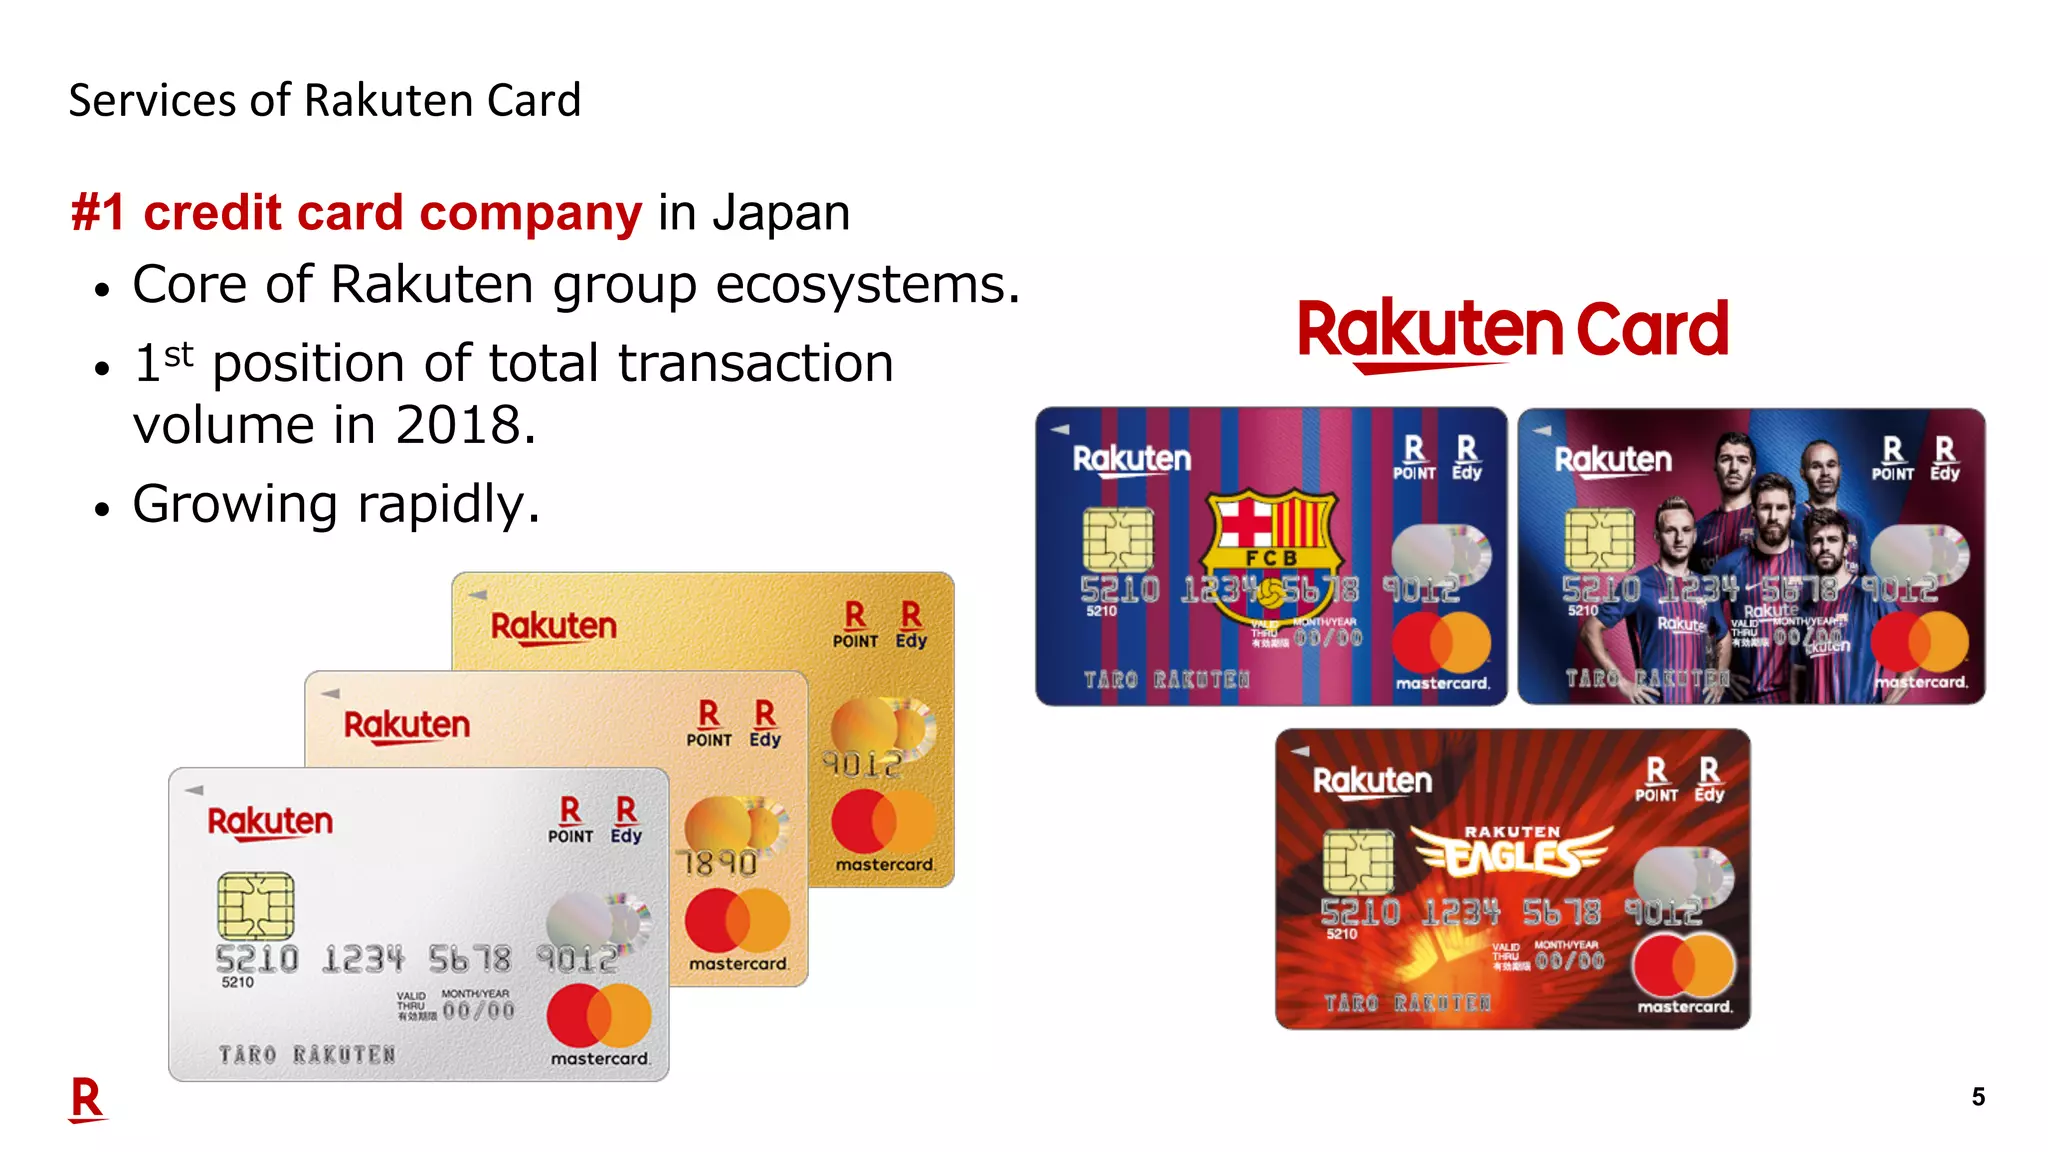
5 Services of Rakuten Card #1 credit card company in Japan • Core of Rakuten group ecosystems. • 1st position of total transaction volume in 2018. • Growing rapidly.
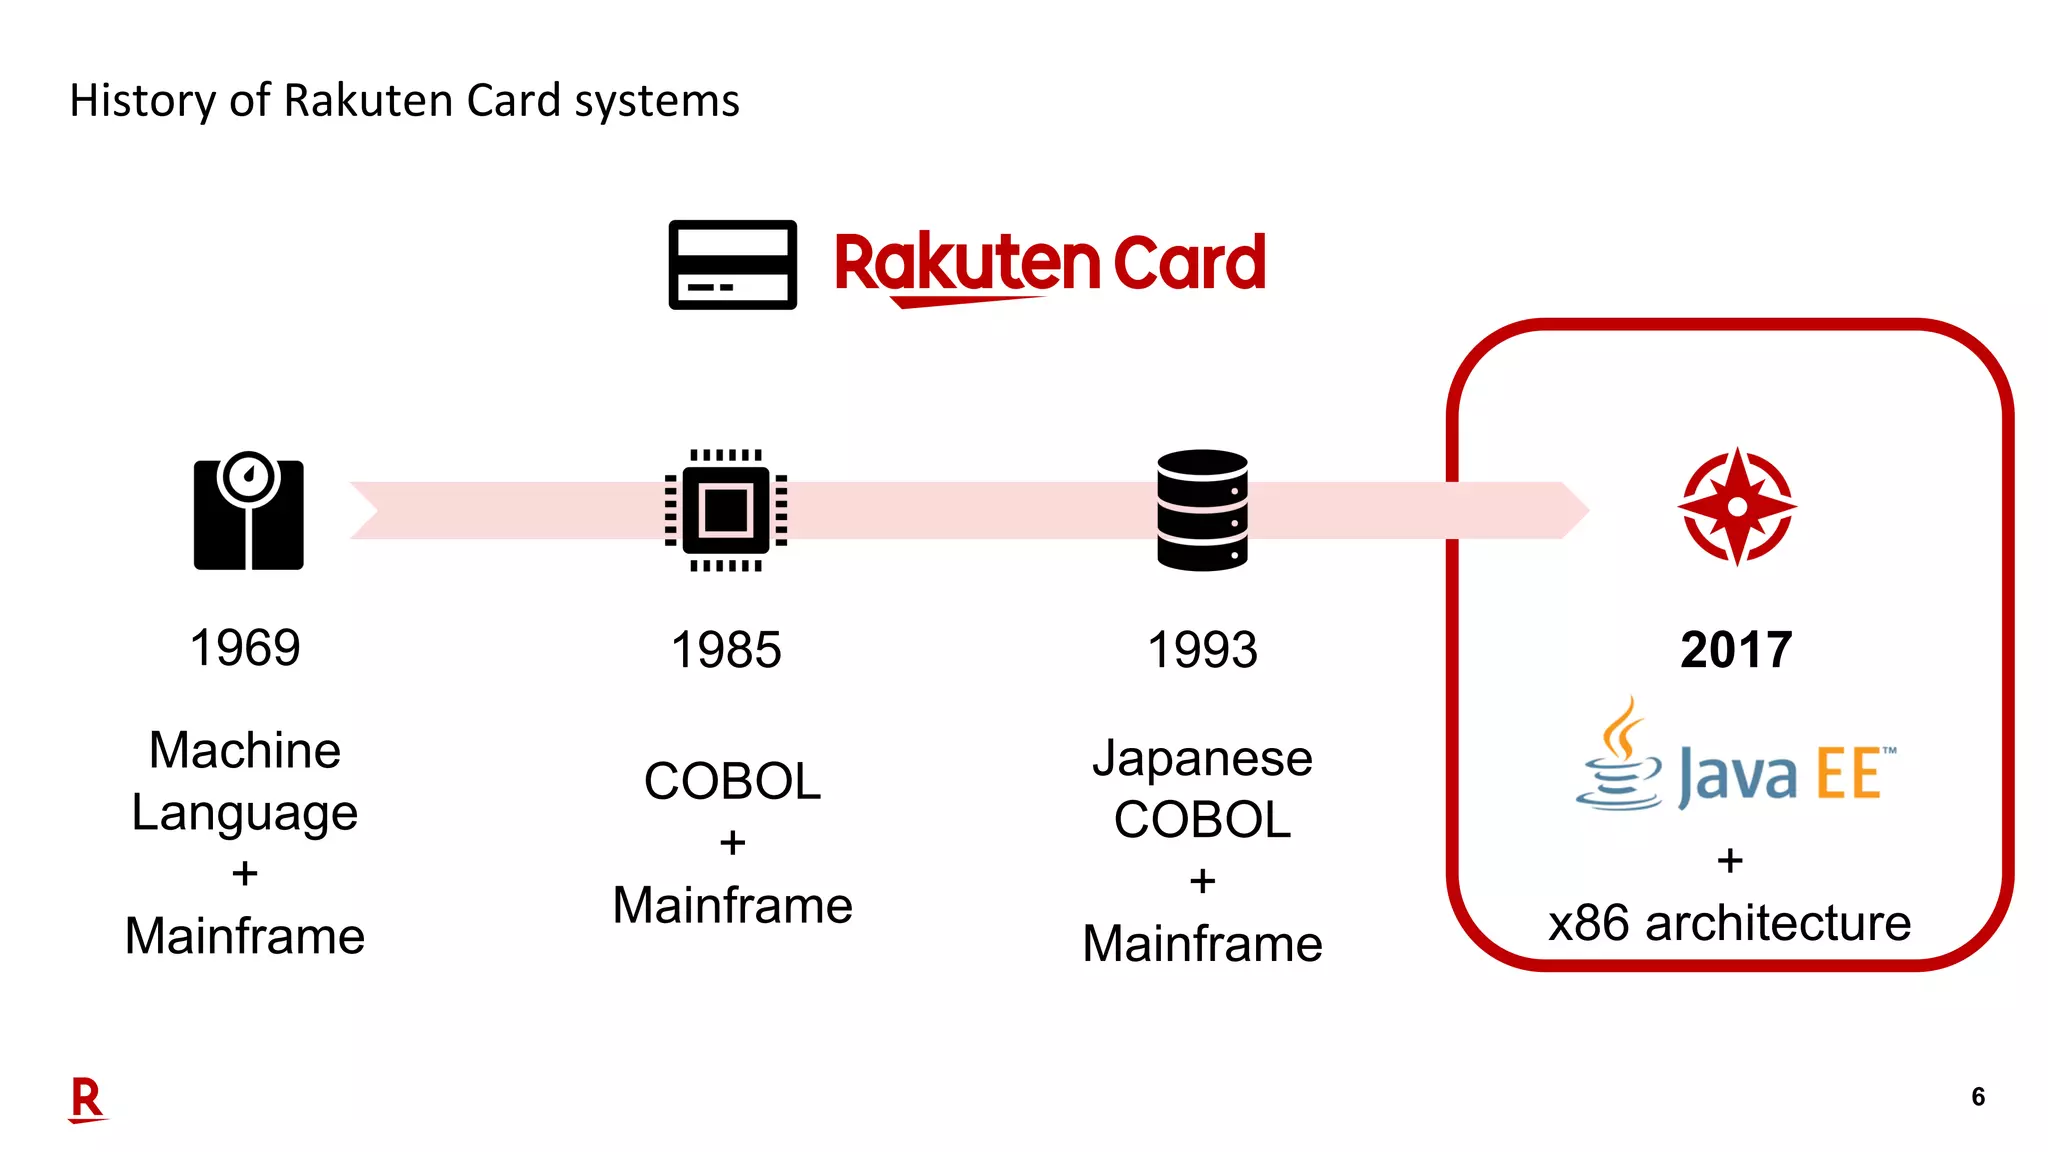
6 History of Rakuten Card systems 1993 20171969 1985 COBOL + Mainframe Japanese COBOL + Mainframe Machine Language + Mainframe + x86 architecture
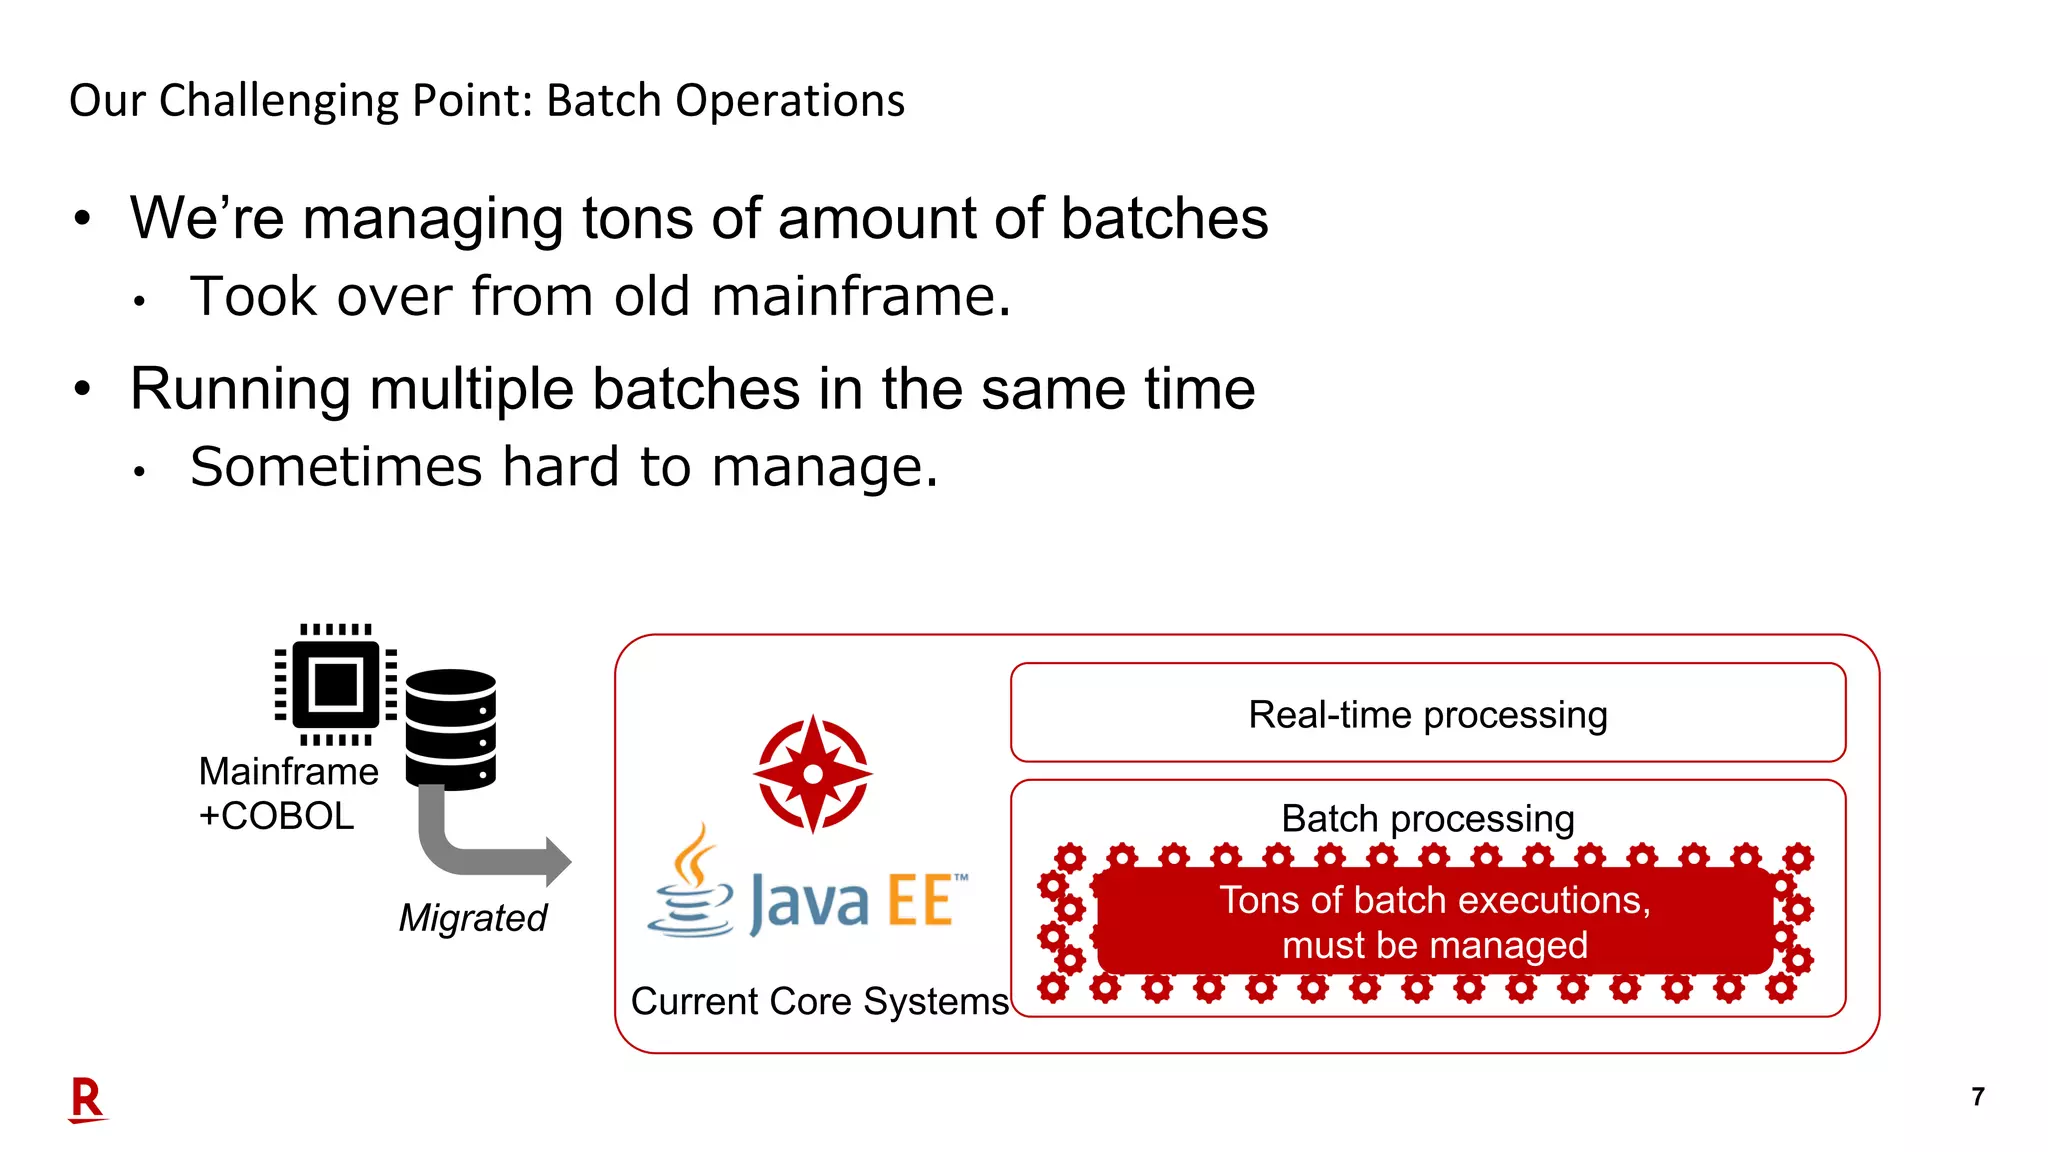
7 • We’re managing tons of amount of batches • Took over from old mainframe. • Running multiple batches in the same time • Sometimes hard to manage. Our Challenging Point: Batch Operations Migrated Mainframe +COBOL Current Core Systems Real-time processing Batch processing Tons of batch executions, must be managed
8 Solution: JDK Flight Recorder (JFR) • We introduced JDK Flight Recorder for each process monitoring. • Also needed • Real-time process monitoring • Data aggregation for reporting
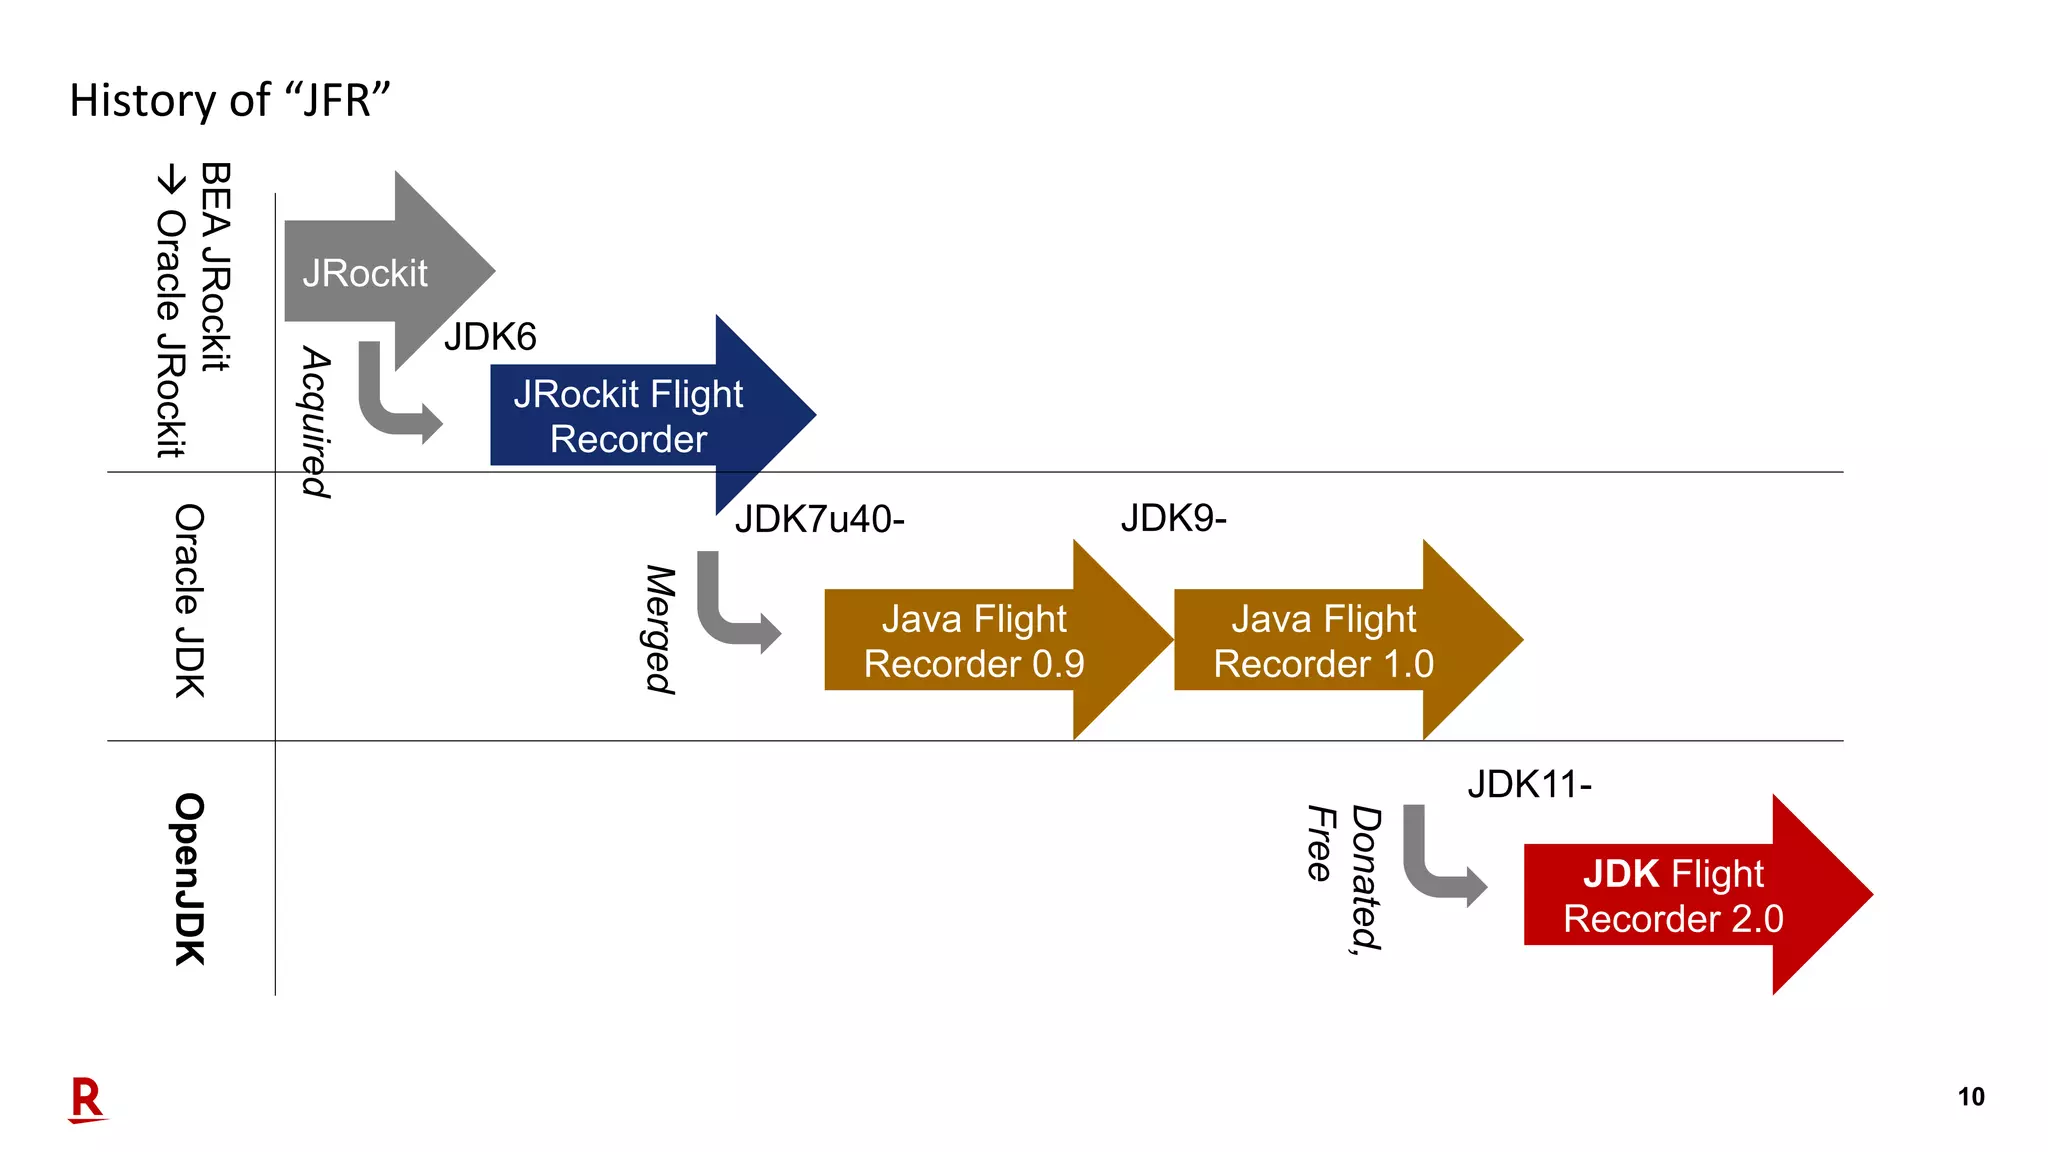
9 About JDK Flight Recorder (JFR) • Now opened, donated from Oracle to community (JEP 328) • Name changed: • JRockit Flight Recorder • à Java Flight Recorder • à JDK Flight Recorder (still “JFR”) • JFR is great for: • Failure management when something down • Production usage due to its low loading • New API provided since JDK 9, great for with JDK 11 (LTS) • Free usage
10 History of “JFR” JDK7u40- Java Flight Recorder 0.9 Java Flight Recorder 1.0 JDK Flight Recorder 2.0 JRockit Flight Recorder JDK9- JDK11- BEAJRockit àOracleJRockitOracleJDKOpenJDK Donated, Free AcquiredJRockit JDK6 Merged
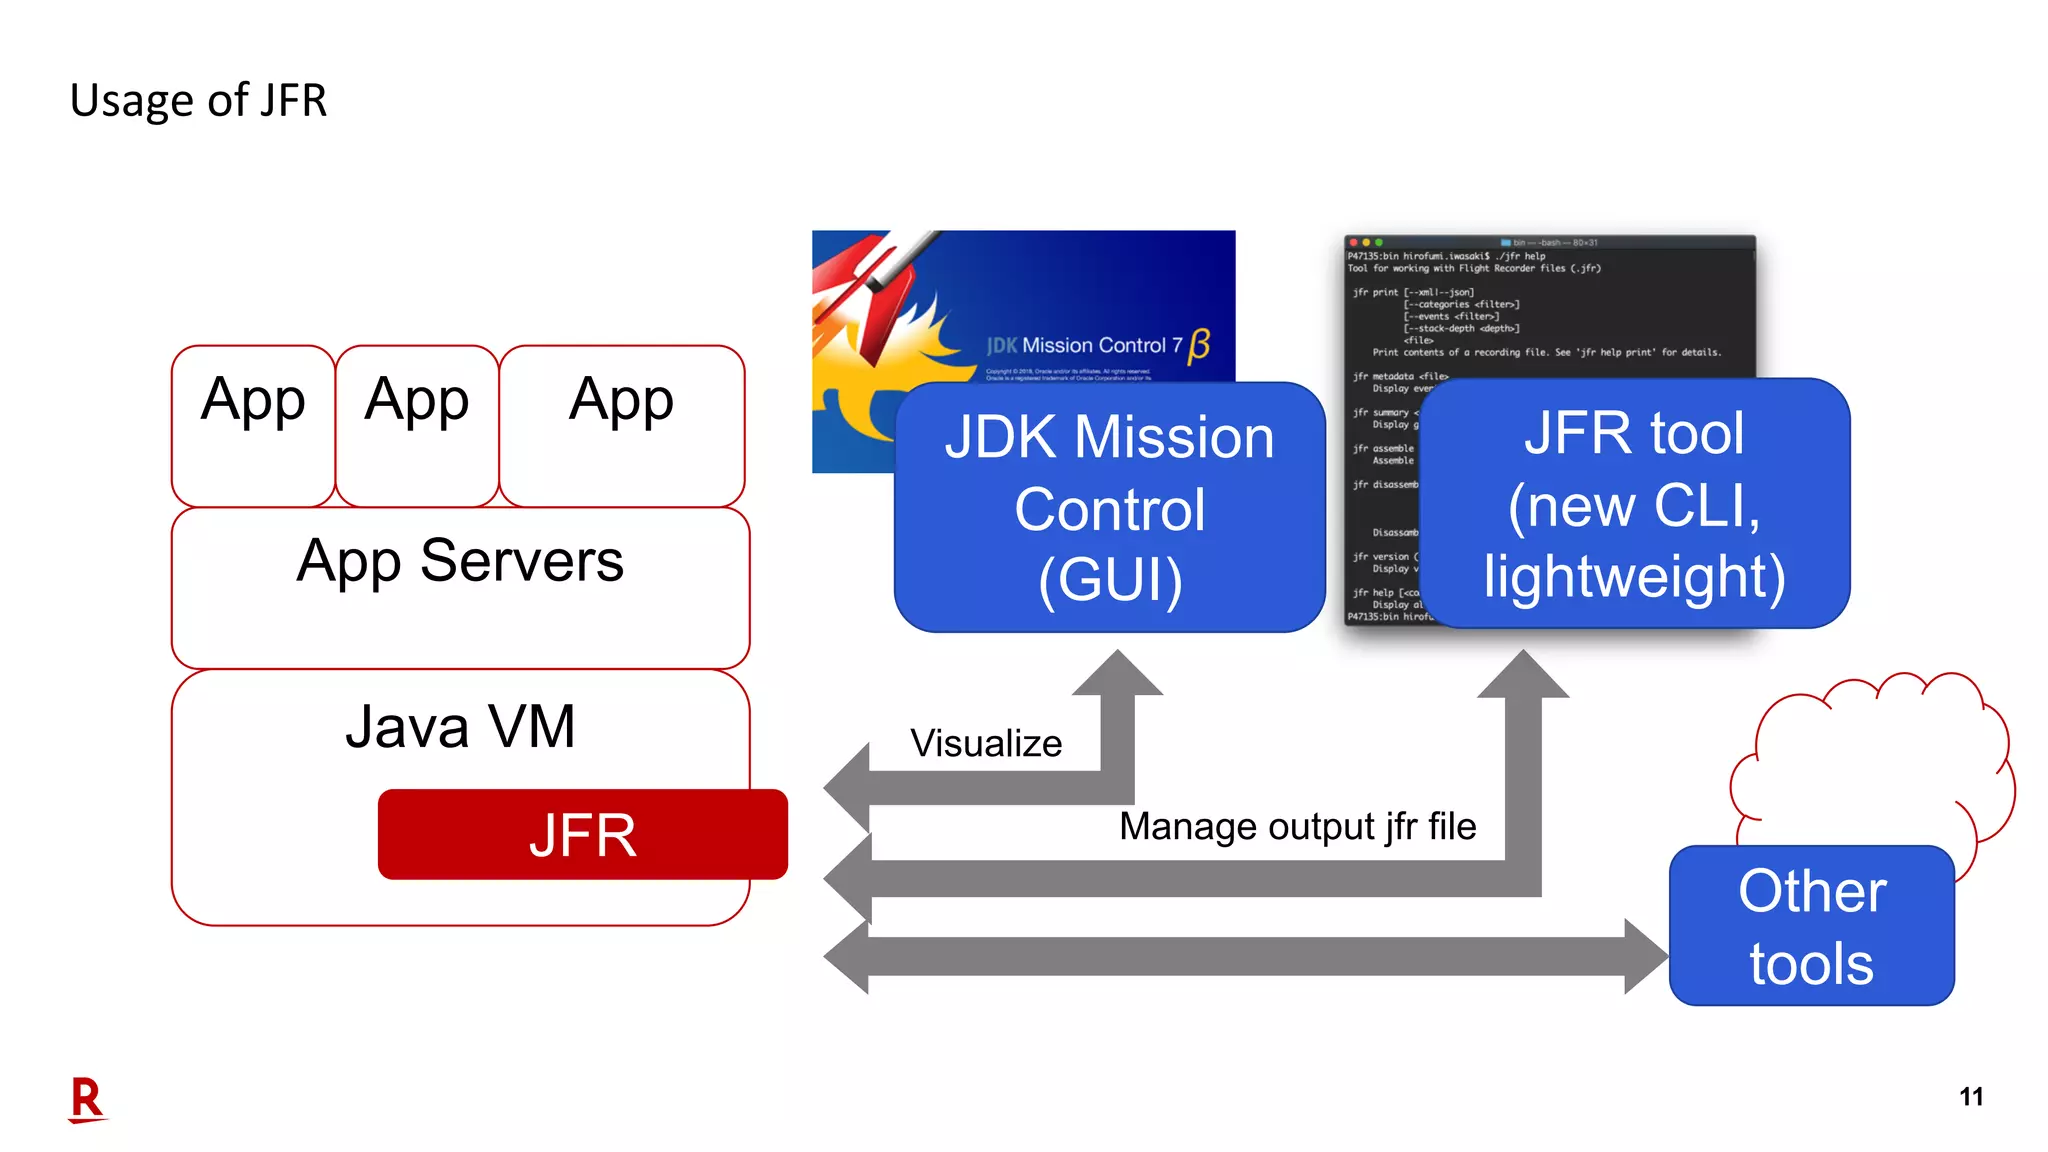
11 Usage of JFR Java VM JFR App Servers App App App JDK Mission Control (GUI) JFR tool (new CLI, lightweight) Manage output jfr file Visualize Other tools
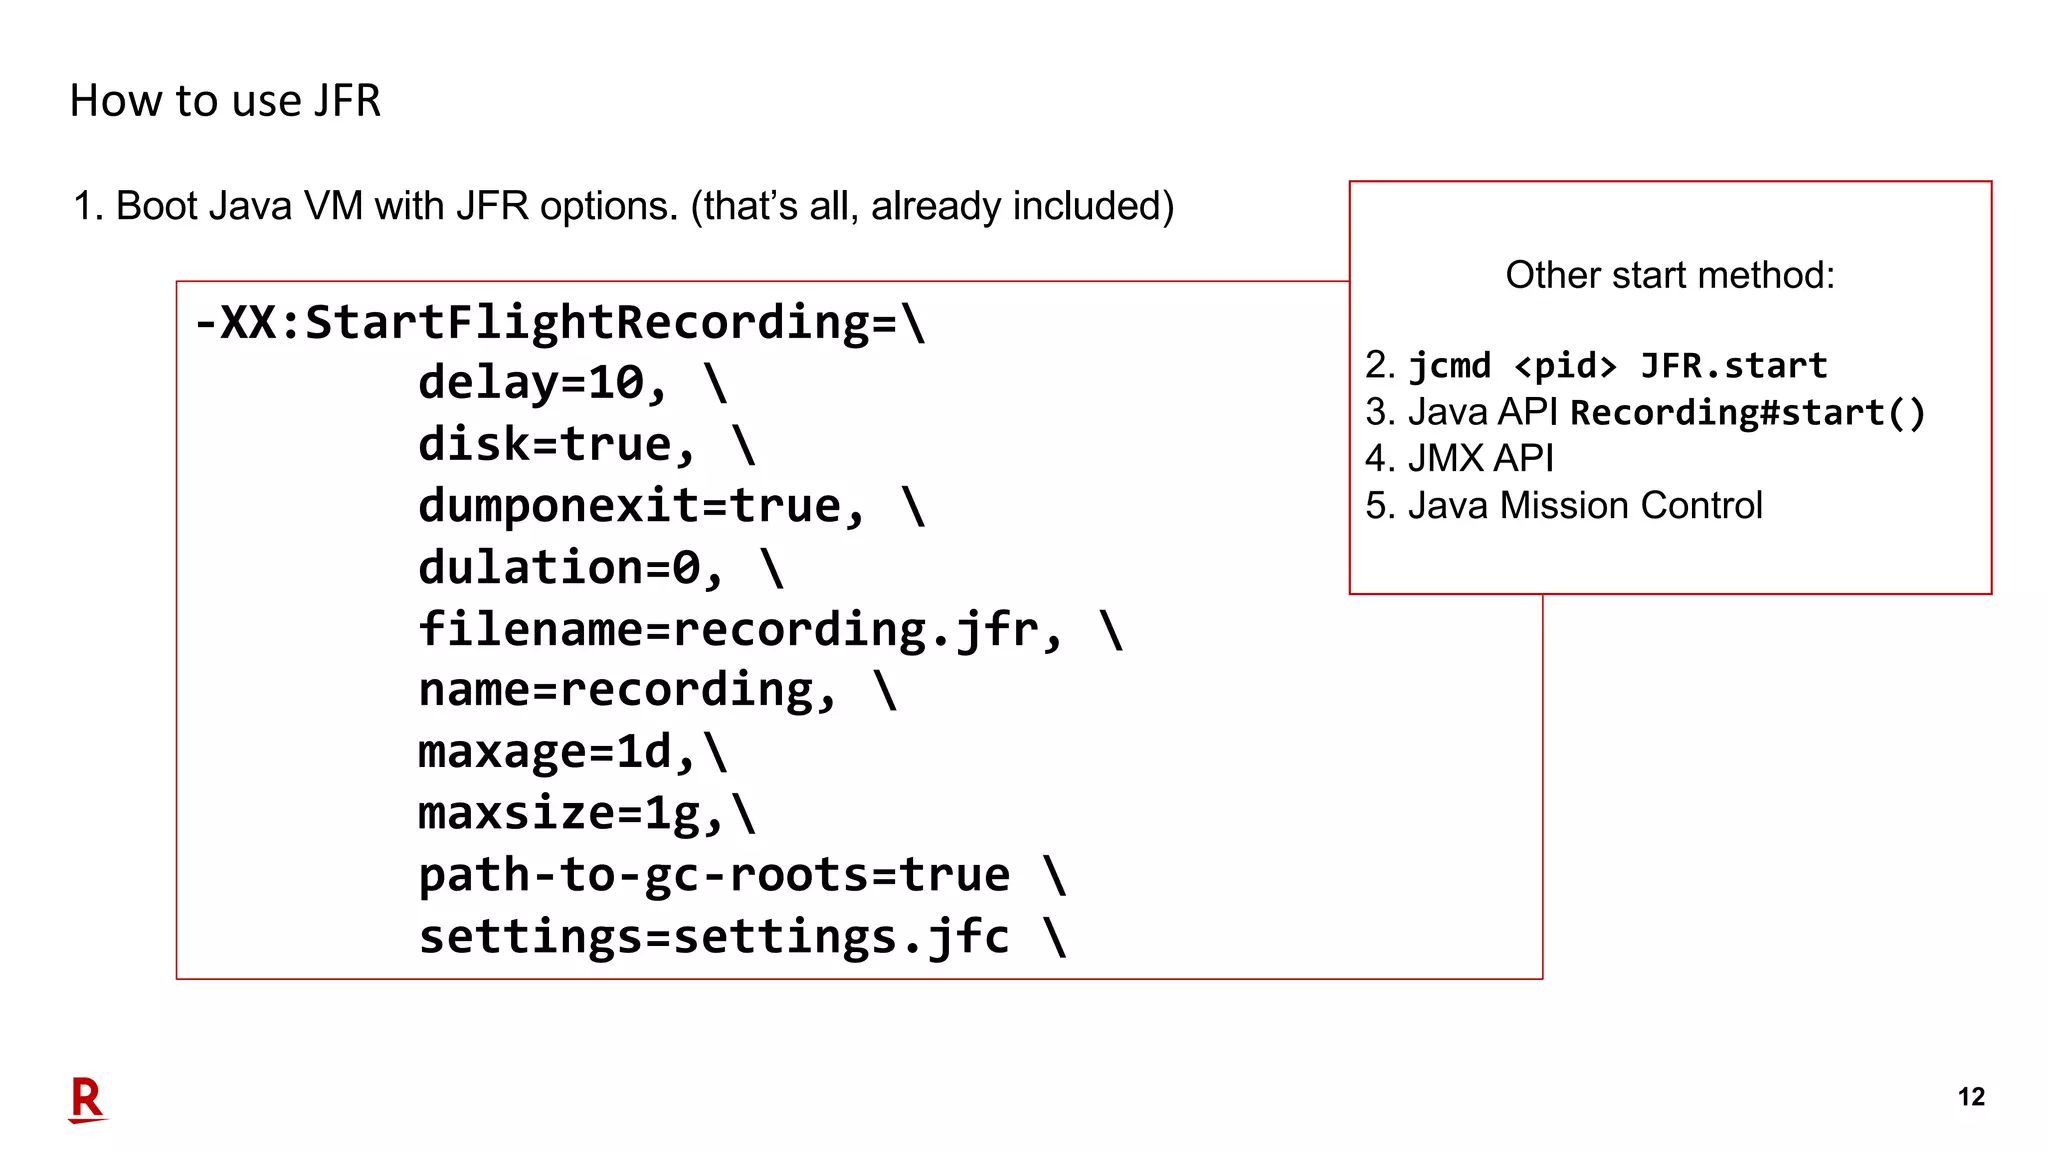
12 How to use JFR 1. Boot Java VM with JFR options. (that’s all, already included) -XX:StartFlightRecording= delay=10, disk=true, dumponexit=true, dulation=0, filename=recording.jfr, name=recording, maxage=1d, maxsize=1g, path-to-gc-roots=true settings=settings.jfc Other start method: 2. jcmd <pid> JFR.start 3. Java API Recording#start() 4. JMX API 5. Java Mission Control
13 Part 2
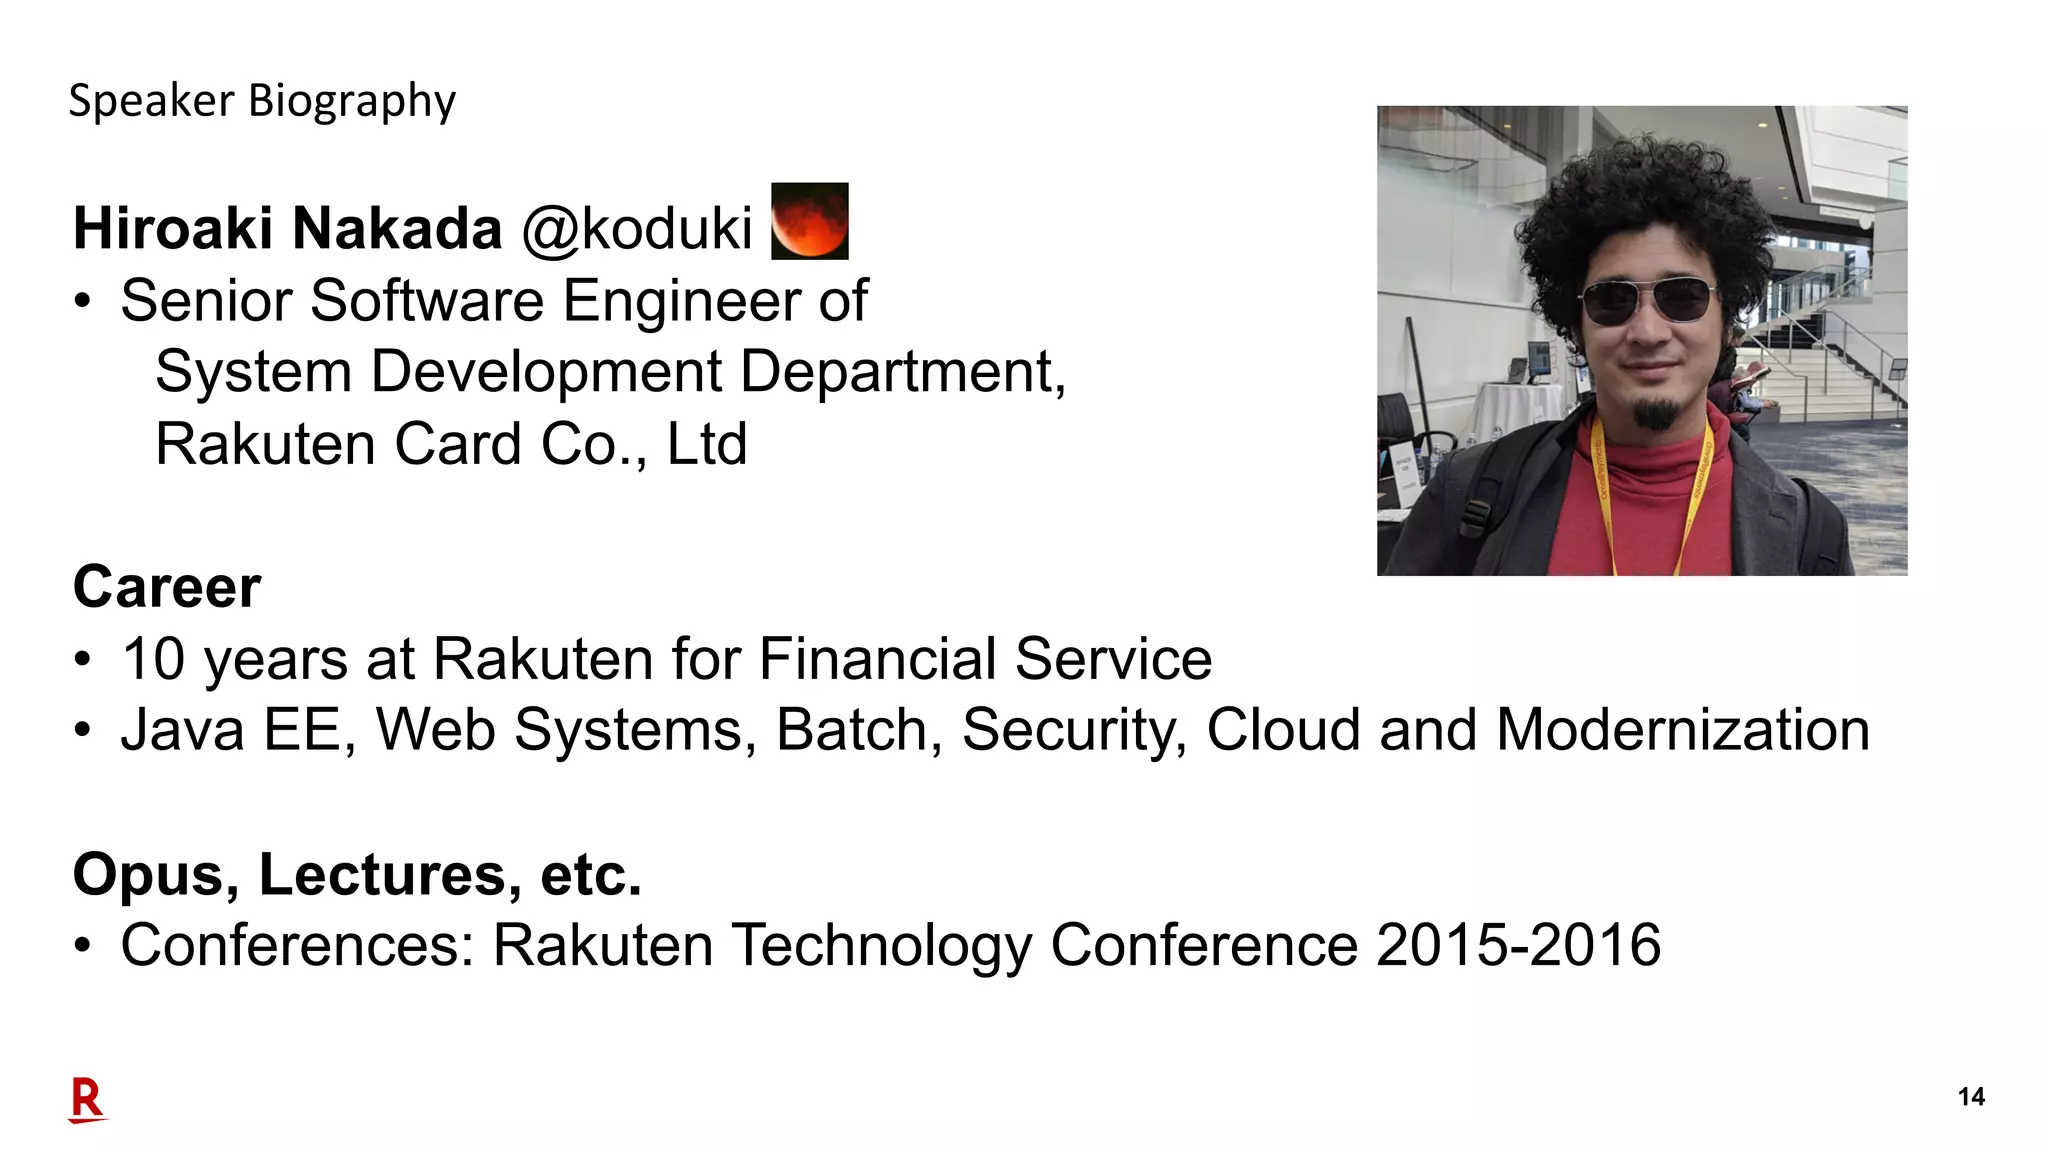
14 Speaker Biography Hiroaki Nakada @koduki • Senior Software Engineer of System Development Department, Rakuten Card Co., Ltd Career • 10 years at Rakuten for Financial Service • Java EE, Web Systems, Batch, Security, Cloud and Modernization Opus, Lectures, etc. • Conferences: Rakuten Technology Conference 2015-2016
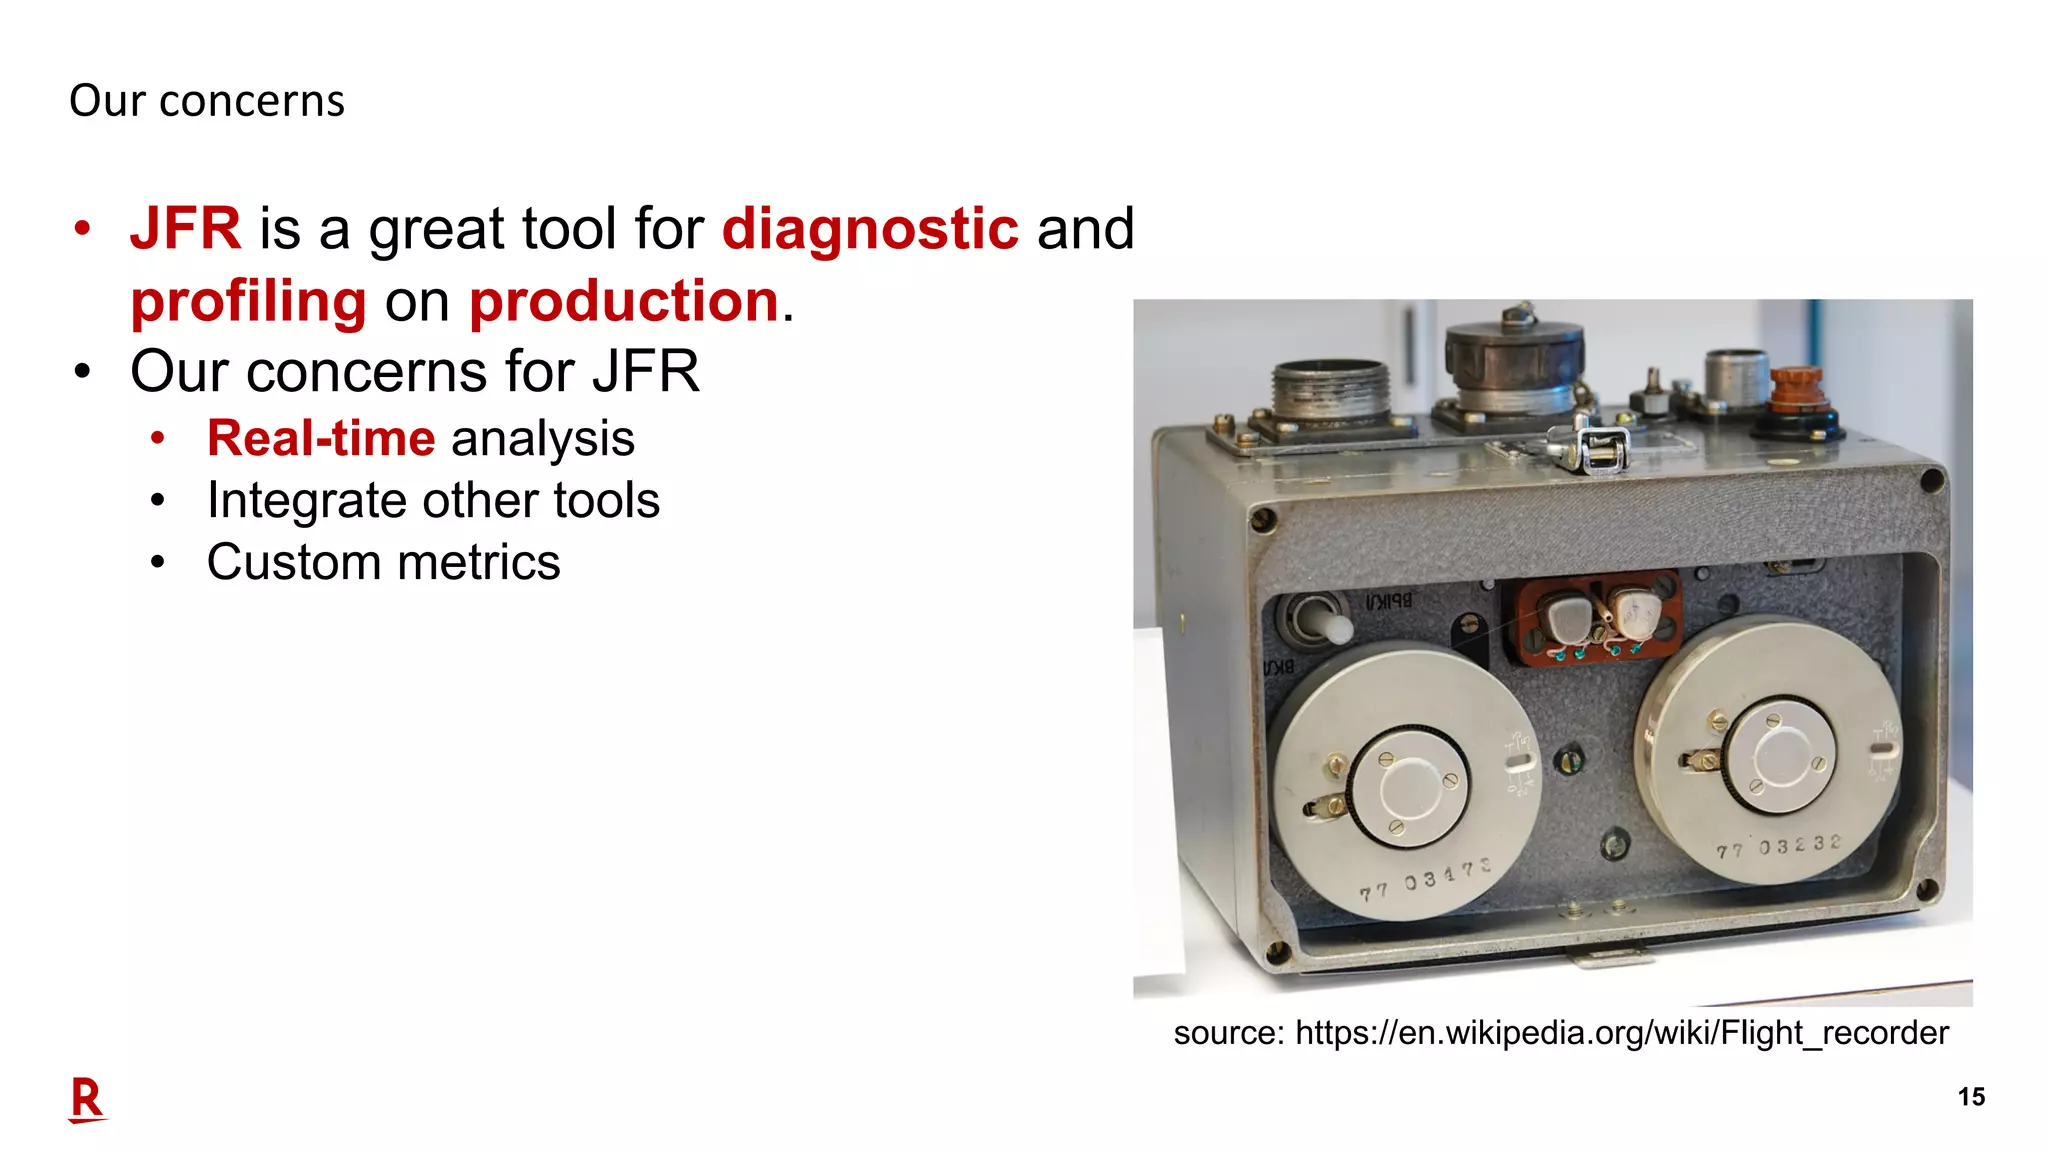
15 Our concerns • JFR is a great tool for diagnostic and profiling on production. • Our concerns for JFR • Real-time analysis • Integrate other tools • Custom metrics source: https://en.wikipedia.org/wiki/Flight_recorder
16 Key features of JFR for our concerns
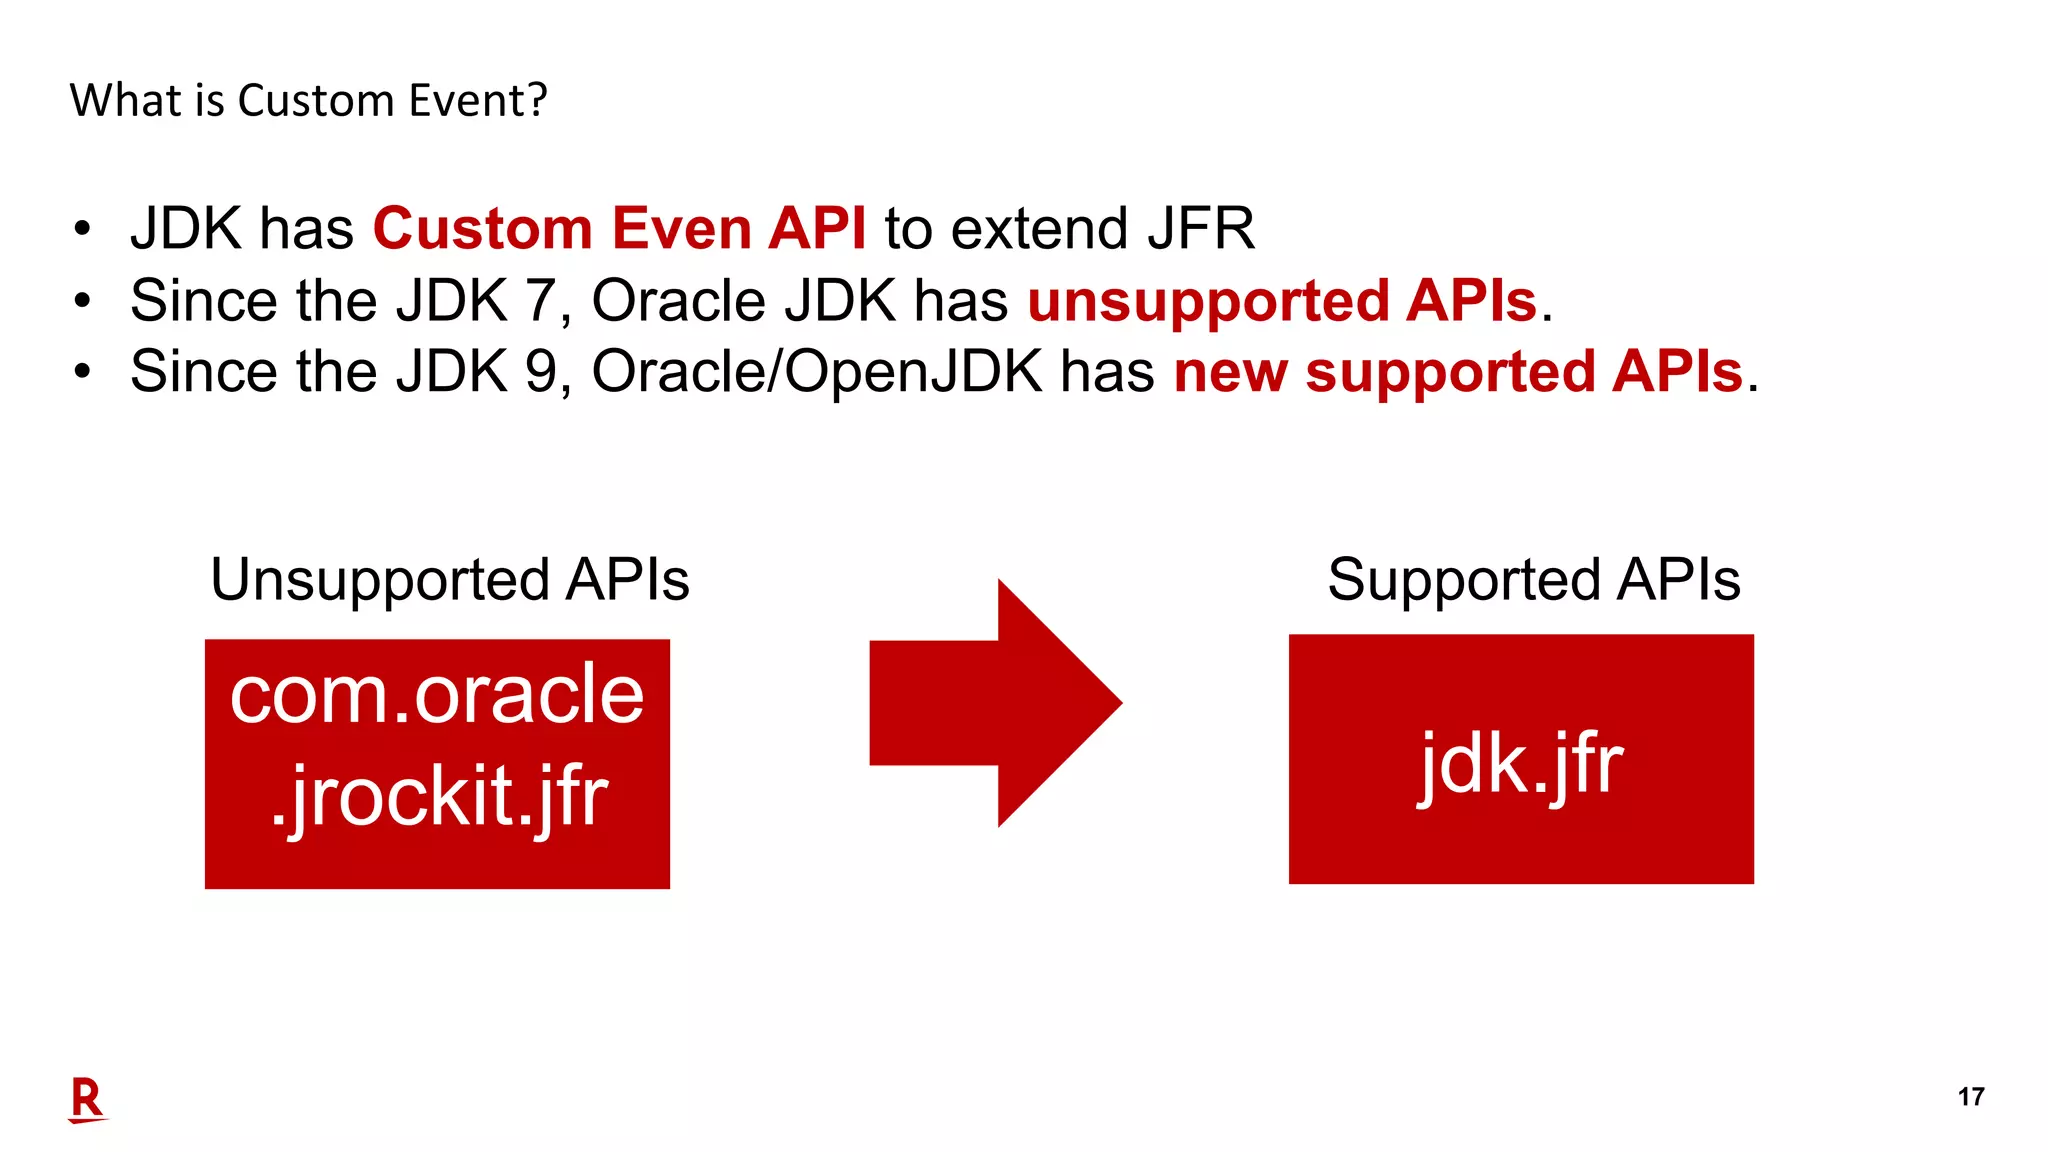
17 What is Custom Event? • JDK has Custom Even API to extend JFR • Since the JDK 7, Oracle JDK has unsupported APIs. • Since the JDK 9, Oracle/OpenJDK has new supported APIs. Unsupported APIs com.oracle .jrockit.jfr jdk.jfr Supported APIs
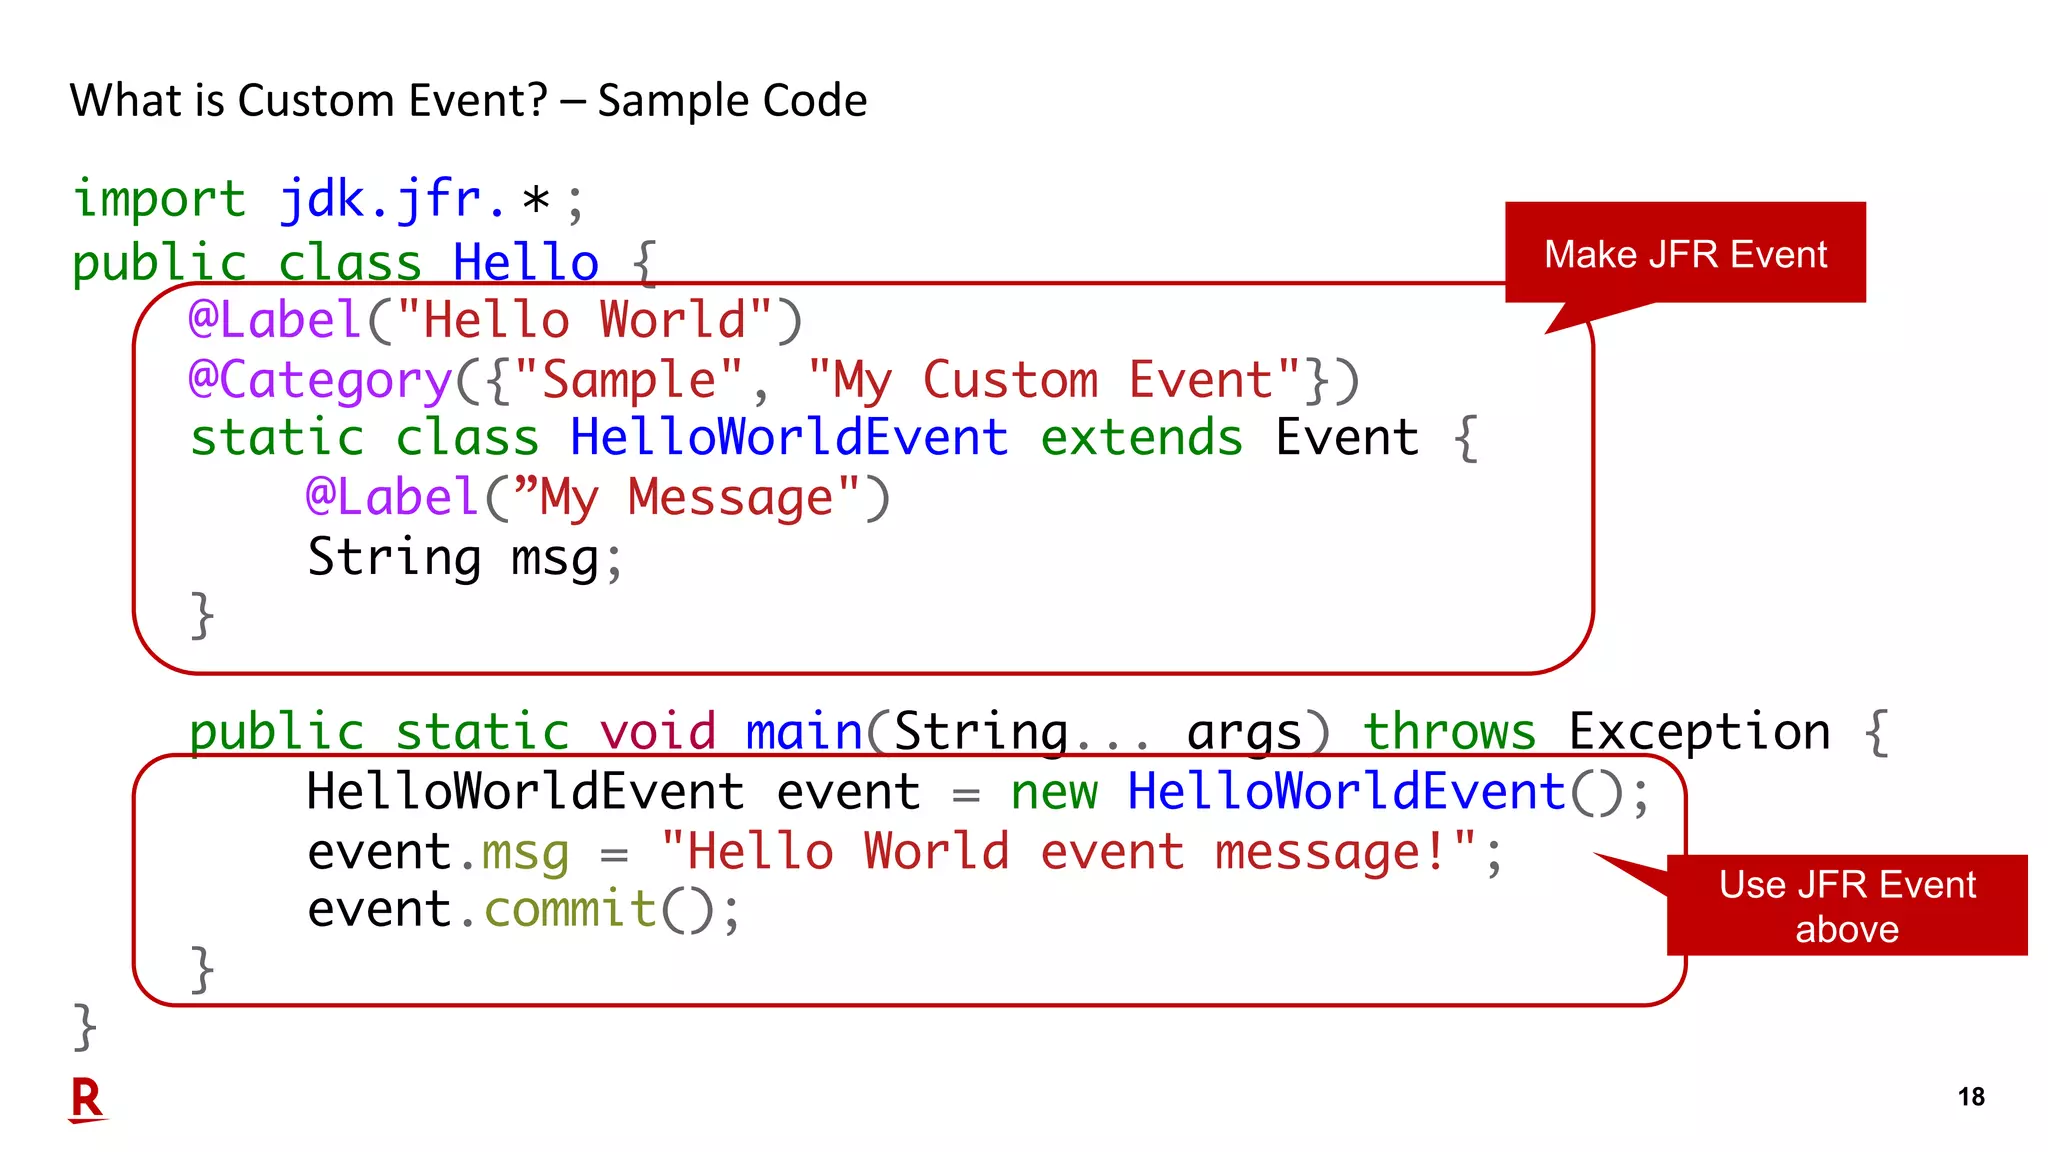
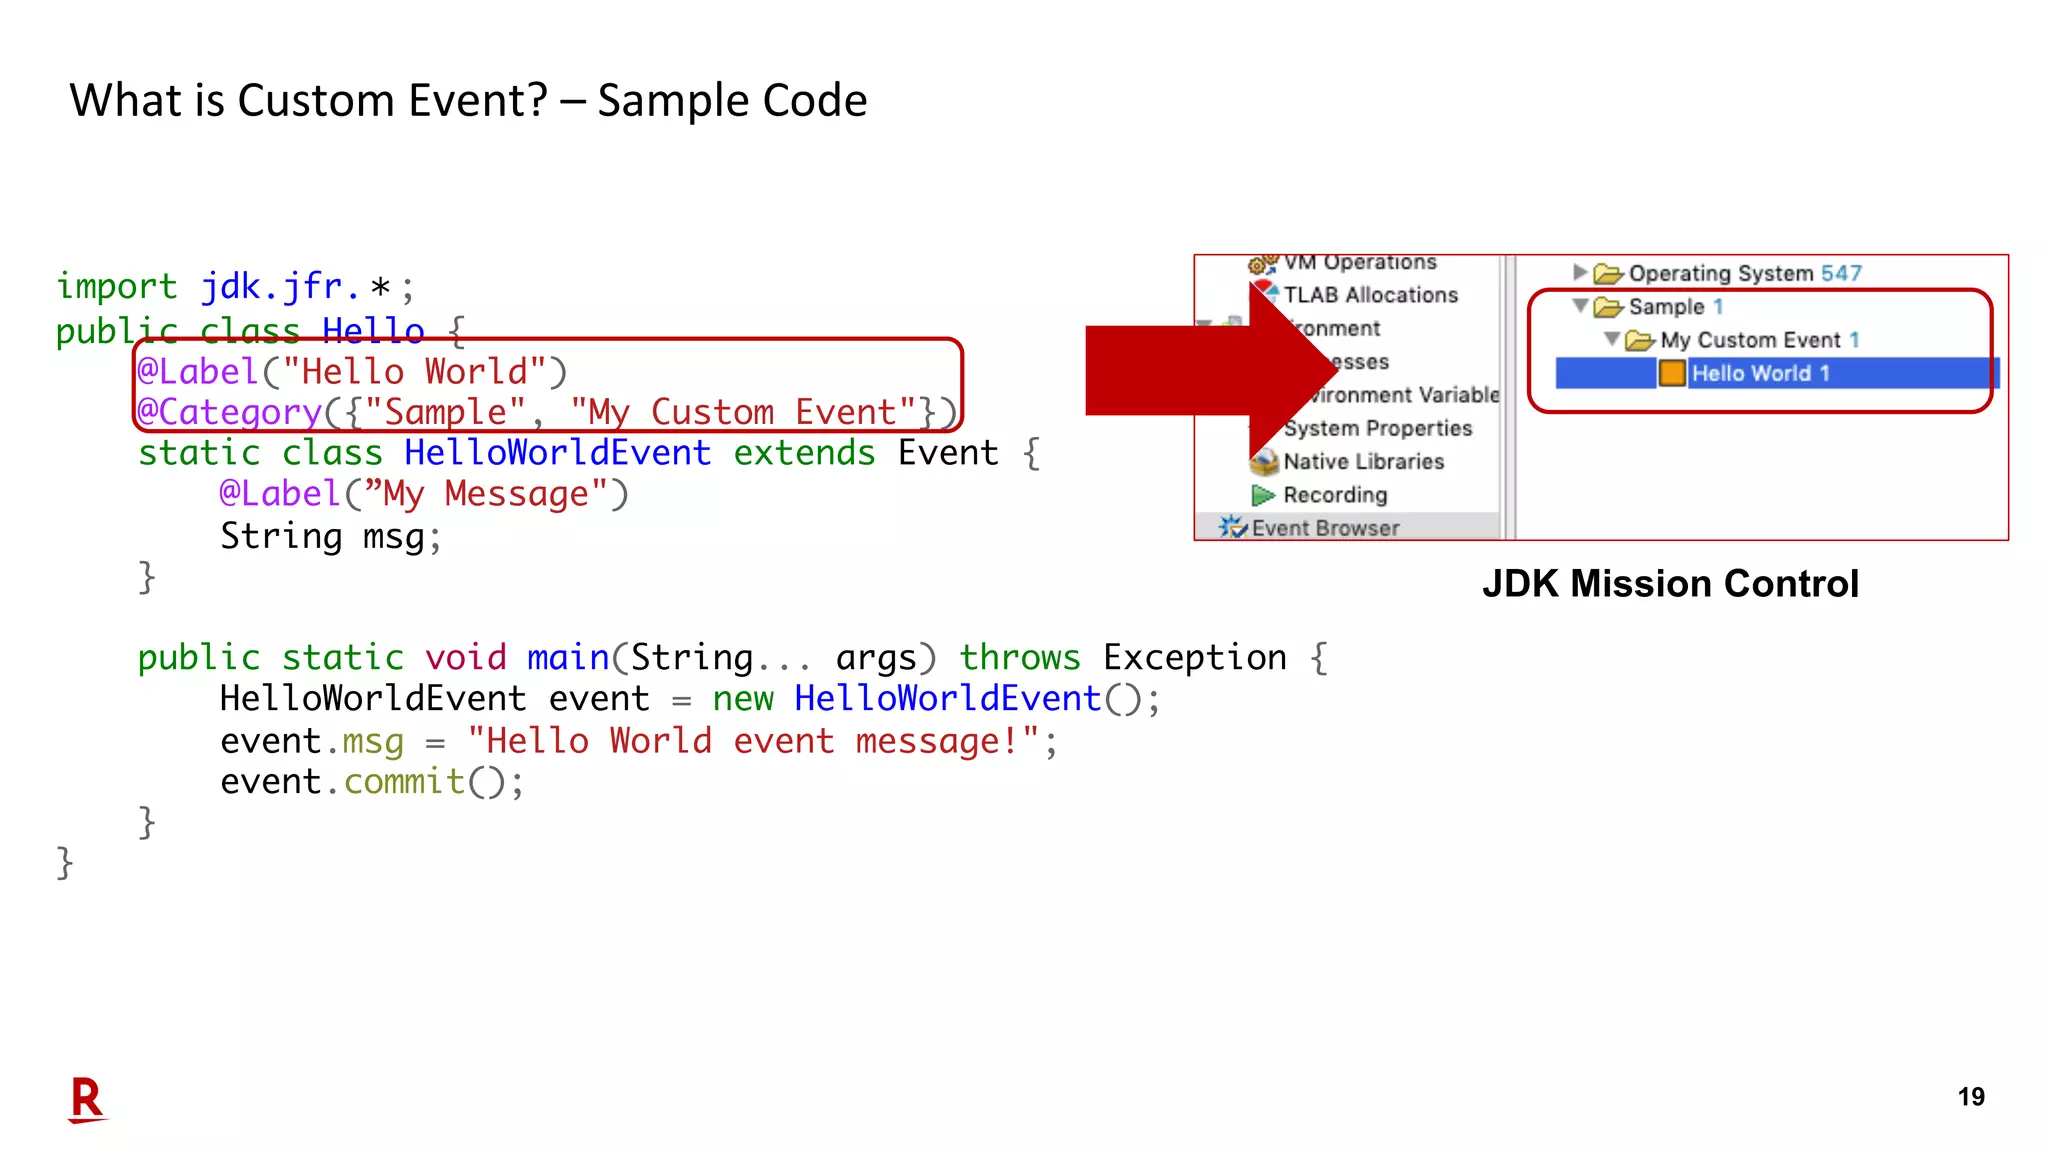
18 What is Custom Event? – Sample Code import jdk.jfr.*; public class Hello { @Label("Hello World") @Category({"Sample", "My Custom Event"}) static class HelloWorldEvent extends Event { @Label(”My Message") String msg; } public static void main(String... args) throws Exception { HelloWorldEvent event = new HelloWorldEvent(); event.msg = "Hello World event message!"; event.commit(); } } Make JFR Event Use JFR Event above
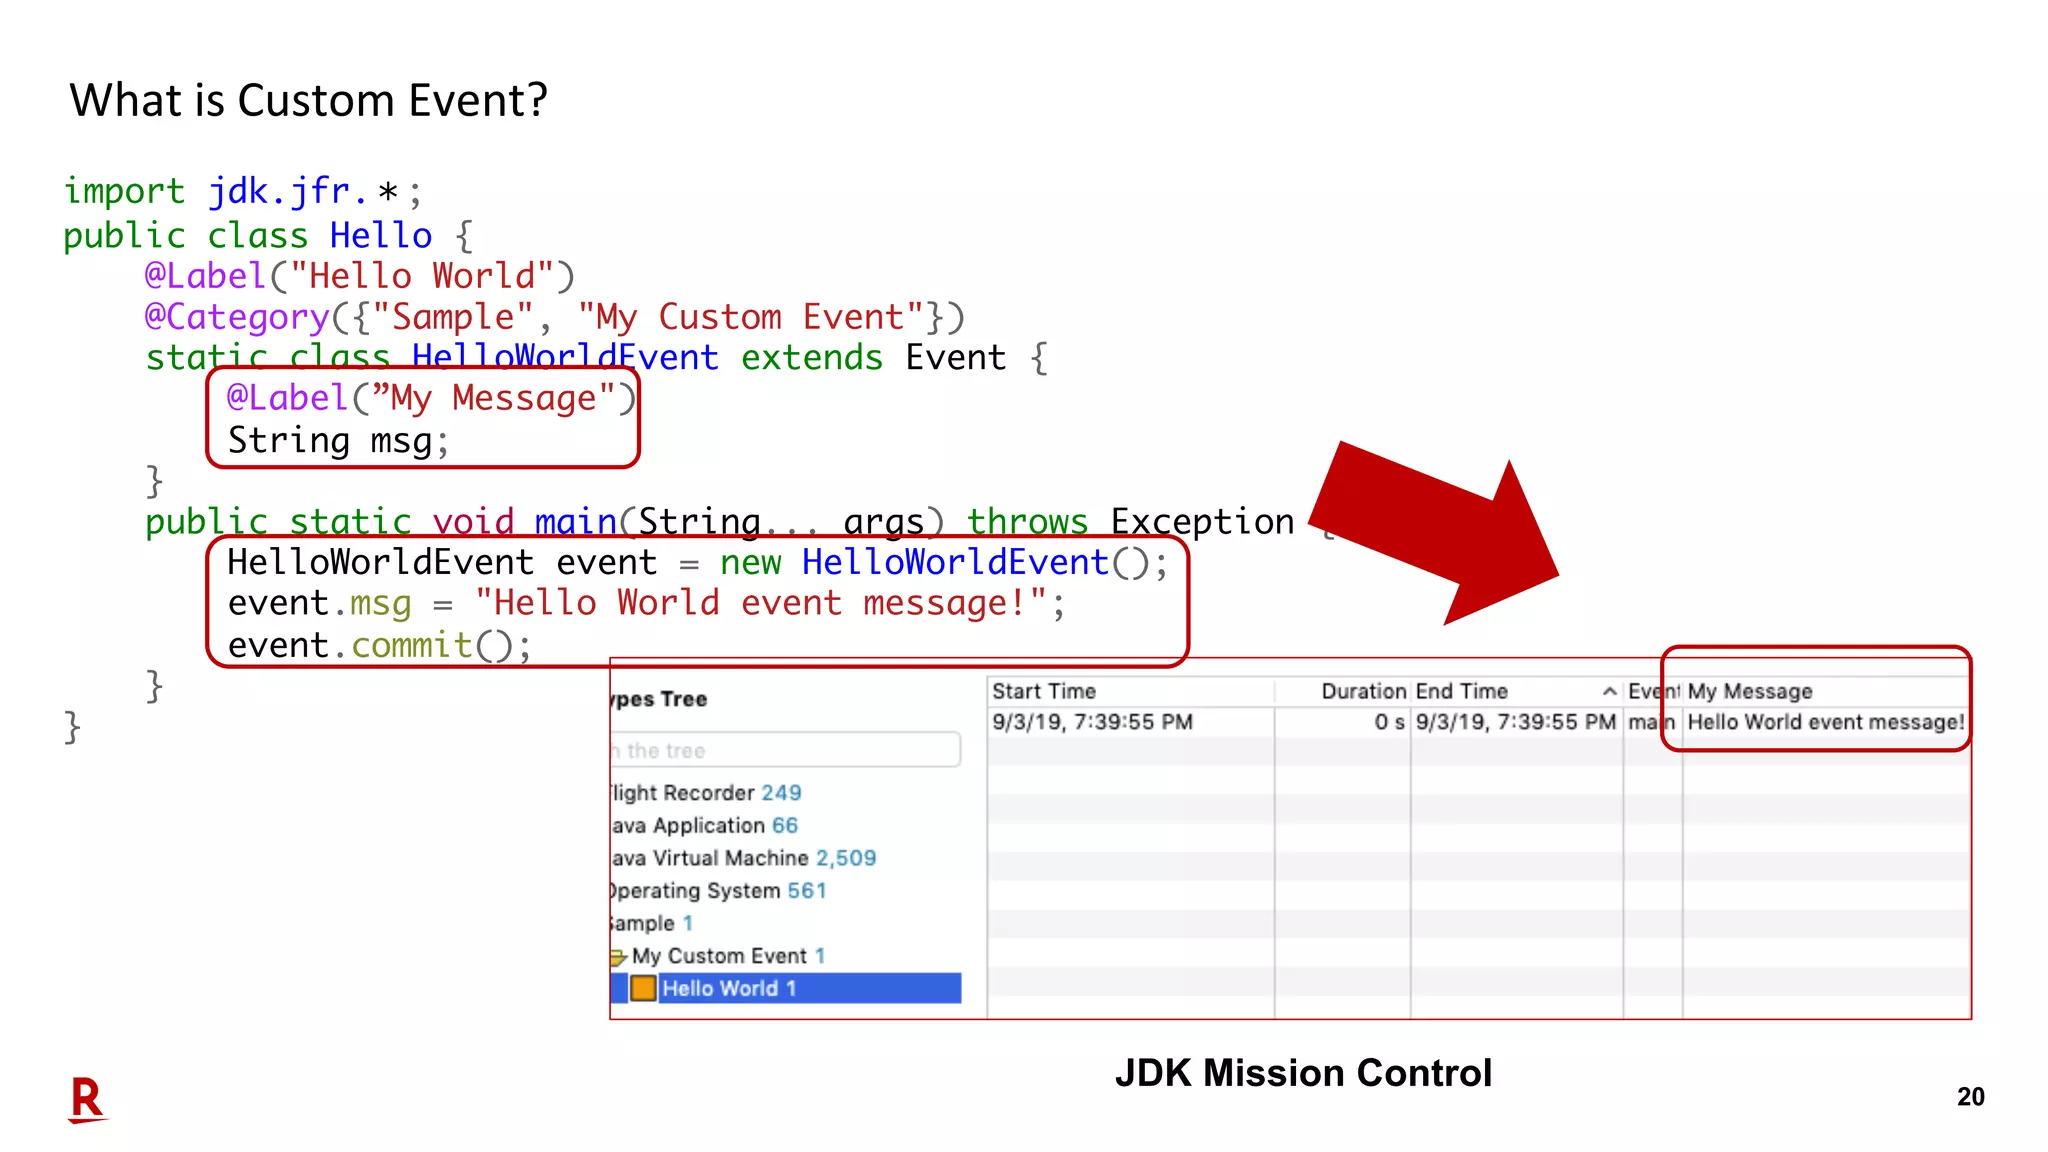
19 What is Custom Event? – Sample Code import jdk.jfr.*; public class Hello { @Label("Hello World") @Category({"Sample", "My Custom Event"}) static class HelloWorldEvent extends Event { @Label(”My Message") String msg; } public static void main(String... args) throws Exception { HelloWorldEvent event = new HelloWorldEvent(); event.msg = "Hello World event message!"; event.commit(); } } JDK Mission Control
20 What is Custom Event? import jdk.jfr.*; public class Hello { @Label("Hello World") @Category({"Sample", "My Custom Event"}) static class HelloWorldEvent extends Event { @Label(”My Message") String msg; } public static void main(String... args) throws Exception { HelloWorldEvent event = new HelloWorldEvent(); event.msg = "Hello World event message!"; event.commit(); } } JDK Mission Control
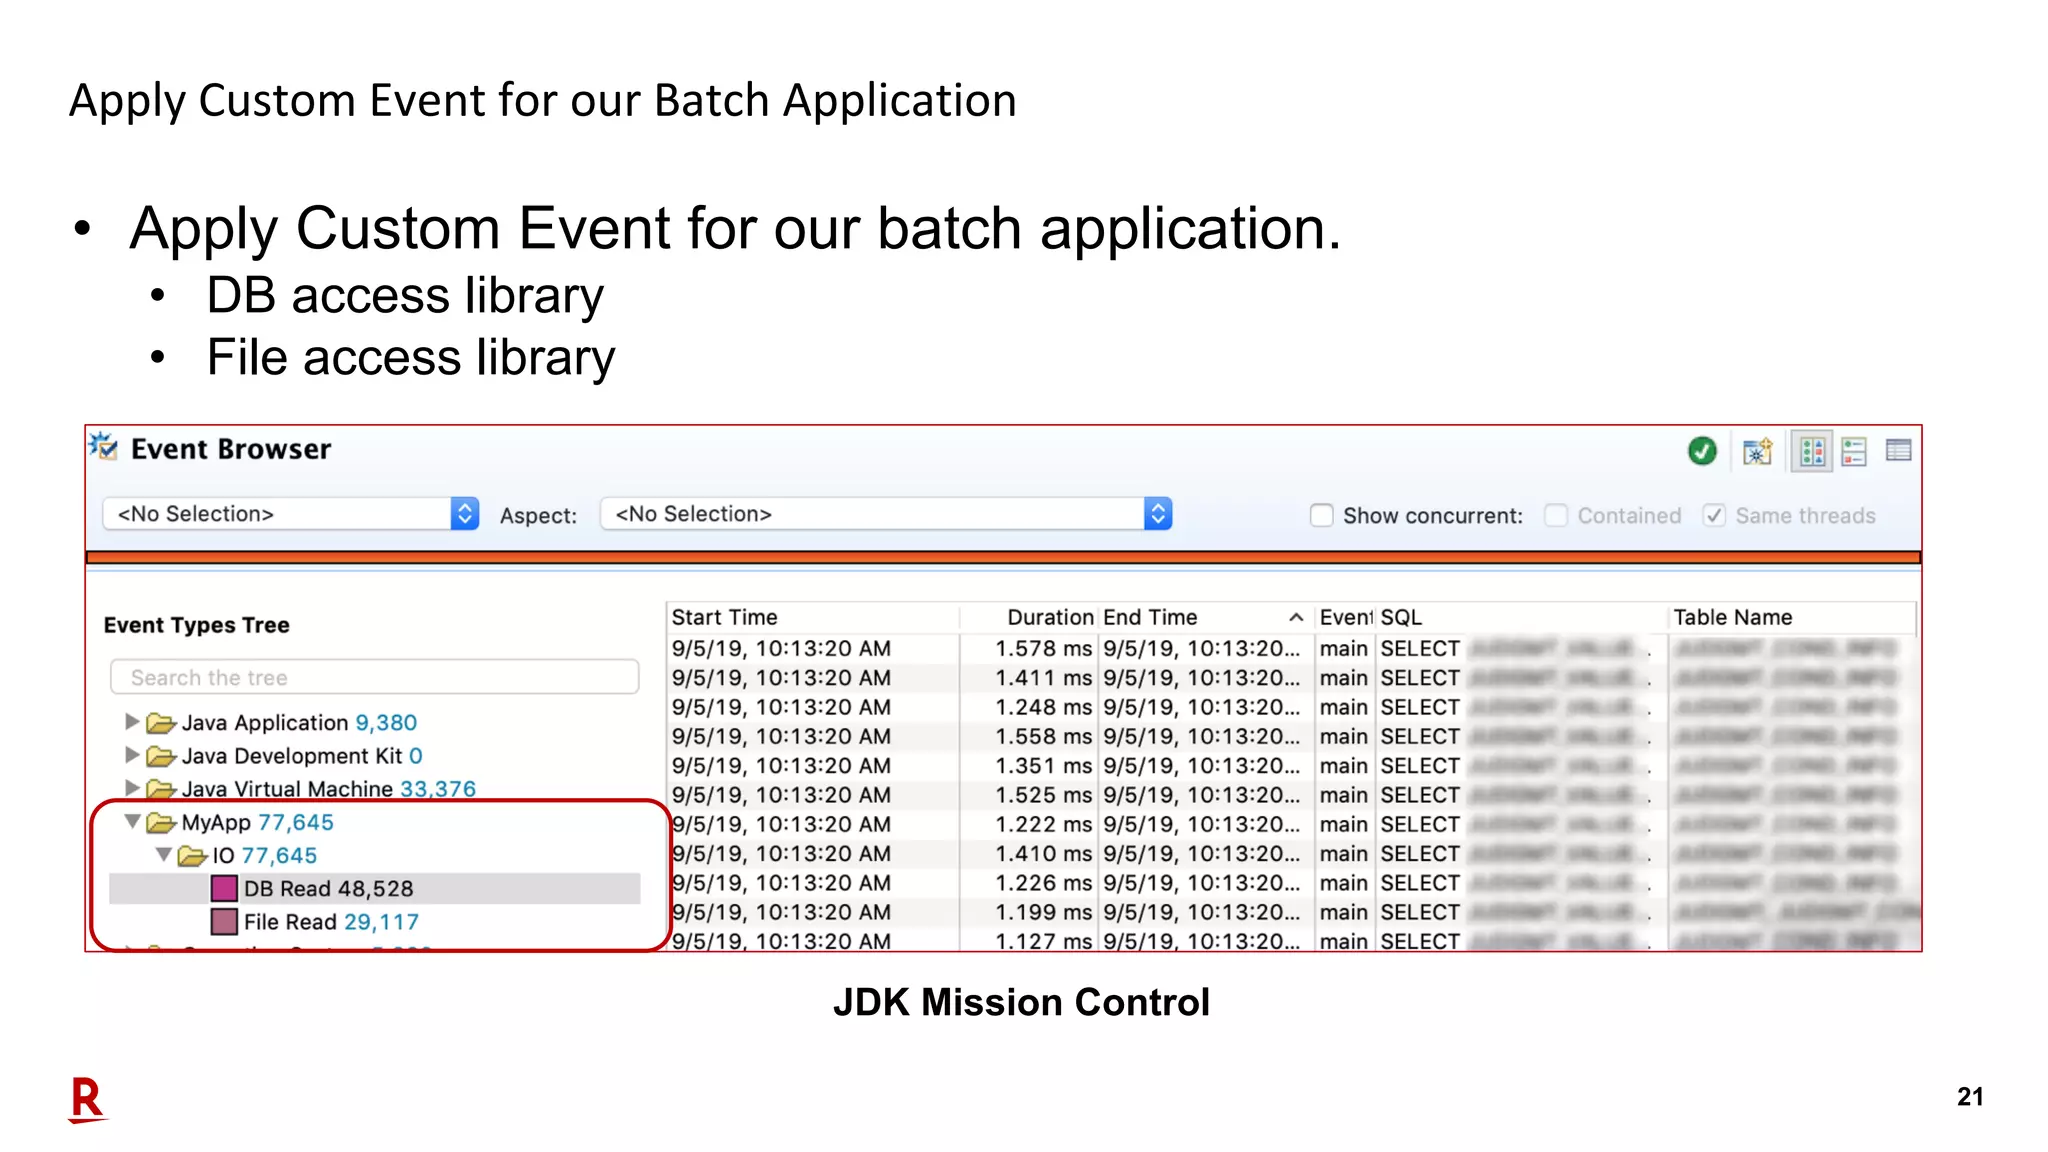
21 Apply Custom Event for our Batch Application • Apply Custom Event for our batch application. • DB access library • File access library JDK Mission Control
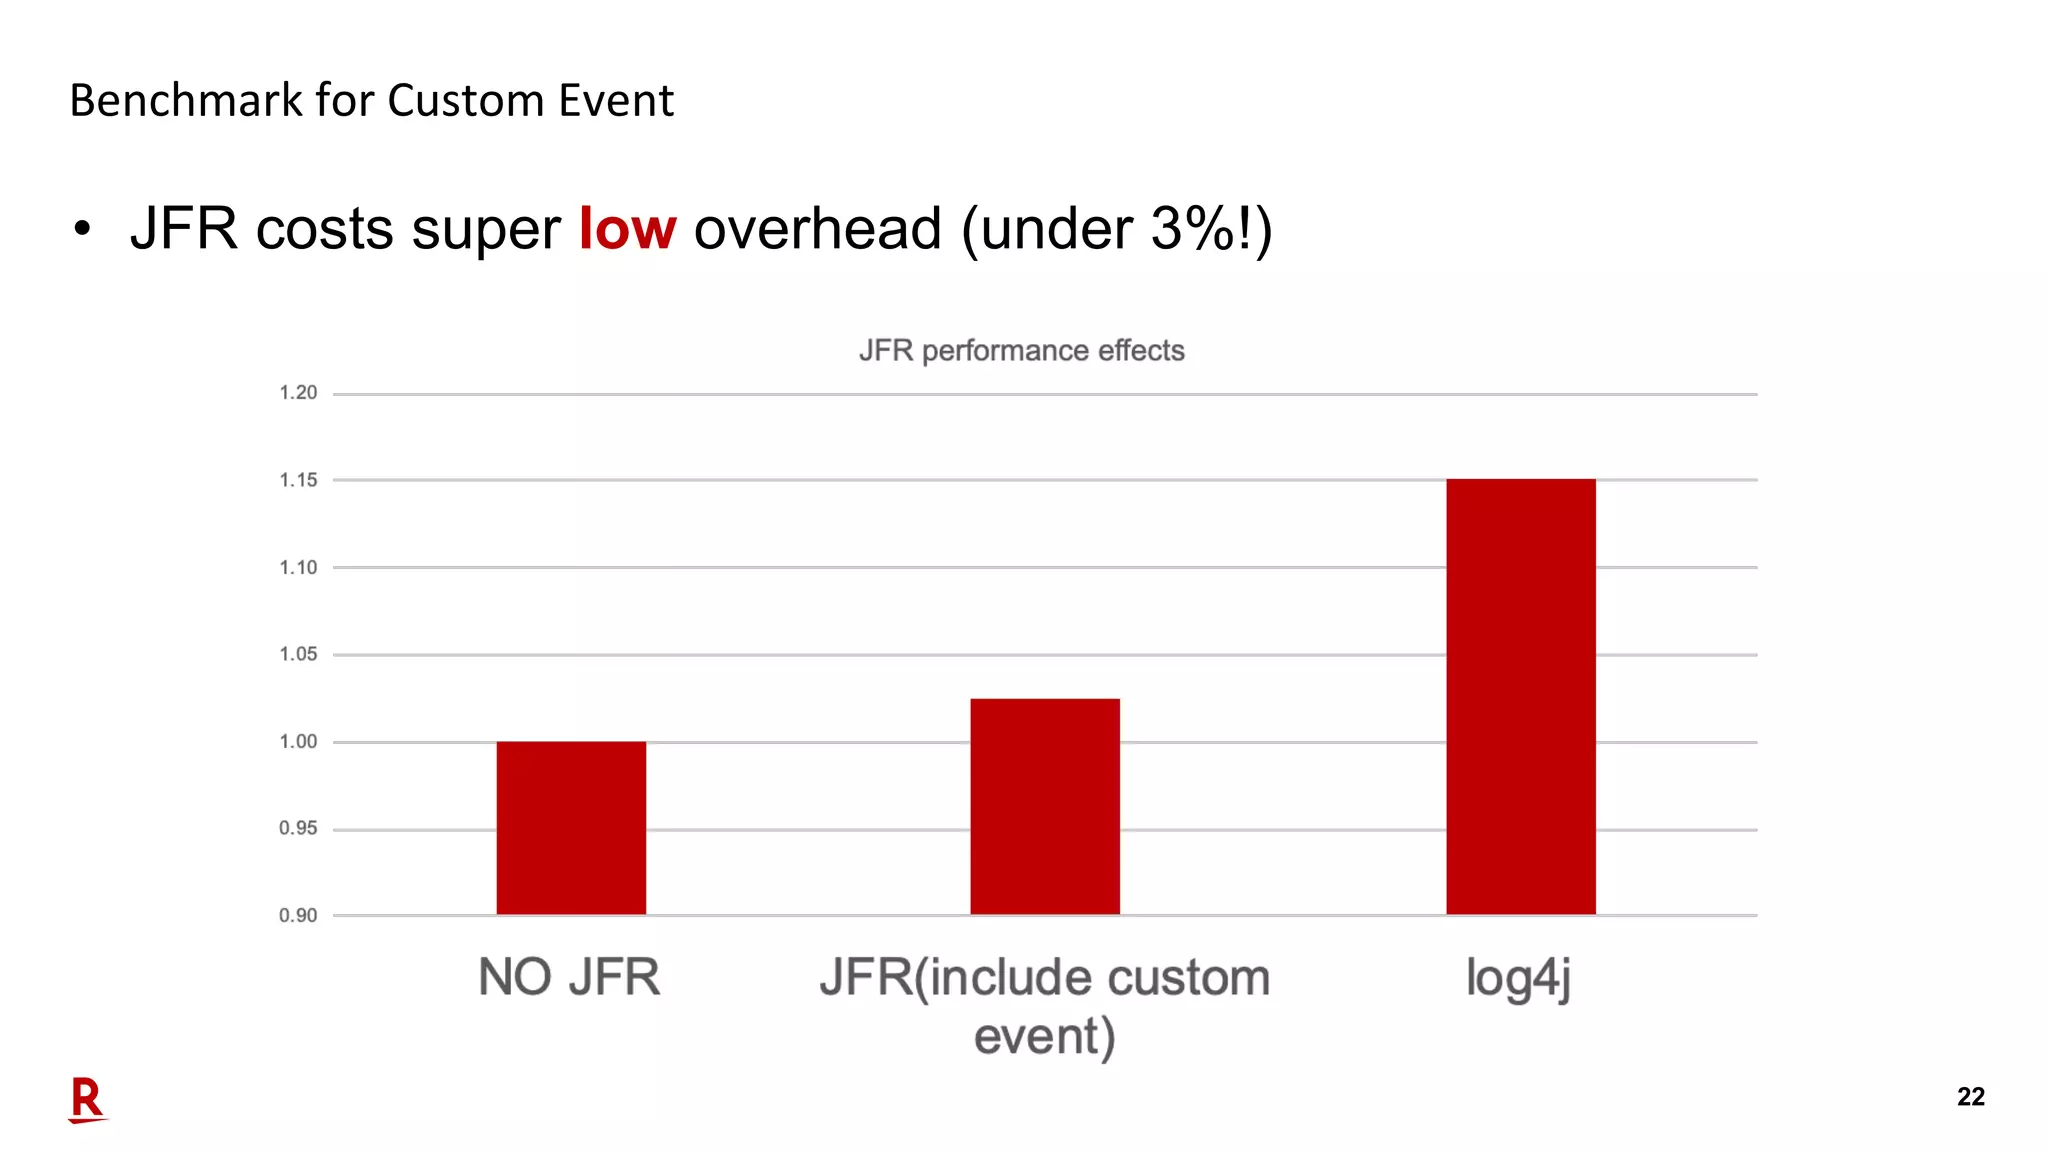
22 Benchmark for Custom Event • JFR costs super low overhead (under 3%!)
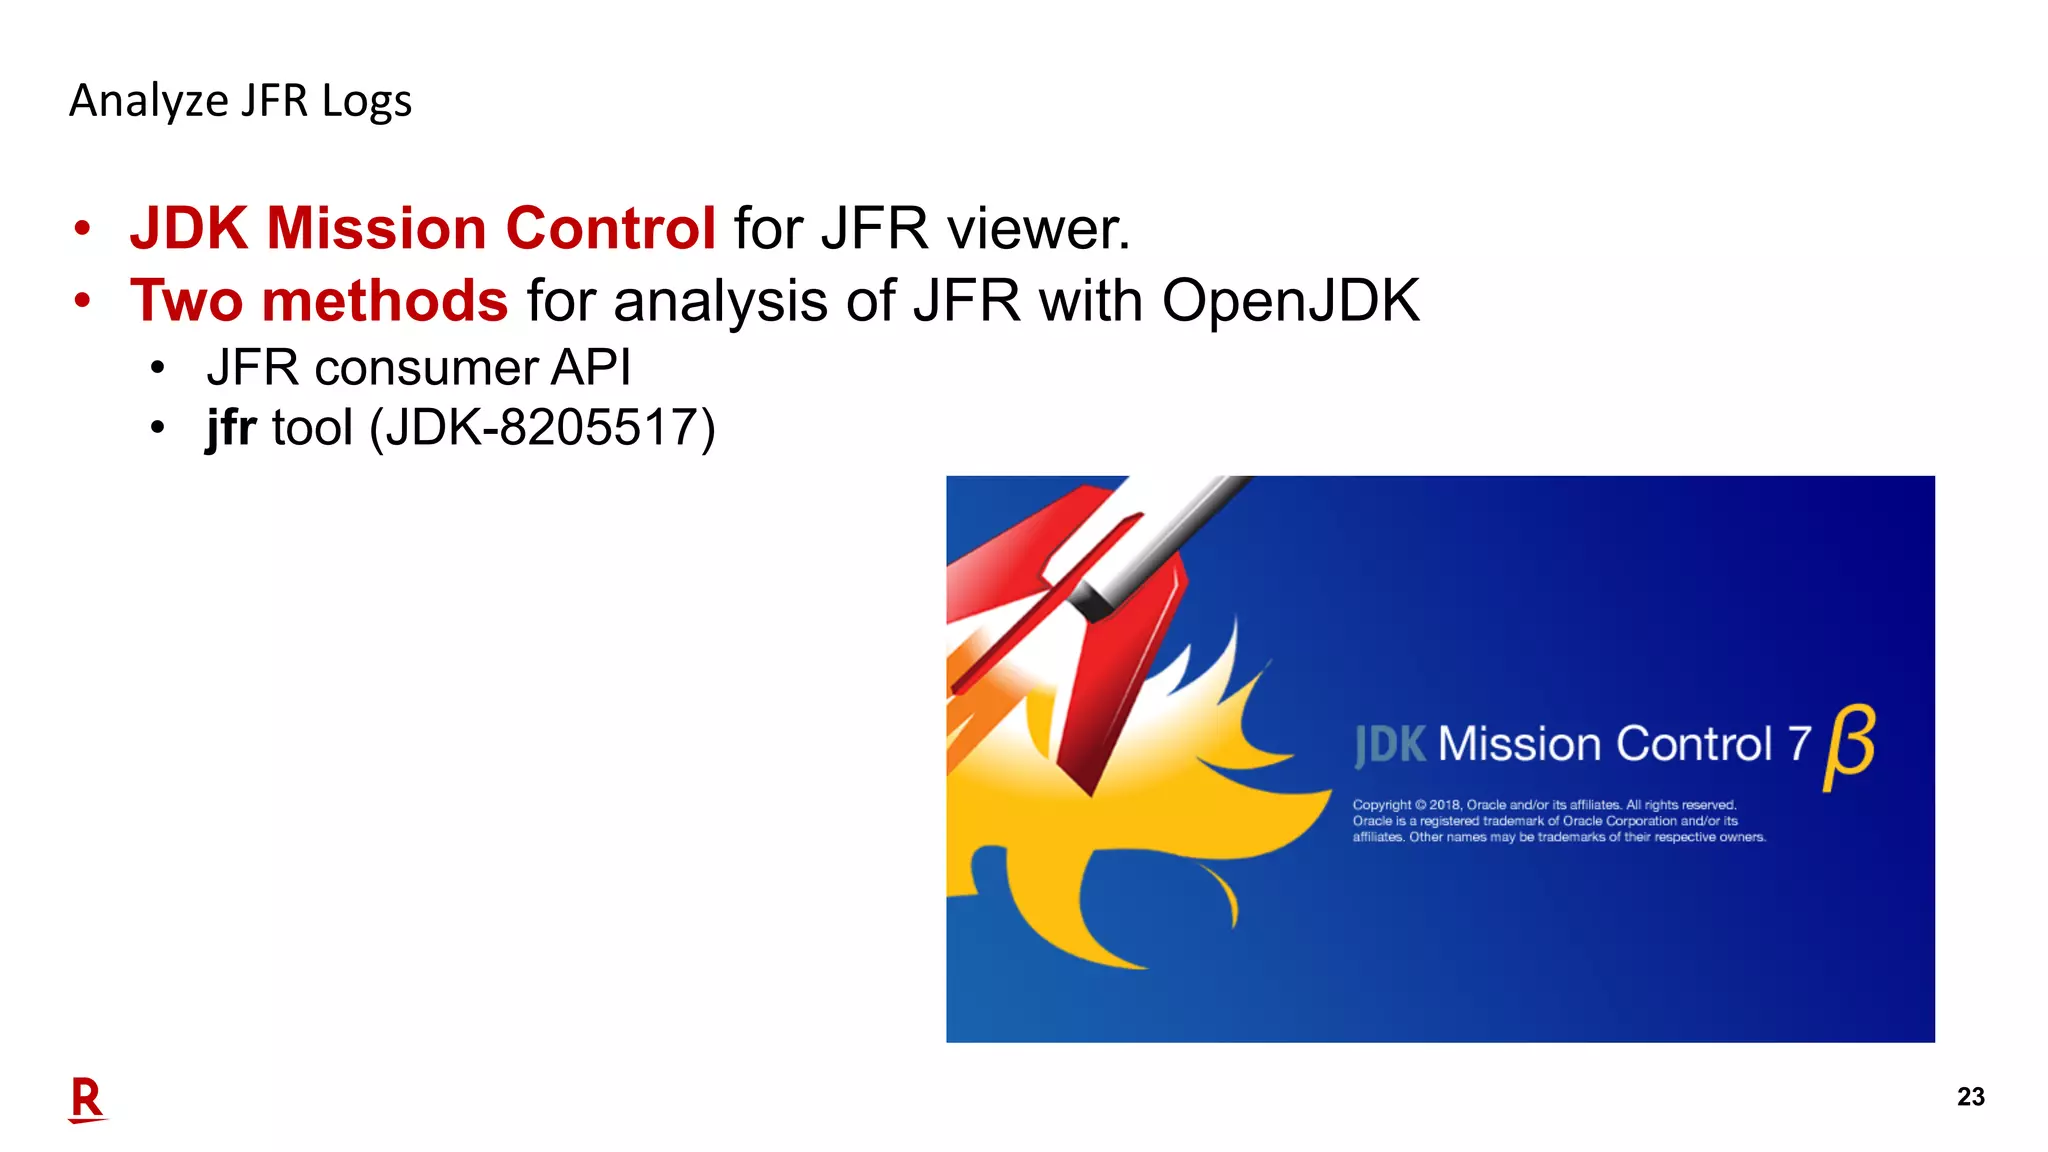
23 Analyze JFR Logs • JDK Mission Control for JFR viewer. • Two methods for analysis of JFR with OpenJDK • JFR consumer API • jfr tool (JDK-8205517)
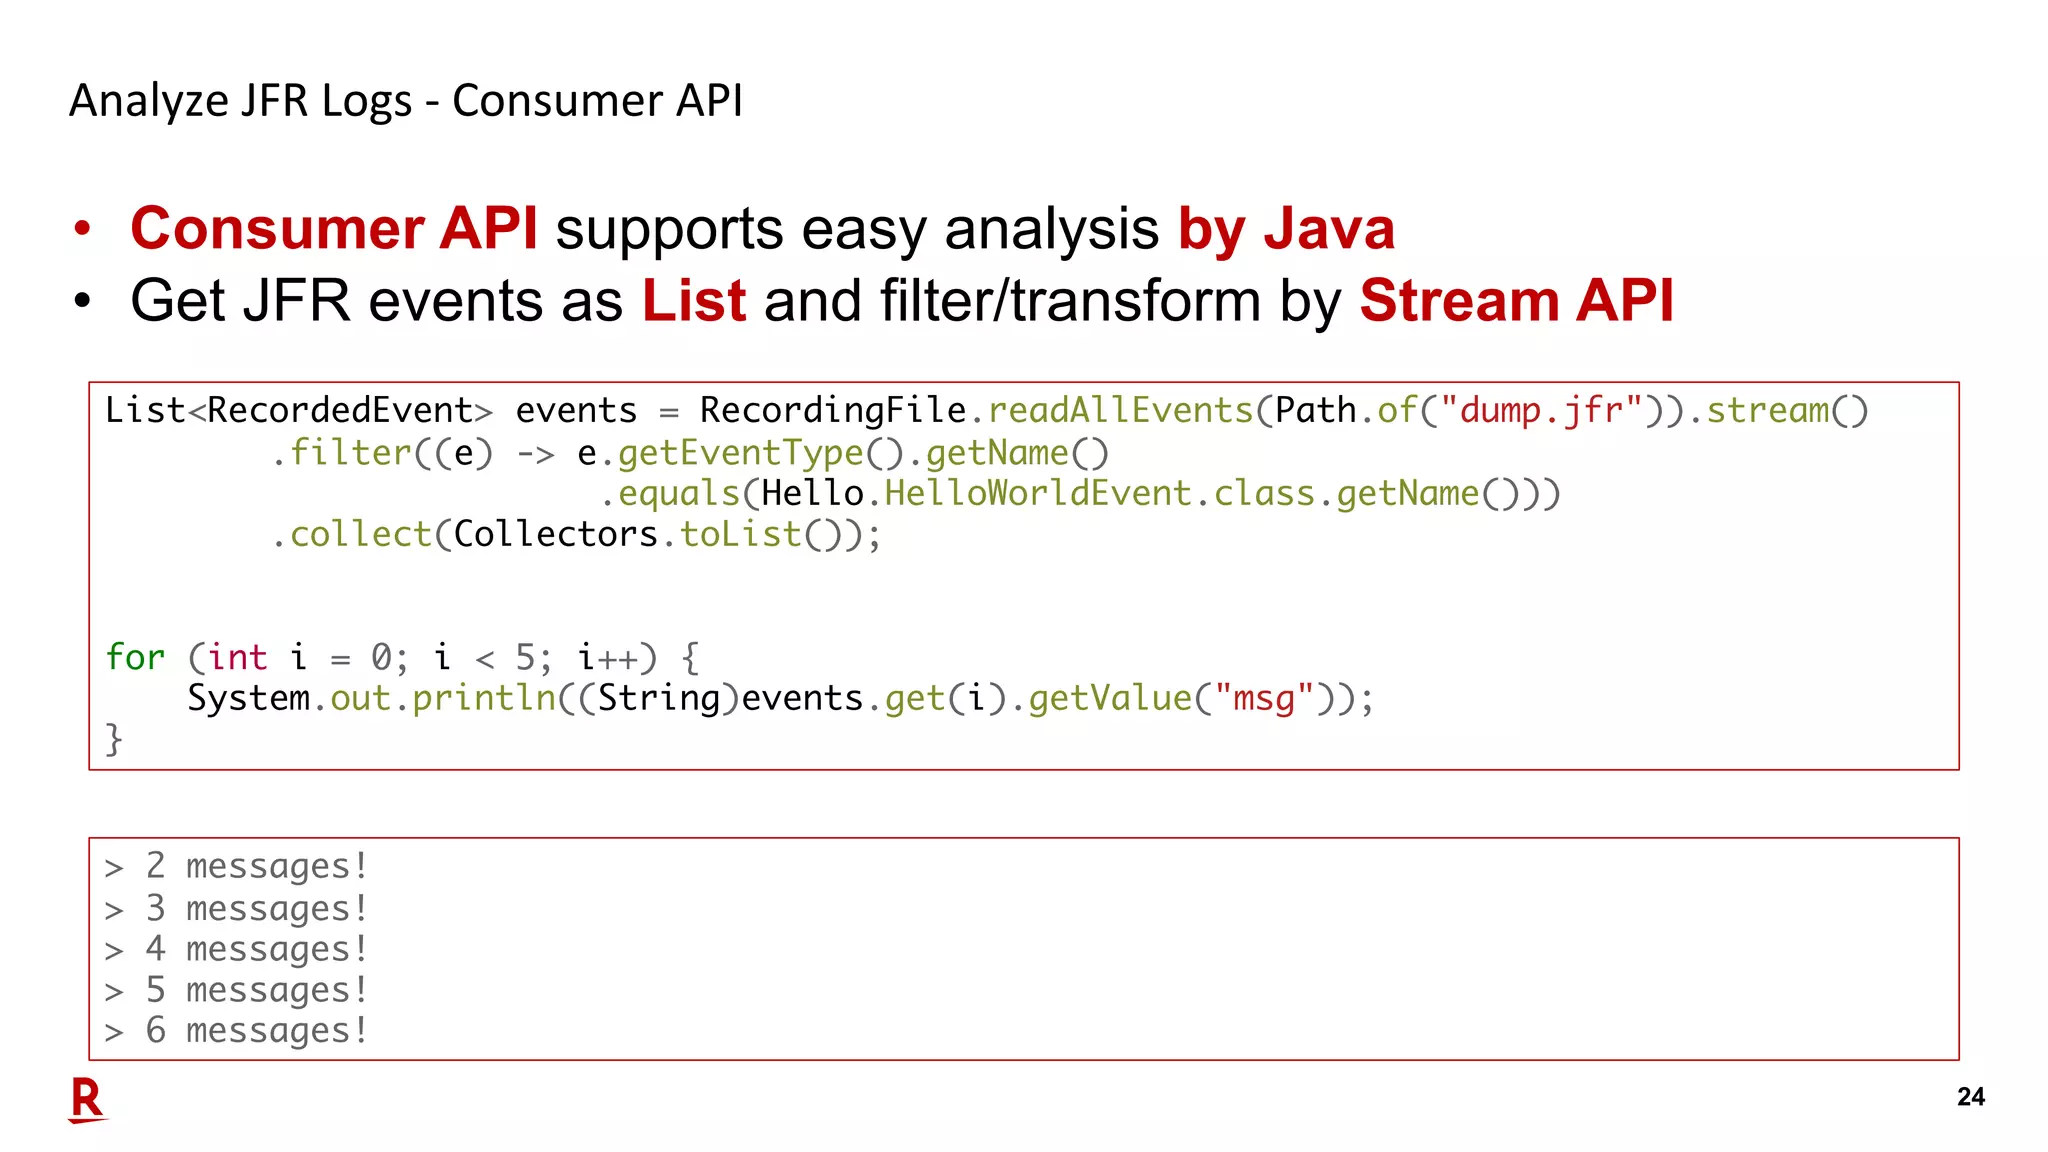
24 Analyze JFR Logs - Consumer API • Consumer API supports easy analysis by Java • Get JFR events as List and filter/transform by Stream API List<RecordedEvent> events = RecordingFile.readAllEvents(Path.of("dump.jfr")).stream() .filter((e) -> e.getEventType().getName() .equals(Hello.HelloWorldEvent.class.getName())) .collect(Collectors.toList()); for (int i = 0; i < 5; i++) { System.out.println((String)events.get(i).getValue("msg")); } > 2 messages! > 3 messages! > 4 messages! > 5 messages! > 6 messages!
25 Analyze JFR Logs – jfr tool • jfr tool is a new utility to extracting, assemble and split for JFR file. • Available since OpenJDK 12 (probably backporting to JDK 11) Option Description jfr print [--xml|--json] [--categories <filter>] [--events <filter>] [--stack-depth <depth>] <file> Print contents of a recording file. It supports Text, XML and JSON. categories and event option is filter by name with glob patterns. stack-depth is number of frames in stack traces, by default 5. jfr metadata <file> Display event metadata, such as labels, descriptions and field layout jfr summary <file> Display general information about a recording file (.jfr) jfr assemble <repository> <file> Assemble leftover chunks from a disk repository into a recording file jfr disassemble [--output <directory>] [--max-chunks <chunks>] [--max-size <size>] <file> Disassamble a recording file into smaller files/chunks
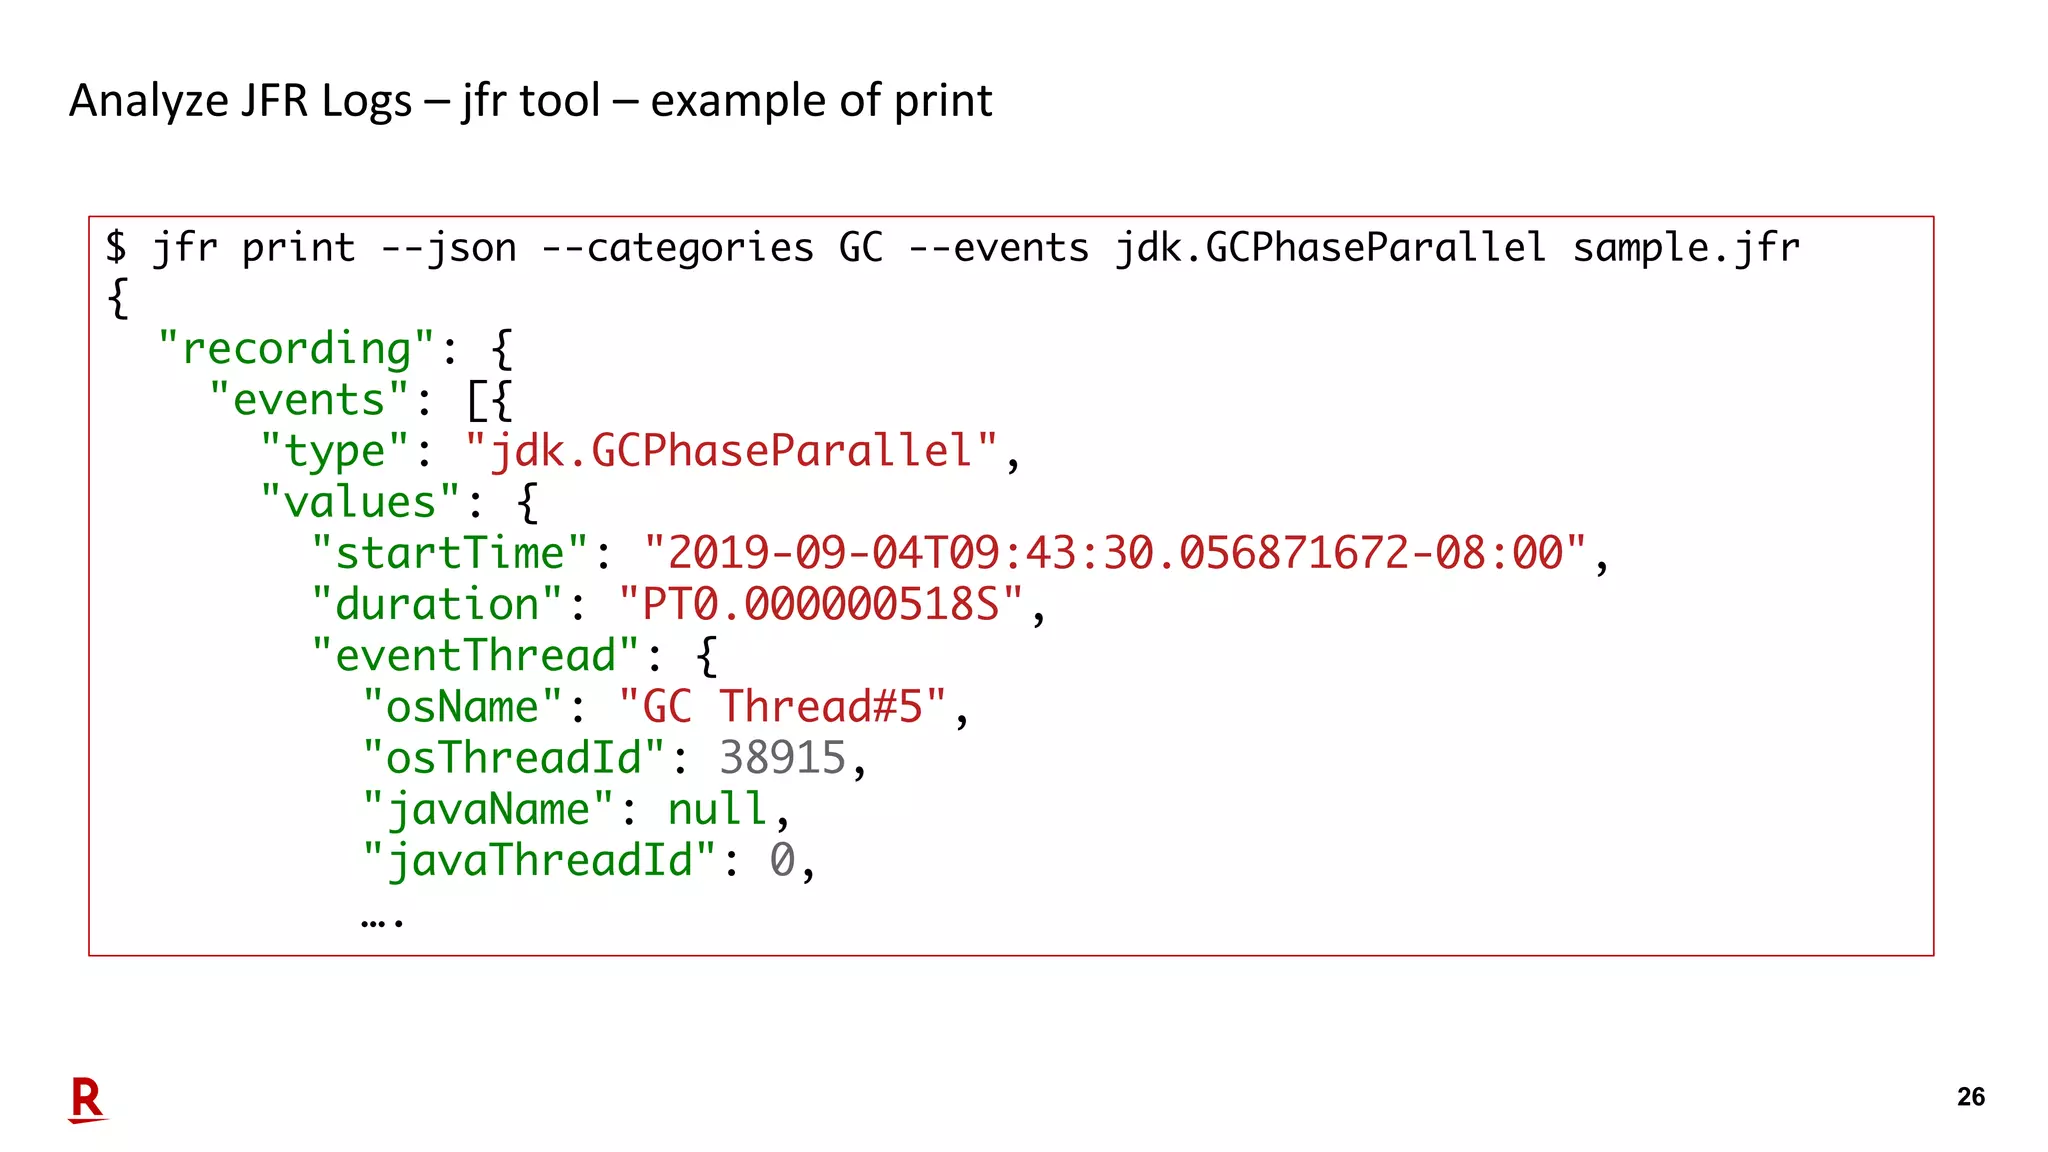
26 Analyze JFR Logs – jfr tool – example of print $ jfr print --json --categories GC --events jdk.GCPhaseParallel sample.jfr { "recording": { "events": [{ "type": "jdk.GCPhaseParallel", "values": { "startTime": "2019-09-04T09:43:30.056871672-08:00", "duration": "PT0.000000518S", "eventThread": { "osName": "GC Thread#5", "osThreadId": 38915, "javaName": null, "javaThreadId": 0, ….
27 Our strategy of real-time JFR monitoring platform
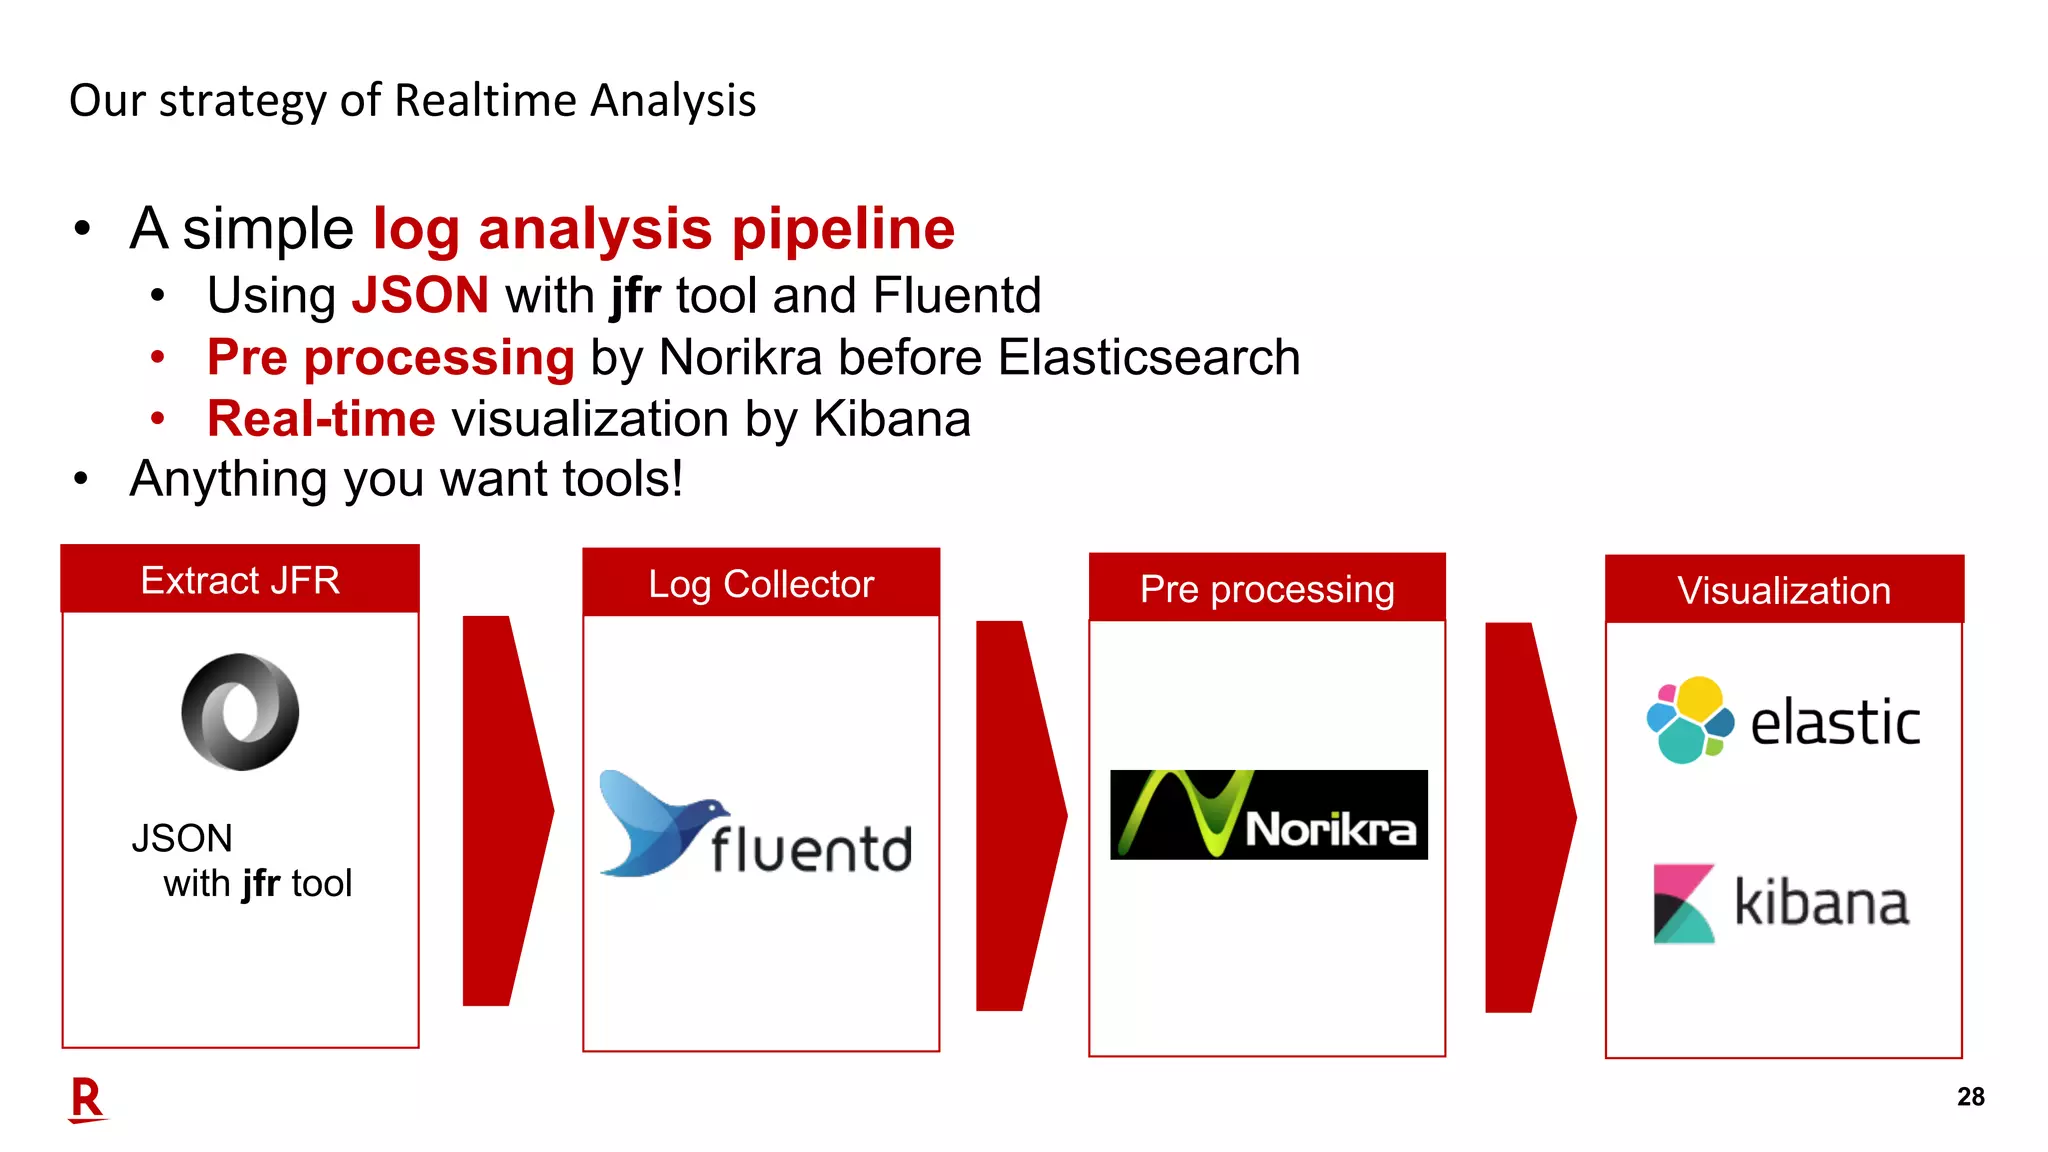
28 Our strategy of Realtime Analysis • A simple log analysis pipeline • Using JSON with jfr tool and Fluentd • Pre processing by Norikra before Elasticsearch • Real-time visualization by Kibana • Anything you want tools! JSON with jfr tool Extract JFR Log Collector Pre processing Visualization
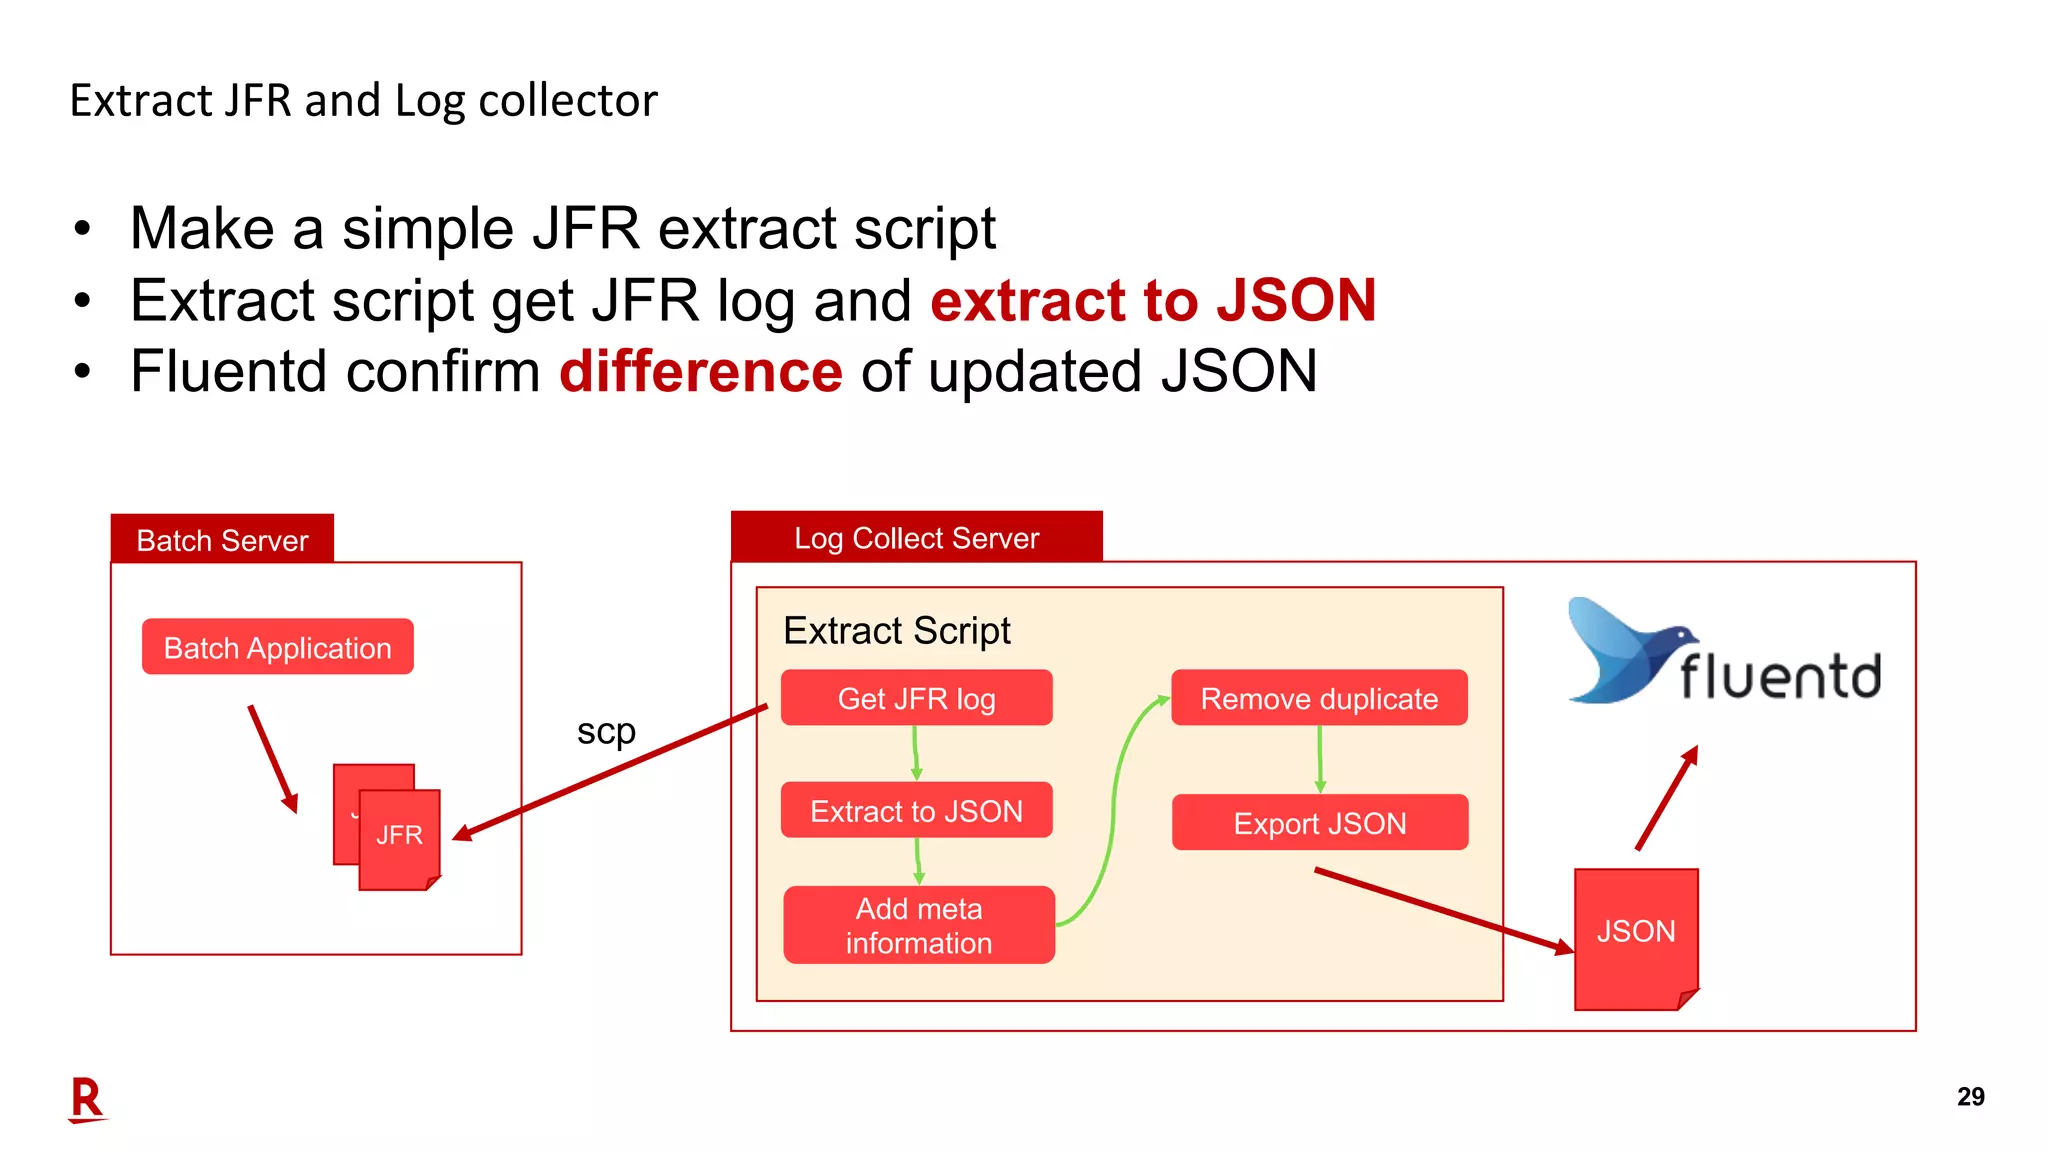
29 Extract JFR and Log collector • Make a simple JFR extract script • Extract script get JFR log and extract to JSON • Fluentd confirm difference of updated JSON Batch Server Batch Application JFR JFR Log Collect Server Get JFR log Extract Script Extract to JSON Add meta information Remove duplicate Export JSON JSON scp
30 Extract JFR and Log collector – Extract Script • This is core logic of extract script. • Extract to JSON from JFR • Transform to Fluentd readable JSON(jq –c .) • Add meta information(Batch Name) cp -f ${INPUT_JFR} ./chunk.jfr jfr print --json --categories GC,Profiling,Processsor,Heap,MyApp --events jdk.GCPhaseParallel,jdk.ExecutionSample,jdk.CPULoad,jdk.GCHeapSummary, myapp.FileReaderEvent,myapp.DBReadEvent --stack-depth 10 chunk.jfr |jq '.recording.events[]' | jq -c '.|= .+ {"batchName": "'${BATCH_NAME}'"}' > ./chunk.json
31 Extract JFR and Log collector – Extracted JSON {"type":"jdk.CPULoad","value":{"startTime":"2019-09-08T16:13:01.980014338- 08:00","jvmUser":0.23814254,"jvmSystem":0.019405695,"machineTotal":0.5409429},"batchName":" MyJob"} {"type":"myapp.FileReaderEvent","value":{"startTime":"2019-09-08T16:13:50.255682648- 08:00","duration":"PT0.000012787S",..., "fileId":”EXAMPLEI1","filePath":"target/EXAMPLEI1","isVariableFile":false},"batchName":"MyJ ob"} {"type":"jdk.GCPhaseParallel","value":{"startTime":"2019-09-08T16:13:50.964675810- 08:00","duration":"PT0.000000684S","eventThread":{"osName":"GC Thread#0","osThreadId":12035,"javaName":null,"javaThreadId":0,"group":null},"gcId":123,"gcW orkerId":0,"name":"ObjCopy"},"batchName":"MyJob"} {"type":"jdk.ExecutionSample","value":{"startTime":"2019-09-08T16:13:00.267202865- 08:00",...,"stackTrace":{"truncated":false,"frames":[{"method":[...]},"state":"STATE_RUNNAB LE"},"batchName":"MyJob"} • One record, one JFR event.
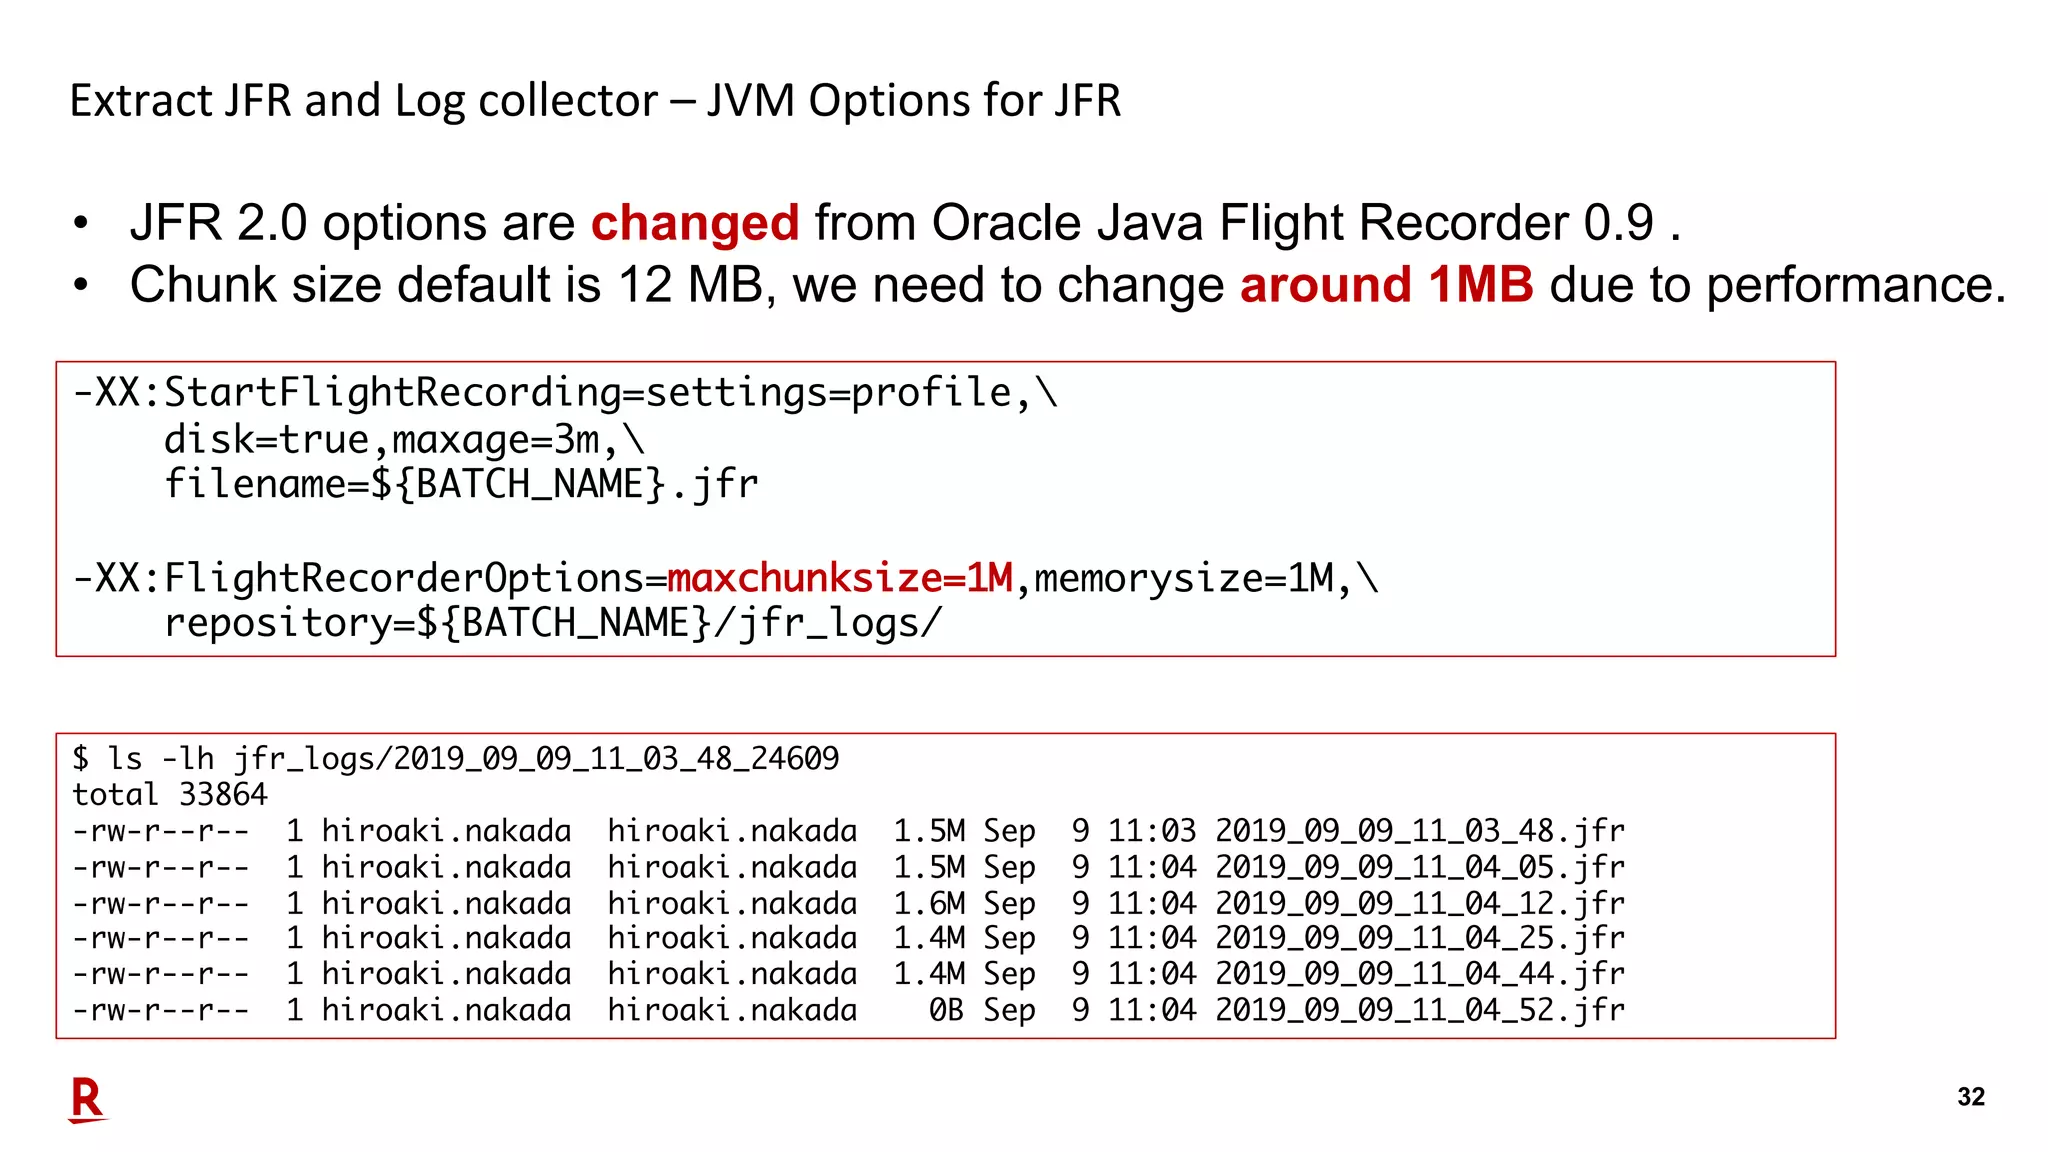
32 Extract JFR and Log collector – JVM Options for JFR • JFR 2.0 options are changed from Oracle Java Flight Recorder 0.9 . • Chunk size default is 12 MB, we need to change around 1MB due to performance. -XX:StartFlightRecording=settings=profile, disk=true,maxage=3m, filename=${BATCH_NAME}.jfr -XX:FlightRecorderOptions=maxchunksize=1M,memorysize=1M, repository=${BATCH_NAME}/jfr_logs/ $ ls -lh jfr_logs/2019_09_09_11_03_48_24609 total 33864 -rw-r--r-- 1 hiroaki.nakada hiroaki.nakada 1.5M Sep 9 11:03 2019_09_09_11_03_48.jfr -rw-r--r-- 1 hiroaki.nakada hiroaki.nakada 1.5M Sep 9 11:04 2019_09_09_11_04_05.jfr -rw-r--r-- 1 hiroaki.nakada hiroaki.nakada 1.6M Sep 9 11:04 2019_09_09_11_04_12.jfr -rw-r--r-- 1 hiroaki.nakada hiroaki.nakada 1.4M Sep 9 11:04 2019_09_09_11_04_25.jfr -rw-r--r-- 1 hiroaki.nakada hiroaki.nakada 1.4M Sep 9 11:04 2019_09_09_11_04_44.jfr -rw-r--r-- 1 hiroaki.nakada hiroaki.nakada 0B Sep 9 11:04 2019_09_09_11_04_52.jfr
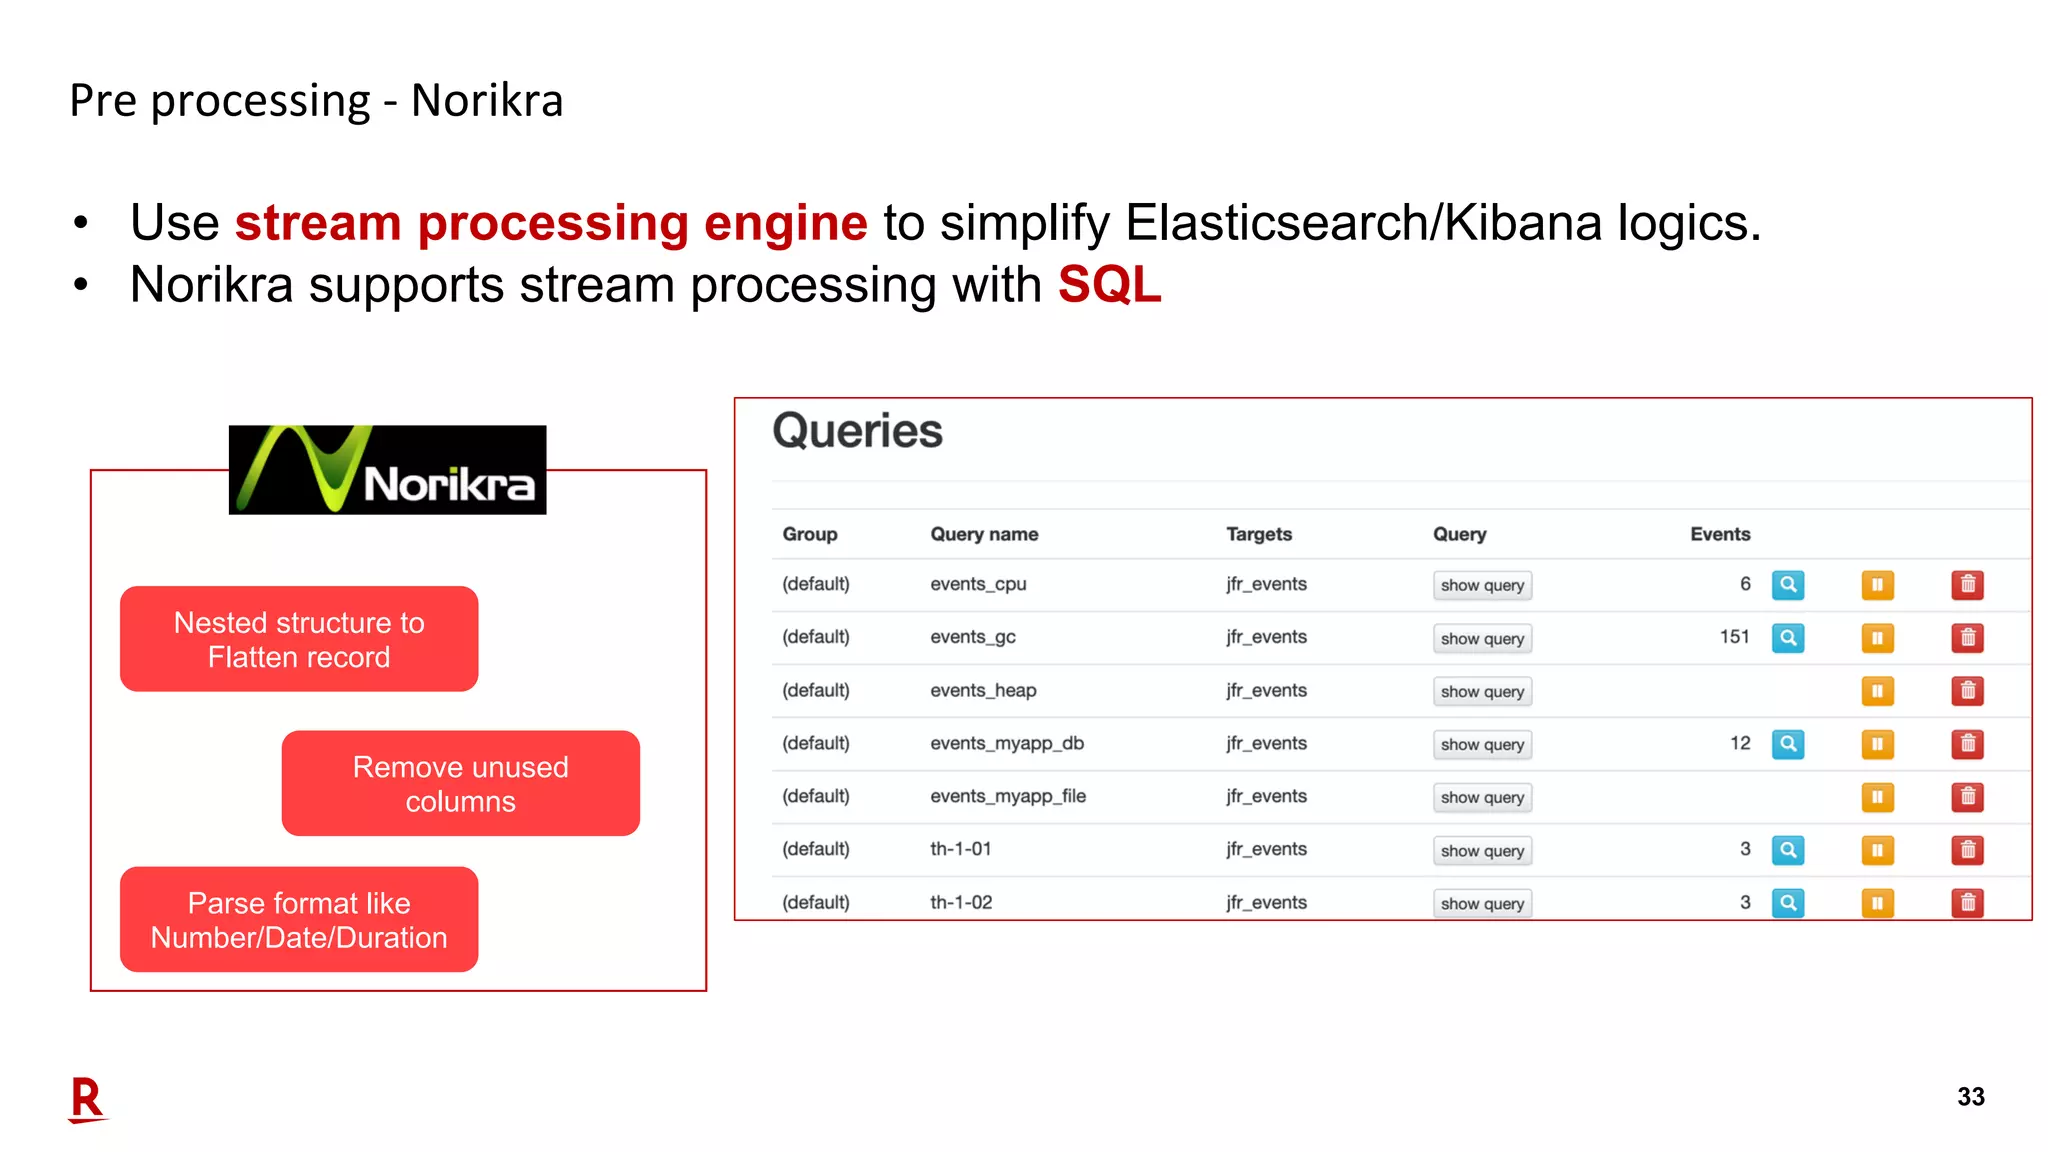
33 Pre processing - Norikra • Use stream processing engine to simplify Elasticsearch/Kibana logics. • Norikra supports stream processing with SQL Nested structure to Flatten record Parse format like Number/Date/Duration Remove unused columns
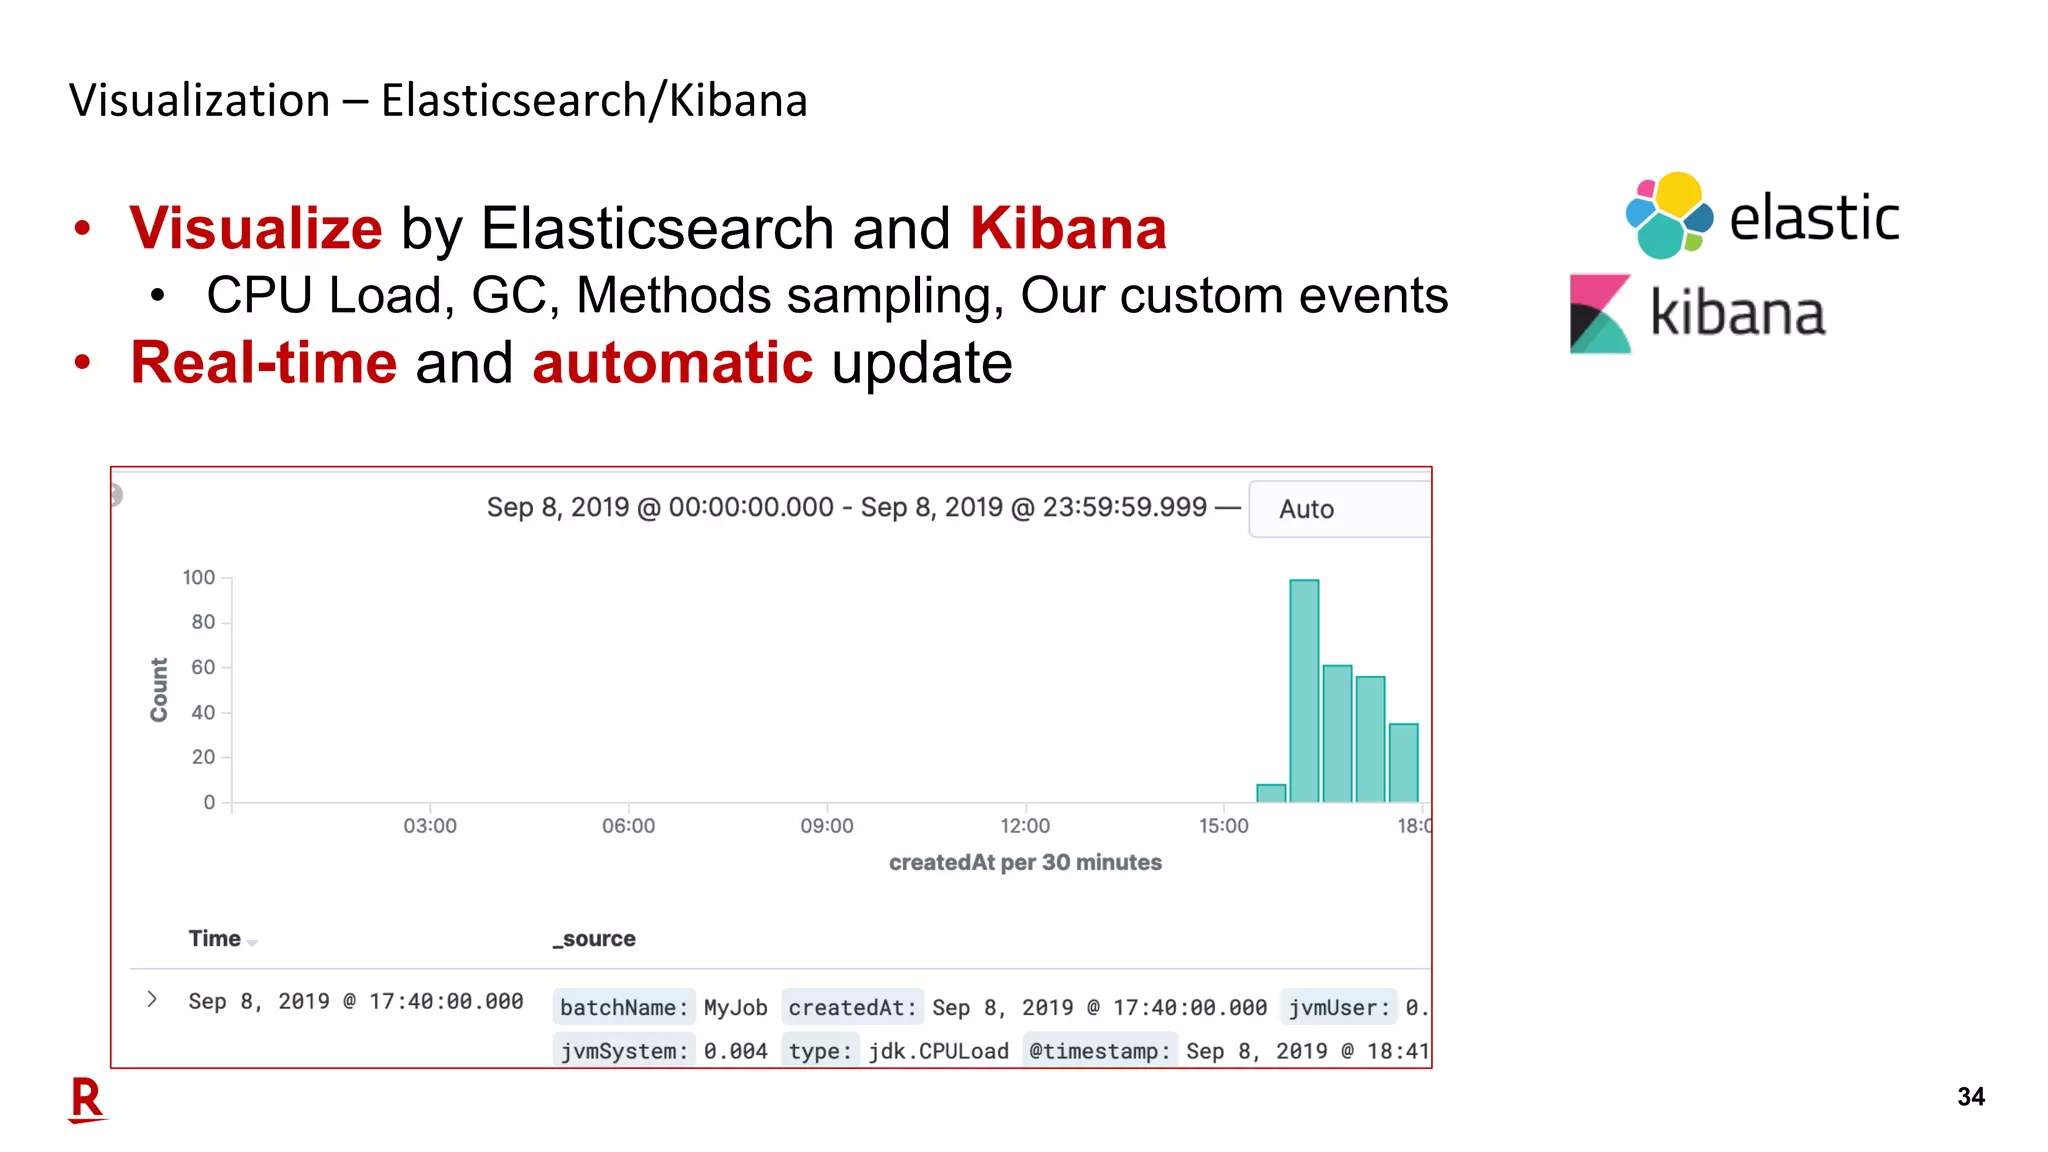
34 Visualization – Elasticsearch/Kibana • Visualize by Elasticsearch and Kibana • CPU Load, GC, Methods sampling, Our custom events • Real-time and automatic update
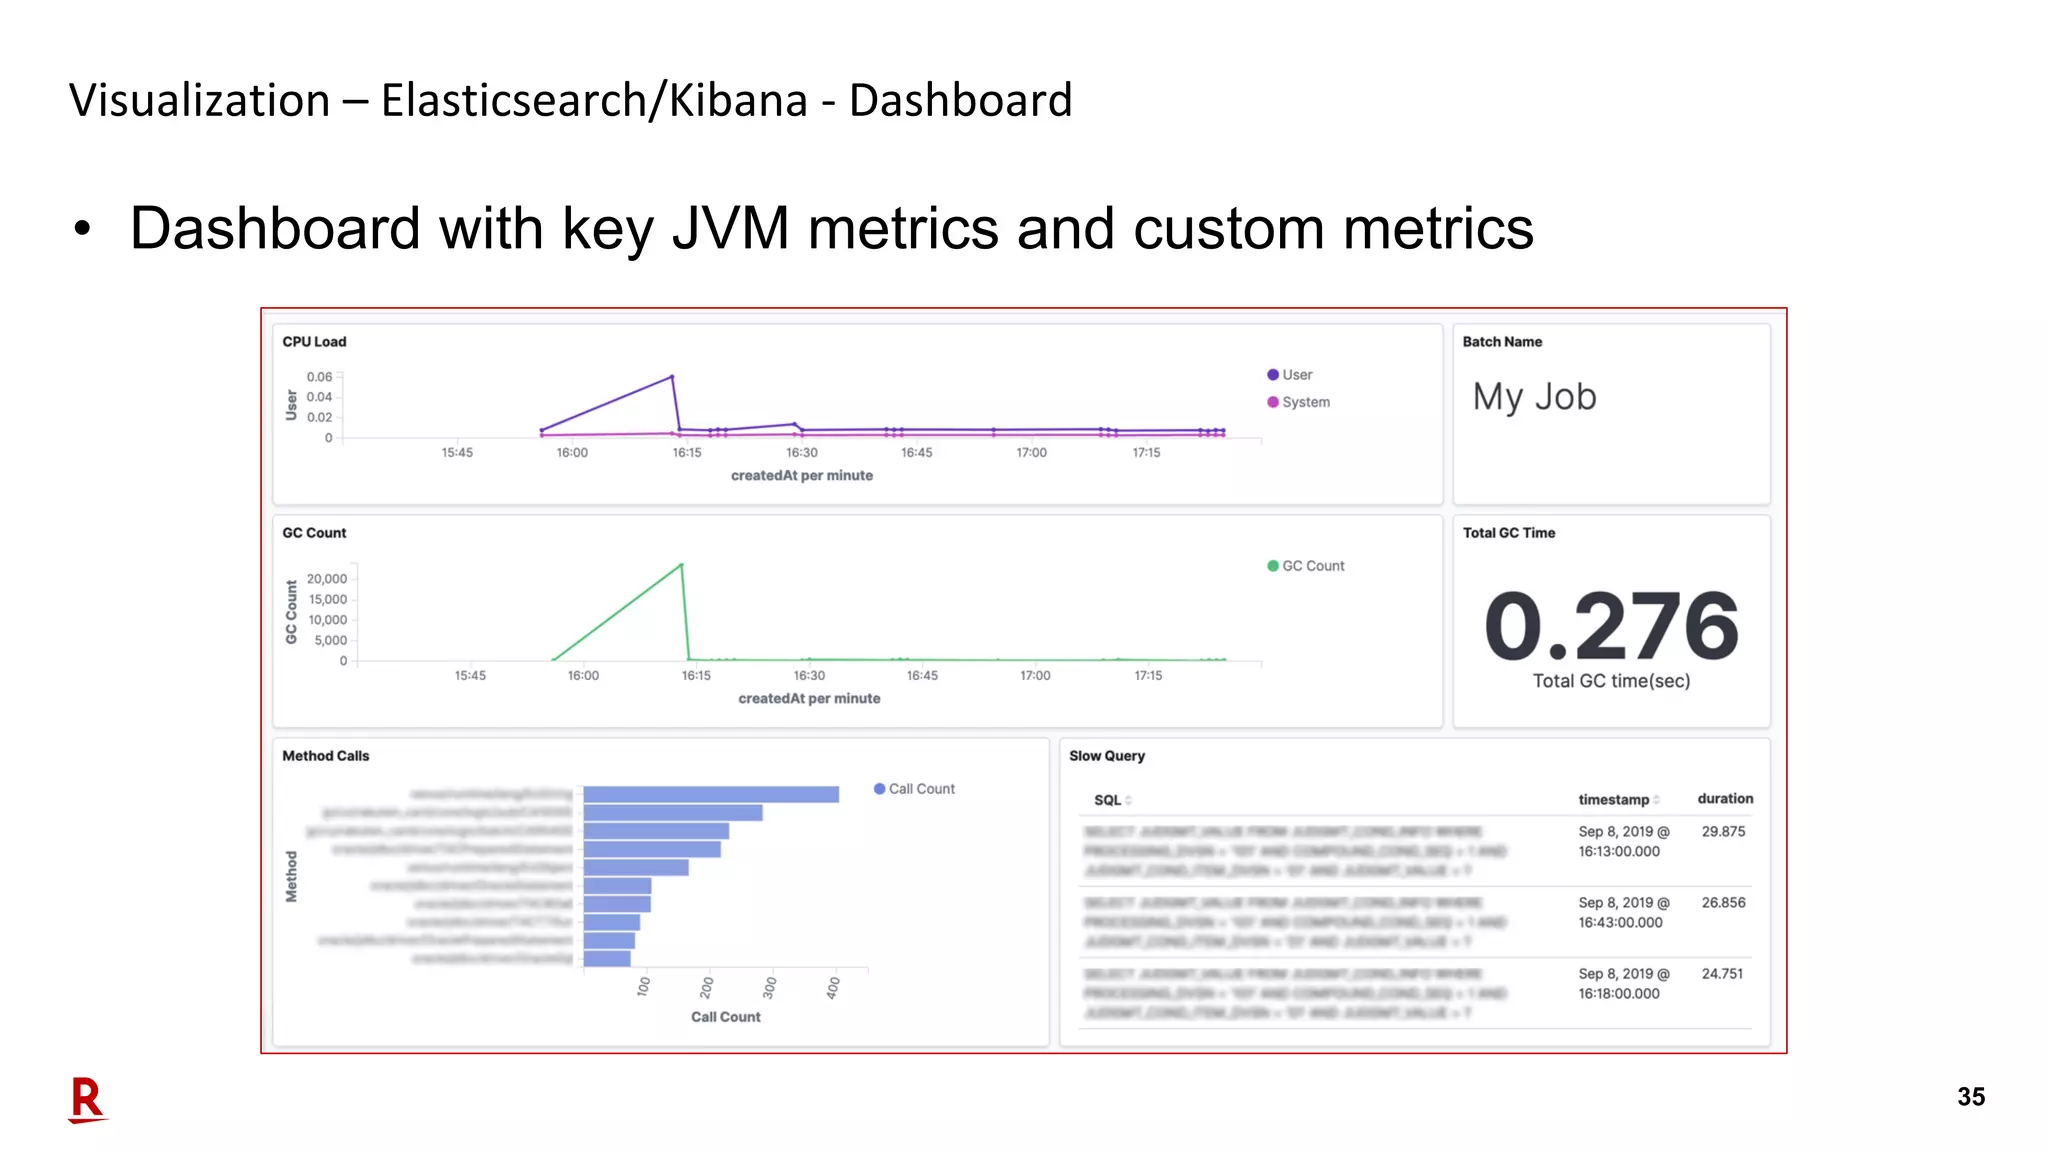
35 Visualization – Elasticsearch/Kibana - Dashboard • Dashboard with key JVM metrics and custom metrics
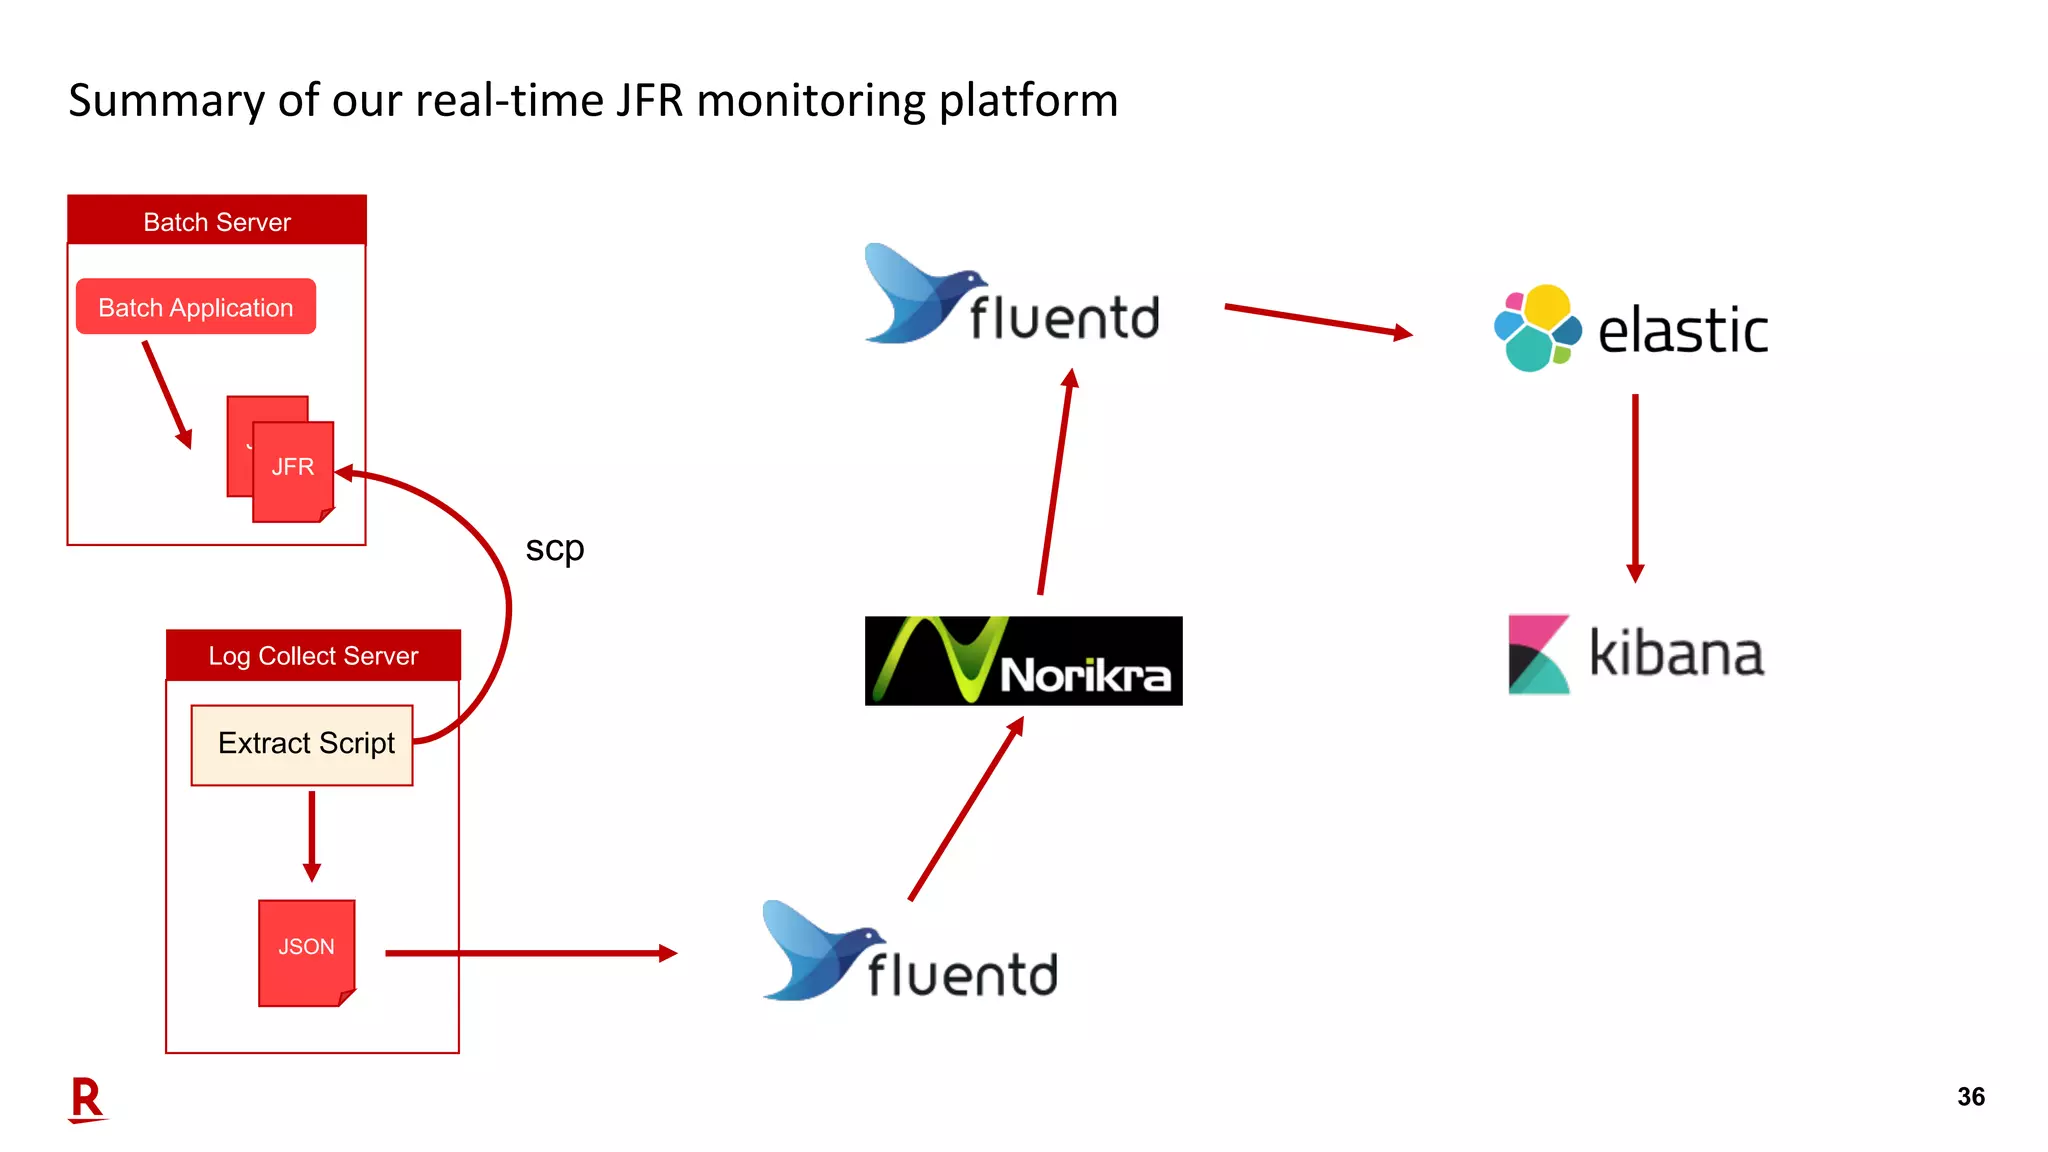
36 Summary of our real-time JFR monitoring platform Batch Server Batch Application JFR JFR Log Collect Server Extract Script JSON scp
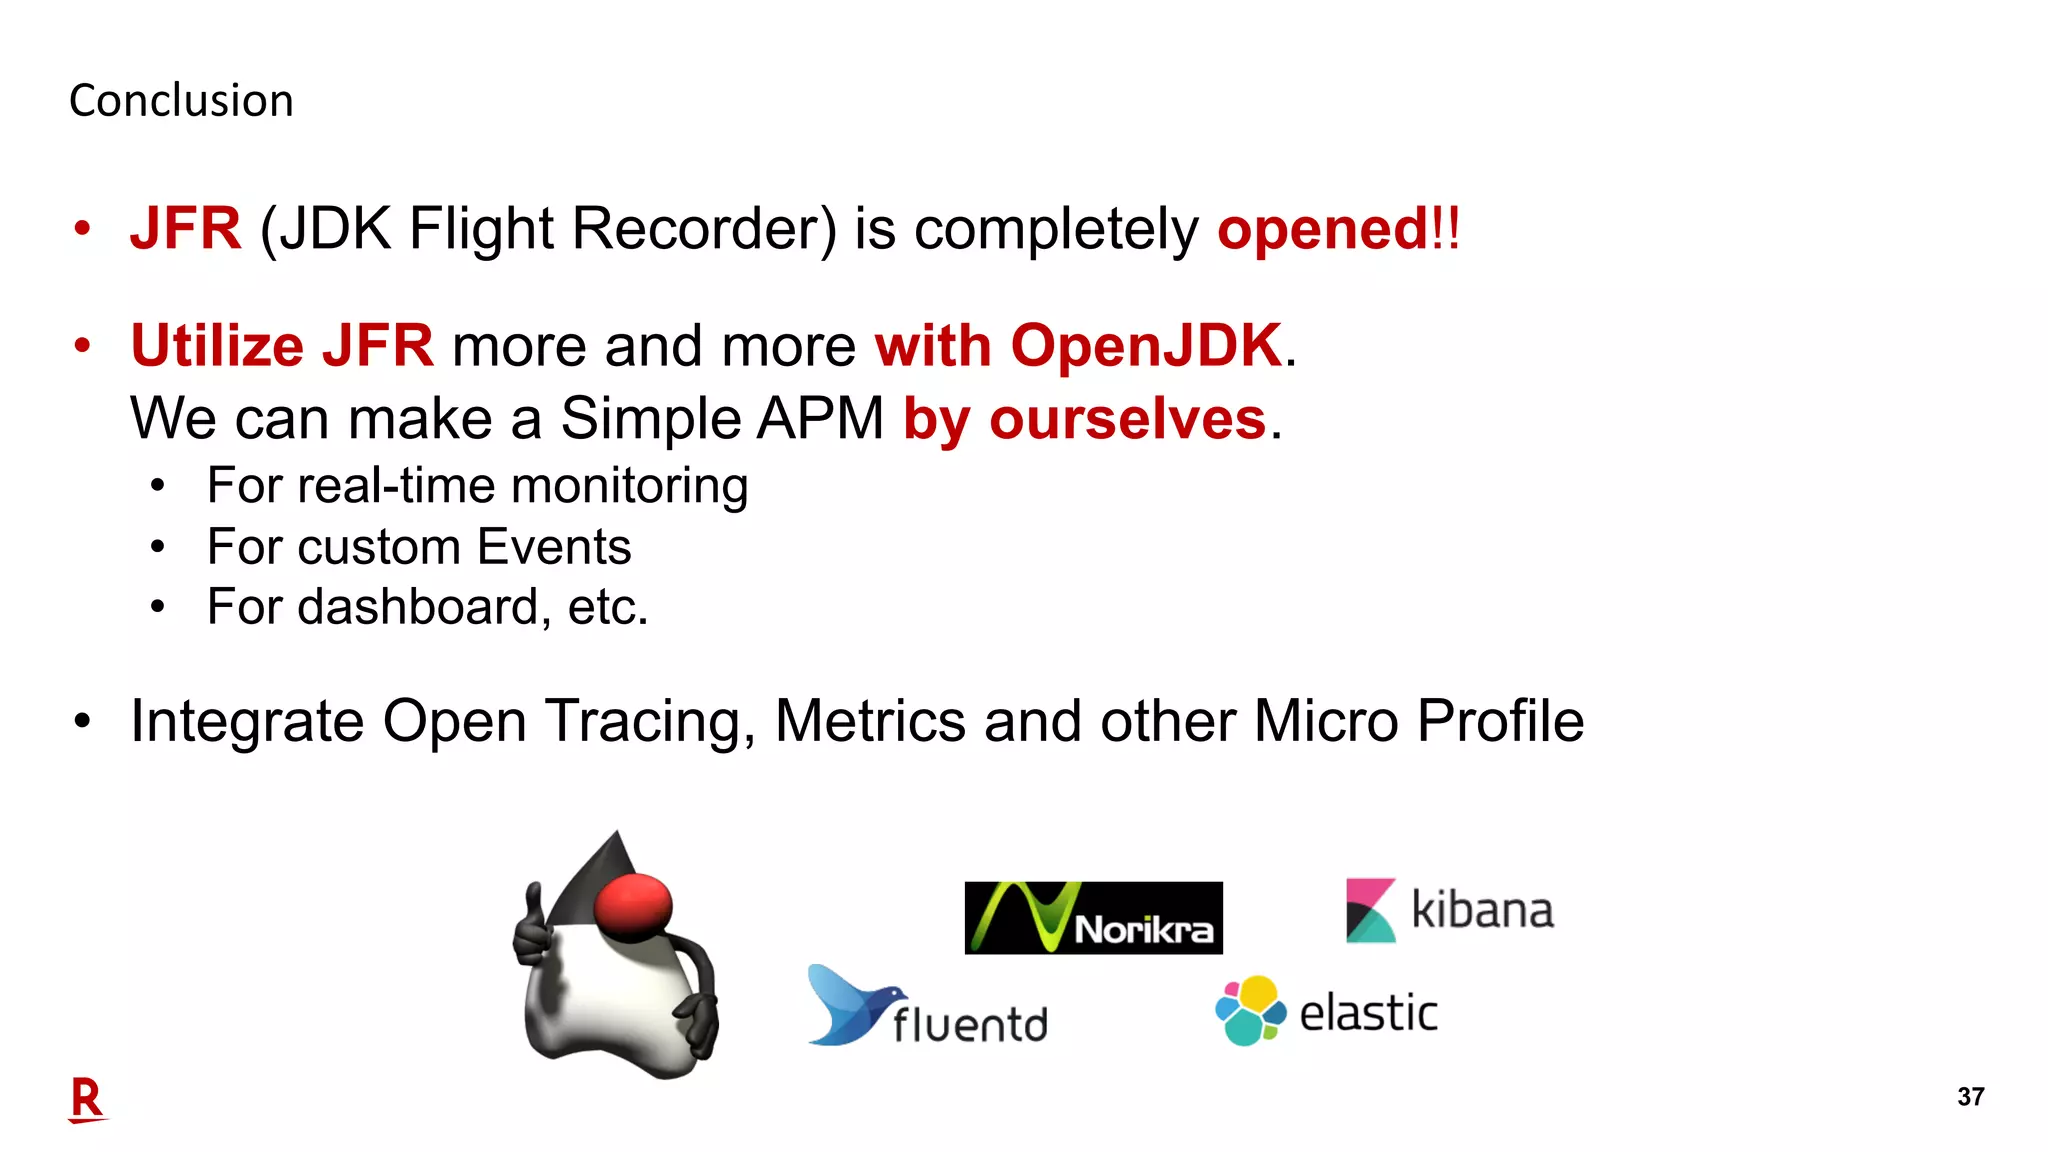
37 Conclusion • JFR (JDK Flight Recorder) is completely opened!! • Utilize JFR more and more with OpenJDK. We can make a Simple APM by ourselves. • For real-time monitoring • For custom Events • For dashboard, etc. • Integrate Open Tracing, Metrics and other Micro Profile
38 Q&A
Performance Monitoring with Java Flight Recorder on OpenJDK [DEV2406]

Performance Monitoring with Java Flight Recorder on OpenJDK [DEV2406]

  • 1.
    Performance Monitoring with JavaFlight Recorder on OpenJDK [DEV2406] Sep 19, 2019 Hirofumi Iwasaki Hiroaki Nakada Rakuten Card Co., Ltd.
  • 2.
    2 Agenda Part 1 • OurCompany & Our Challenges with Java • JDK Flight Recorder(JEP 328) Part 2 • JDK Flight Recorder (JFR) for Business Process Monitoring • Our concerns • Custom Event/Benchmark • Pipeline and Visualization • Conclusion
  • 3.
  • 4.
    4 Speaker Biography Hirofumi Iwasaki@HirofumiIwasaki • Distinguished, Manager of Technology Strategy Group, System Strategy Department, Rakuten Card Co., Ltd. Career • Planning, designing & implementation of huge enterprise systems for financial, manufacturing and public systems with Java EE in Japan over 19 years. Opus, Lectures, etc. • Conferences: Code One 2018, JavaOne 2017, 2015-2014, OOW 2017, 2014, Java Day Tokyo 2015-2014, Rakuten Tech Conference 2017-2013, etc.
  • 5.
    5 Services of RakutenCard #1 credit card company in Japan • Core of Rakuten group ecosystems. • 1st position of total transaction volume in 2018. • Growing rapidly.
  • 6.
    6 History of RakutenCard systems 1993 20171969 1985 COBOL + Mainframe Japanese COBOL + Mainframe Machine Language + Mainframe + x86 architecture
  • 7.
    7 • We’re managingtons of amount of batches • Took over from old mainframe. • Running multiple batches in the same time • Sometimes hard to manage. Our Challenging Point: Batch Operations Migrated Mainframe +COBOL Current Core Systems Real-time processing Batch processing Tons of batch executions, must be managed
  • 8.
    8 Solution: JDK FlightRecorder (JFR) • We introduced JDK Flight Recorder for each process monitoring. • Also needed • Real-time process monitoring • Data aggregation for reporting
  • 9.
    9 About JDK FlightRecorder (JFR) • Now opened, donated from Oracle to community (JEP 328) • Name changed: • JRockit Flight Recorder • à Java Flight Recorder • à JDK Flight Recorder (still “JFR”) • JFR is great for: • Failure management when something down • Production usage due to its low loading • New API provided since JDK 9, great for with JDK 11 (LTS) • Free usage
  • 10.
    10 History of “JFR” JDK7u40- JavaFlight Recorder 0.9 Java Flight Recorder 1.0 JDK Flight Recorder 2.0 JRockit Flight Recorder JDK9- JDK11- BEAJRockit àOracleJRockitOracleJDKOpenJDK Donated, Free AcquiredJRockit JDK6 Merged
  • 11.
    11 Usage of JFR JavaVM JFR App Servers App App App JDK Mission Control (GUI) JFR tool (new CLI, lightweight) Manage output jfr file Visualize Other tools
  • 12.
    12 How to useJFR 1. Boot Java VM with JFR options. (that’s all, already included) -XX:StartFlightRecording= delay=10, disk=true, dumponexit=true, dulation=0, filename=recording.jfr, name=recording, maxage=1d, maxsize=1g, path-to-gc-roots=true settings=settings.jfc Other start method: 2. jcmd <pid> JFR.start 3. Java API Recording#start() 4. JMX API 5. Java Mission Control
  • 13.
  • 14.
    14 Speaker Biography Hiroaki Nakada@koduki • Senior Software Engineer of System Development Department, Rakuten Card Co., Ltd Career • 10 years at Rakuten for Financial Service • Java EE, Web Systems, Batch, Security, Cloud and Modernization Opus, Lectures, etc. • Conferences: Rakuten Technology Conference 2015-2016
  • 15.
    15 Our concerns • JFRis a great tool for diagnostic and profiling on production. • Our concerns for JFR • Real-time analysis • Integrate other tools • Custom metrics source: https://en.wikipedia.org/wiki/Flight_recorder
  • 16.
    16 Key features ofJFR for our concerns
  • 17.
    17 What is CustomEvent? • JDK has Custom Even API to extend JFR • Since the JDK 7, Oracle JDK has unsupported APIs. • Since the JDK 9, Oracle/OpenJDK has new supported APIs. Unsupported APIs com.oracle .jrockit.jfr jdk.jfr Supported APIs
  • 18.
    18 What is CustomEvent? – Sample Code import jdk.jfr.*; public class Hello { @Label("Hello World") @Category({"Sample", "My Custom Event"}) static class HelloWorldEvent extends Event { @Label(”My Message") String msg; } public static void main(String... args) throws Exception { HelloWorldEvent event = new HelloWorldEvent(); event.msg = "Hello World event message!"; event.commit(); } } Make JFR Event Use JFR Event above
  • 19.
    19 What is CustomEvent? – Sample Code import jdk.jfr.*; public class Hello { @Label("Hello World") @Category({"Sample", "My Custom Event"}) static class HelloWorldEvent extends Event { @Label(”My Message") String msg; } public static void main(String... args) throws Exception { HelloWorldEvent event = new HelloWorldEvent(); event.msg = "Hello World event message!"; event.commit(); } } JDK Mission Control
  • 20.
    20 What is CustomEvent? import jdk.jfr.*; public class Hello { @Label("Hello World") @Category({"Sample", "My Custom Event"}) static class HelloWorldEvent extends Event { @Label(”My Message") String msg; } public static void main(String... args) throws Exception { HelloWorldEvent event = new HelloWorldEvent(); event.msg = "Hello World event message!"; event.commit(); } } JDK Mission Control
  • 21.
    21 Apply Custom Eventfor our Batch Application • Apply Custom Event for our batch application. • DB access library • File access library JDK Mission Control
  • 22.
    22 Benchmark for CustomEvent • JFR costs super low overhead (under 3%!)
  • 23.
    23 Analyze JFR Logs •JDK Mission Control for JFR viewer. • Two methods for analysis of JFR with OpenJDK • JFR consumer API • jfr tool (JDK-8205517)
  • 24.
    24 Analyze JFR Logs- Consumer API • Consumer API supports easy analysis by Java • Get JFR events as List and filter/transform by Stream API List<RecordedEvent> events = RecordingFile.readAllEvents(Path.of("dump.jfr")).stream() .filter((e) -> e.getEventType().getName() .equals(Hello.HelloWorldEvent.class.getName())) .collect(Collectors.toList()); for (int i = 0; i < 5; i++) { System.out.println((String)events.get(i).getValue("msg")); } > 2 messages! > 3 messages! > 4 messages! > 5 messages! > 6 messages!
  • 25.
    25 Analyze JFR Logs– jfr tool • jfr tool is a new utility to extracting, assemble and split for JFR file. • Available since OpenJDK 12 (probably backporting to JDK 11) Option Description jfr print [--xml|--json] [--categories <filter>] [--events <filter>] [--stack-depth <depth>] <file> Print contents of a recording file. It supports Text, XML and JSON. categories and event option is filter by name with glob patterns. stack-depth is number of frames in stack traces, by default 5. jfr metadata <file> Display event metadata, such as labels, descriptions and field layout jfr summary <file> Display general information about a recording file (.jfr) jfr assemble <repository> <file> Assemble leftover chunks from a disk repository into a recording file jfr disassemble [--output <directory>] [--max-chunks <chunks>] [--max-size <size>] <file> Disassamble a recording file into smaller files/chunks
  • 26.
    26 Analyze JFR Logs– jfr tool – example of print $ jfr print --json --categories GC --events jdk.GCPhaseParallel sample.jfr { "recording": { "events": [{ "type": "jdk.GCPhaseParallel", "values": { "startTime": "2019-09-04T09:43:30.056871672-08:00", "duration": "PT0.000000518S", "eventThread": { "osName": "GC Thread#5", "osThreadId": 38915, "javaName": null, "javaThreadId": 0, ….
  • 27.
    27 Our strategy ofreal-time JFR monitoring platform
  • 28.
    28 Our strategy ofRealtime Analysis • A simple log analysis pipeline • Using JSON with jfr tool and Fluentd • Pre processing by Norikra before Elasticsearch • Real-time visualization by Kibana • Anything you want tools! JSON with jfr tool Extract JFR Log Collector Pre processing Visualization
  • 29.
    29 Extract JFR andLog collector • Make a simple JFR extract script • Extract script get JFR log and extract to JSON • Fluentd confirm difference of updated JSON Batch Server Batch Application JFR JFR Log Collect Server Get JFR log Extract Script Extract to JSON Add meta information Remove duplicate Export JSON JSON scp
  • 30.
    30 Extract JFR andLog collector – Extract Script • This is core logic of extract script. • Extract to JSON from JFR • Transform to Fluentd readable JSON(jq –c .) • Add meta information(Batch Name) cp -f ${INPUT_JFR} ./chunk.jfr jfr print --json --categories GC,Profiling,Processsor,Heap,MyApp --events jdk.GCPhaseParallel,jdk.ExecutionSample,jdk.CPULoad,jdk.GCHeapSummary, myapp.FileReaderEvent,myapp.DBReadEvent --stack-depth 10 chunk.jfr |jq '.recording.events[]' | jq -c '.|= .+ {"batchName": "'${BATCH_NAME}'"}' > ./chunk.json
  • 31.
    31 Extract JFR andLog collector – Extracted JSON {"type":"jdk.CPULoad","value":{"startTime":"2019-09-08T16:13:01.980014338- 08:00","jvmUser":0.23814254,"jvmSystem":0.019405695,"machineTotal":0.5409429},"batchName":" MyJob"} {"type":"myapp.FileReaderEvent","value":{"startTime":"2019-09-08T16:13:50.255682648- 08:00","duration":"PT0.000012787S",..., "fileId":”EXAMPLEI1","filePath":"target/EXAMPLEI1","isVariableFile":false},"batchName":"MyJ ob"} {"type":"jdk.GCPhaseParallel","value":{"startTime":"2019-09-08T16:13:50.964675810- 08:00","duration":"PT0.000000684S","eventThread":{"osName":"GC Thread#0","osThreadId":12035,"javaName":null,"javaThreadId":0,"group":null},"gcId":123,"gcW orkerId":0,"name":"ObjCopy"},"batchName":"MyJob"} {"type":"jdk.ExecutionSample","value":{"startTime":"2019-09-08T16:13:00.267202865- 08:00",...,"stackTrace":{"truncated":false,"frames":[{"method":[...]},"state":"STATE_RUNNAB LE"},"batchName":"MyJob"} • One record, one JFR event.
  • 32.
    32 Extract JFR andLog collector – JVM Options for JFR • JFR 2.0 options are changed from Oracle Java Flight Recorder 0.9 . • Chunk size default is 12 MB, we need to change around 1MB due to performance. -XX:StartFlightRecording=settings=profile, disk=true,maxage=3m, filename=${BATCH_NAME}.jfr -XX:FlightRecorderOptions=maxchunksize=1M,memorysize=1M, repository=${BATCH_NAME}/jfr_logs/ $ ls -lh jfr_logs/2019_09_09_11_03_48_24609 total 33864 -rw-r--r-- 1 hiroaki.nakada hiroaki.nakada 1.5M Sep 9 11:03 2019_09_09_11_03_48.jfr -rw-r--r-- 1 hiroaki.nakada hiroaki.nakada 1.5M Sep 9 11:04 2019_09_09_11_04_05.jfr -rw-r--r-- 1 hiroaki.nakada hiroaki.nakada 1.6M Sep 9 11:04 2019_09_09_11_04_12.jfr -rw-r--r-- 1 hiroaki.nakada hiroaki.nakada 1.4M Sep 9 11:04 2019_09_09_11_04_25.jfr -rw-r--r-- 1 hiroaki.nakada hiroaki.nakada 1.4M Sep 9 11:04 2019_09_09_11_04_44.jfr -rw-r--r-- 1 hiroaki.nakada hiroaki.nakada 0B Sep 9 11:04 2019_09_09_11_04_52.jfr
  • 33.
    33 Pre processing -Norikra • Use stream processing engine to simplify Elasticsearch/Kibana logics. • Norikra supports stream processing with SQL Nested structure to Flatten record Parse format like Number/Date/Duration Remove unused columns
  • 34.
    34 Visualization – Elasticsearch/Kibana •Visualize by Elasticsearch and Kibana • CPU Load, GC, Methods sampling, Our custom events • Real-time and automatic update
  • 35.
    35 Visualization – Elasticsearch/Kibana- Dashboard • Dashboard with key JVM metrics and custom metrics
  • 36.
    36 Summary of ourreal-time JFR monitoring platform Batch Server Batch Application JFR JFR Log Collect Server Extract Script JSON scp
  • 37.
    37 Conclusion • JFR (JDKFlight Recorder) is completely opened!! • Utilize JFR more and more with OpenJDK. We can make a Simple APM by ourselves. • For real-time monitoring • For custom Events • For dashboard, etc. • Integrate Open Tracing, Metrics and other Micro Profile
  • 38.