Download to read offline

![PHP profiling/perfomance ApacheBenchmark ab -n 50 -c 2 -v 1 -p 'post.txt' -T 'application/json' -H 'Authorization: Bearer eyJ0eXAi.eyJpc3nYXJ.KznbYbc' 'http://api.gma.my/account/authenticate?alt=json&metadata [foo]=Hello&metadata[bar]=World&metadata[random Val]=Ted' > bench.txt { "application_key":"afaf770", "email":"ndegardin@tribalnova.com", "key":"ndegardin« } post.txt](https://image.slidesharecdn.com/profiling-150522150052-lva1-app6892/75/PHP-Profiling-performance-8-2048.jpg)
![PHP profiling/perfomance … Concurrency Level: 2 Time taken for tests: 25.704 seconds Complete requests: 50 Failed requests: 44 (Connect: 0, Receive: 0, Length: 44, Exceptions: 0) Write errors: 0 Non-2xx responses: 50 Total transferred: 2231974 bytes Total POSTed: 28100 HTML transferred: 2220474 bytes Requests per second: 1.95 [#/sec] (mean) Time per request: 1028.176 [ms] (mean) Time per request: 514.088 [ms] (mean, across all concurrent requests) Transfer rate: 84.80 [Kbytes/sec] received 1.07 kb/s sent 85.86 kb/s total Connection Times (ms) min mean[+/-sd] median max Connect: 0 0 0.1 0 0 Processing: 704 1014 154.5 990 1693 Waiting: 704 1014 154.5 990 1693 Total: 705 1015 154.5 990 1693 … bench.txt](https://image.slidesharecdn.com/profiling-150522150052-lva1-app6892/75/PHP-Profiling-performance-9-2048.jpg)
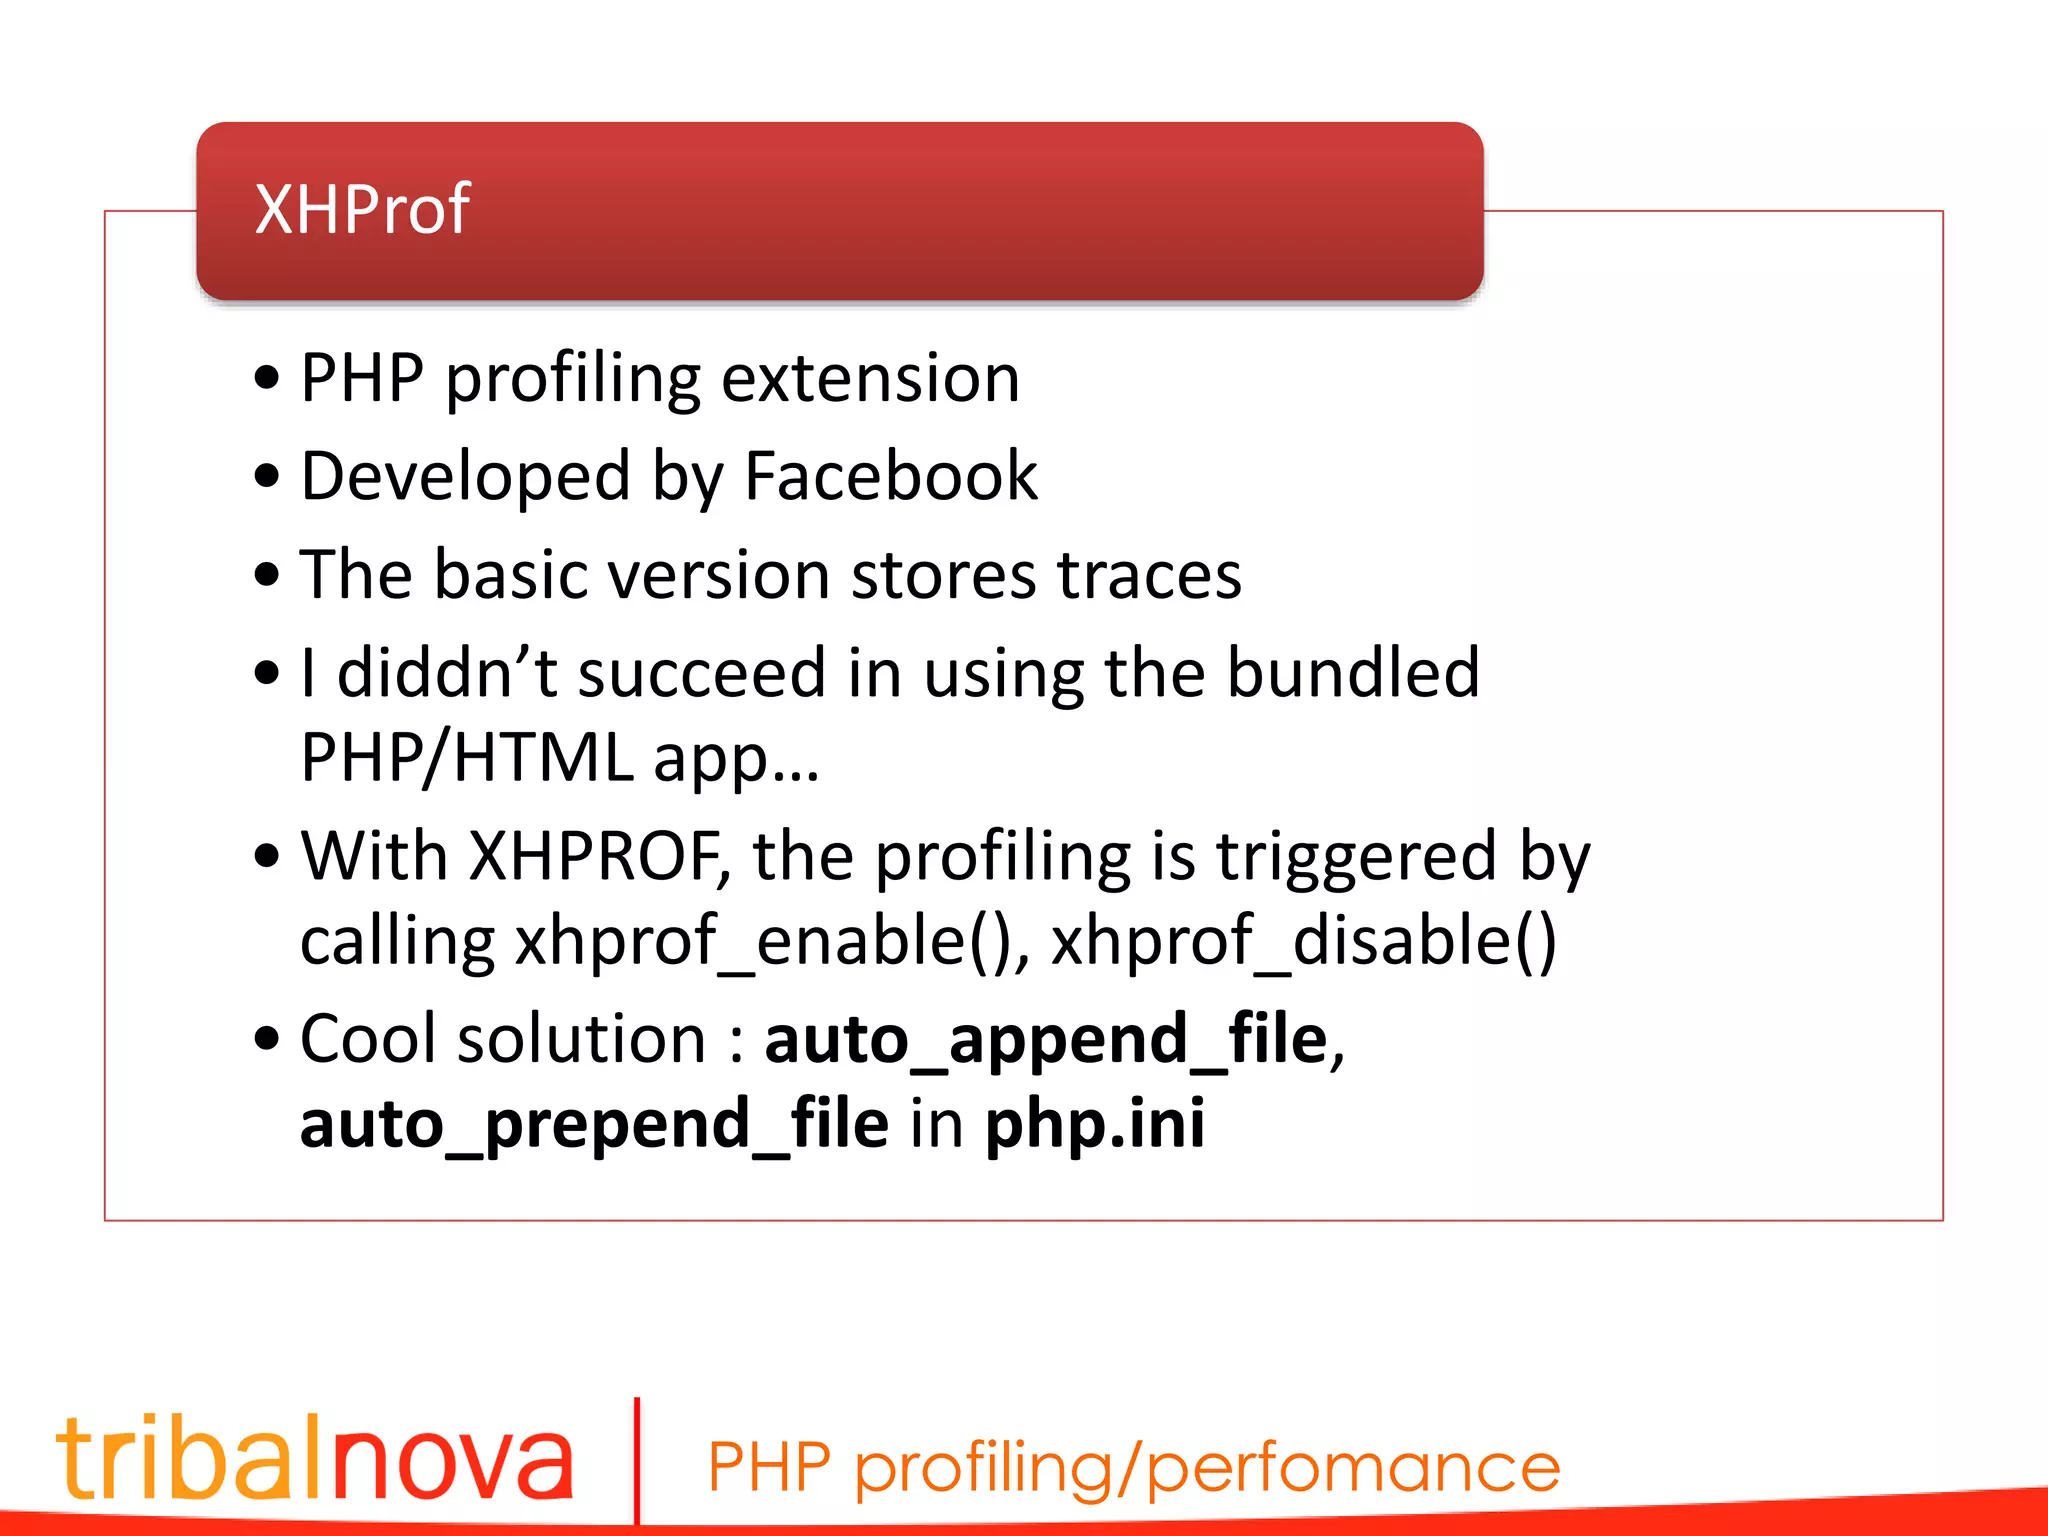
![PHP profiling/perfomance • Activate profiling by vhost in Apache • Activate profiling by using a nginx/PHP-FPM pool : /etc/php5/fpm/pool.d/www.conf : • Activate profiling by vhost in nginx/PHP-FPM, in a location section XHProf notes fastcgi_param PHP_ADMIN_VALUE "auto_prepend_file=/var/www/xhprof/external/header.phpnauto_append_file=/var/ www/xhprof/external/footer.php"; php_admin_value auto_prepend_file "/var/www/xhprof/external/header.php" php_admin_value auto_append_file "/var/www/xhprof/external/footer.php" php_admin_value[auto_prepend_file] = /var/www/xhprofio/inc/prepend.php" php_admin_value[auto_appendfile] = /var/www/xhprofio/inc/append.php"](https://image.slidesharecdn.com/profiling-150522150052-lva1-app6892/75/PHP-Profiling-performance-13-2048.jpg)
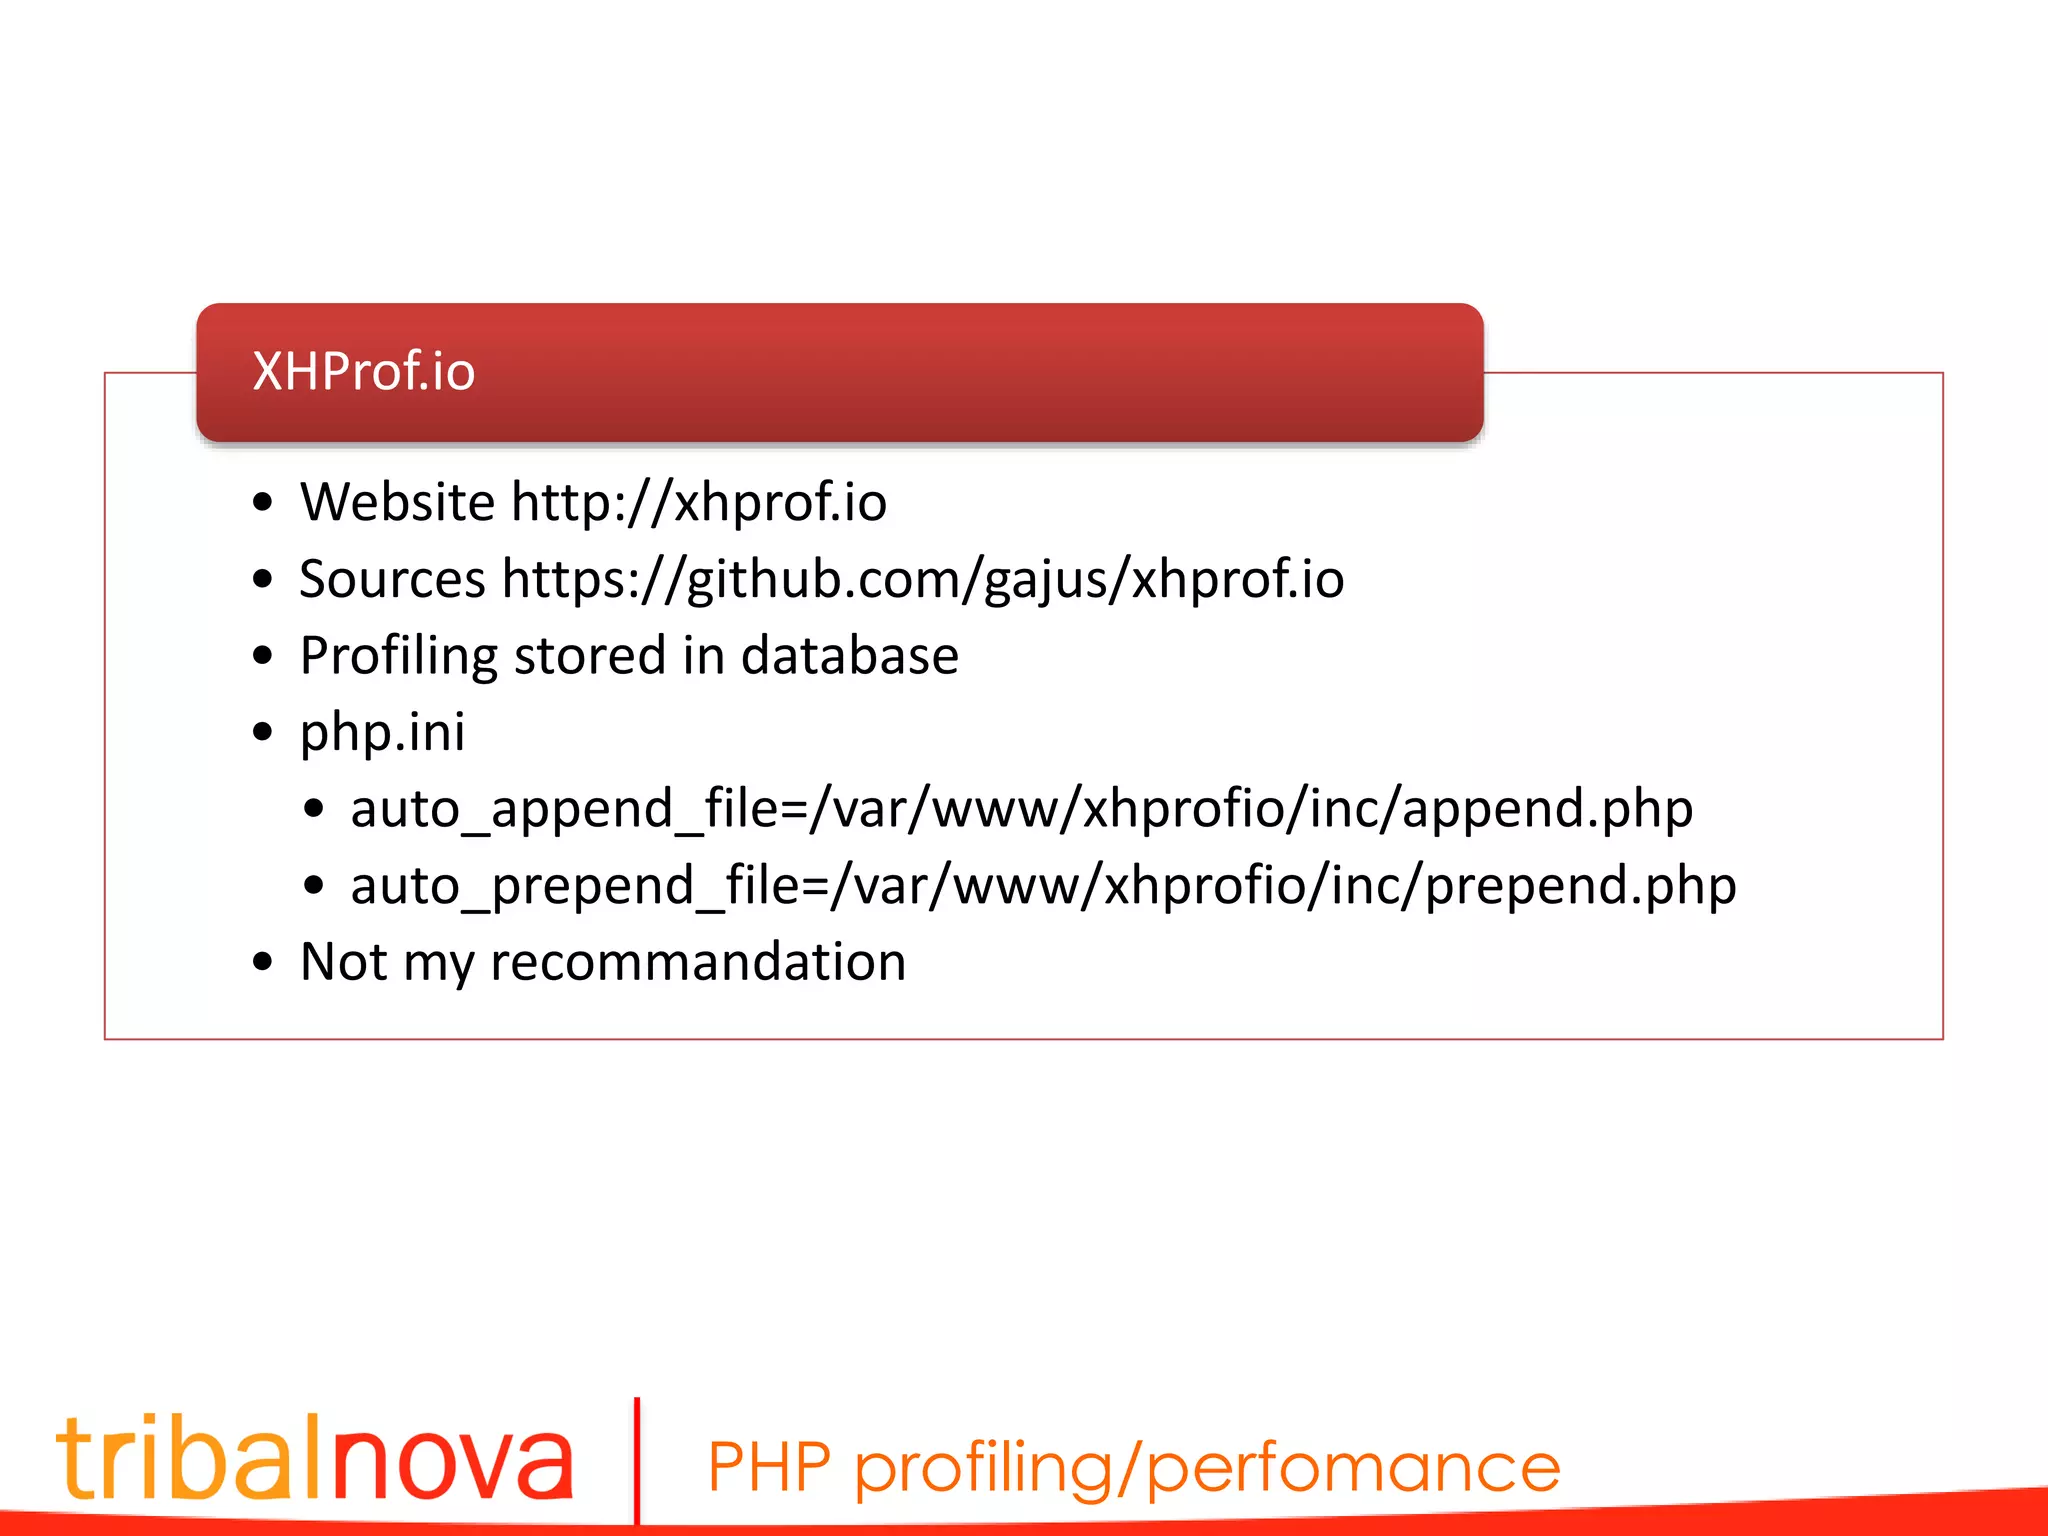
![PHP profiling/perfomance • The traces are stored as files • It often weights about 2Mo (be careful when forgetting it) • Using a fixed name (without timestamp) in php.ini xdebug.profiler.output_name allows a run script to erase the previous one • No official Xdebug trace extension, I suggest cachegrind.out.[…].xt • Profilers : • WinCacheGrind (Windows) : somewhat simple • WebGrind (Web) : « For quick’n’dirty optimizations it does the job » • KCacheGrind (KDE) : the best one • PHPStorm : not really useful Xdebug notes about profiling](https://image.slidesharecdn.com/profiling-150522150052-lva1-app6892/75/PHP-Profiling-performance-17-2048.jpg)


This document discusses various tools and techniques for profiling PHP performance, including Xdebug, XHProf, and KCacheGrind. It provides information on setting up and using these tools to detect bottlenecks and optimize code. Specific configuration options are outlined for profiling PHP applications running on Apache, Nginx, and CLI. Metrics like processing time, memory usage, and I/O are identified as important factors to analyze. The goal of profiling is to understand where time is being spent and identify opportunities to improve scalability through code optimizations and server configuration changes.