Overview
The Flutter step line chart is similar to the line chart, but it does not use the shortest distance to connect two data points using diagonal lines. Instead, the step line chart uses vertical and horizontal lines to connect data points in a series forming a step-like progression. You can create beautiful, animated, real-time and high-performance step line chart that also supports the interactive features such as zooming and panning, trackball, crosshair, tooltip and selection.

Key features
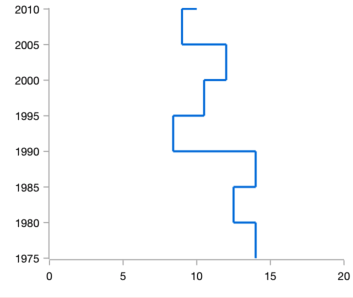
Vertical rendering
Rotate the Flutter Step Line Chart to plot data in a vertical direction and view data from a different perspective.
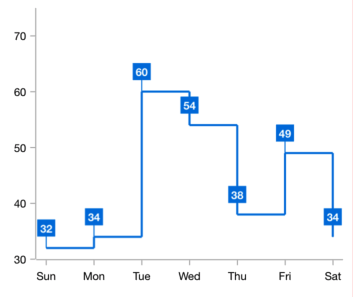
Data labels
Data points can easily be annotated with data labels to improve readability.
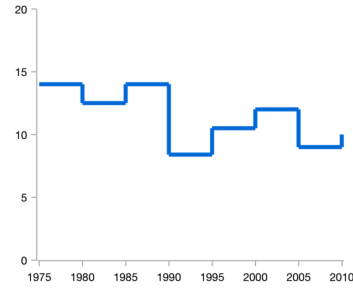
Customization
Customizes the color and thickness of the Flutter Step Line Chart using built-in APIs to make it visually unique.
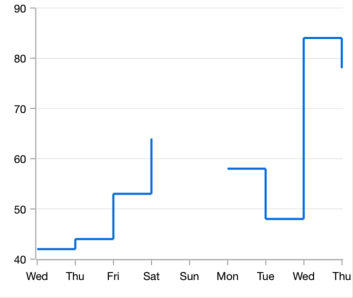
Empty or null data point
The Flutter Step Line Chart handles empty or null data points elegantly.
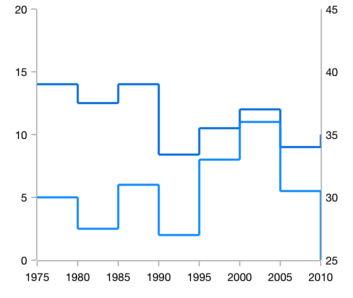
Multiple axes
Use multiple axes to plot different data sets that widely vary from one other.
Learning resources


Flutter Step Line Chart User Guide
Learn available options to customize the Flutter Step Line Chart.
